





Introduction
Public opinion surveys are one of the most potent tools for studying mass politics in democratic settings. The emergence of these techniques can be traced back to the 1930s in the United States, where generations of scholars, journalists, and policymakers have since benefited from publicly available data to harvest insights about the mass public’s attitudes on a wide variety of salient topics (Lazarsfeld et al. Reference Lazarsfeld, Berelson and Gaudet1948; Zaller Reference Zaller1992). Since then, the reach of public opinion surveys has spread across the globe, including to newly consolidating democracies in recent years (Inglehart Reference Inglehart2020; Liddle and Mujani Reference Liddle and Mujani2007) But in these contexts, publicly available public opinion surveys are often in short supply. As many of these places are low- and middle-income contexts, government-funded research to provide these sorts of academic public goods are often constrained. And, perhaps more conspiratorially, in contexts with recent authoritarian pasts, governments may be wary to make readily available tools for measuring mass sentiment.
As a lower middle-income country, and the world’s third most populous democracy, Indonesia exhibits many of these challenges. Since the fall of Suharto in 1998, and the return of electoral democracy in 1999, Indonesia has seen the emergence of a robust domestic political polling industry (Mietzner Reference Mietzner2009). There have even been attempts to generate publicly available datasets of Indonesian public opinion—initiatives such as the Asian Barometer Survey (Asian Barometer Project Reference Project2025), the Indonesian Family Life Survey (conducted by the RAND corporation) (Strauss et al. Reference Strauss, Witoelar and Sikoki2016b), and the long-running World Values Survey. But these efforts have been sporadic, and they provide only fleeting glimpses into the nature of Indonesian public opinion. Instead, on balance, insights into the evolution of Indonesians’ attitudes are locked behind the high costs of fielding nationally representative face-to-face surveys.
In this note, we introduce a new initiative, Surveys on Indonesians’ Knowledge of and Attitudes on Politics (SIKAP), in which we fielded weekly surveys of 1,650 voters over the course of 58 weeks, beginning in late 2023 and ending in early 2025. To facilitate the scale and scope of data collection under budget constraints, the surveys were conducted online through a convenience sampling technique with a series of demographic quotas to target representativeness. Each survey included a harmonized “core” set of modules in which we asked the same questions, enabling researchers to study the evolution of attitudes as a function of unfolding events at a high resolution. Importantly, all of the data associated with the project has been publicly released for researchers to use.
In the remainder of the note, we briefly situate SIKAP in the history of public opinion surveys in Indonesia. We then turn to the data collection strategy and diagnose the quality of the data by benchmarking it against both available election results and face-to-face surveys conducted through random sampling techniques. The results of this exercise suggest the SIKAP data does a surprisingly good job of capturing its population-level reference parameters, probably owing to the comparatively low-levels of educational polarization in Indonesia, and which represents the main demographic variable along which online surveys are unrepresentative. We then turn to an application of our data to demonstrate its utility for researchers, examining, first, how support for incumbent president Joko Widodo (Jokowi) shifted before, during, and after an August 2024 constitutional crisis, and then, second, how support for democracy among voters declined as a function of electoral defeat.
Public opinion surveys in Indonesia
The emergence of surveys on political opinion in Indonesia coincided with the collapse of Suharto’s authoritarian regime in 1998 and the democratization that followed (Mietzner Reference Mietzner2009). The technical know-how was first cultivated through a series of local quick counts done by the Institute for Economic and Social Research, Education, and Information (LP3ES, Lembaga Penelitian, Pendidikan dan Penerangan Ekonomi dan Sosial) in the 1997 and 1999 legislative elections. The implementation of multi-member open-list system and the direct presidential election in the 2004 elections elevated the importance of political surveys. Politicians faced incentives to figuring out, a priori, if they had enough support to win a seat. Political parties wanted to know which presidential candidate had the best chance so they could strategize accordingly by joining the coalition with the highest chance of winning. Furthermore, since voters began to genuinely play a greater role in deciding the character of government in Indonesia, public opinion surveys also provided politicians, academics, and interested citizens with the tool to gauge public sentiments on current affairs and issues beyond the elections, from presidential approval, policy debates, economic perceptions, to intergroup attitudes.
Looking back at the growing popularity of and public acceptance toward public opinion surveys, we can identify two significant evolutions in the substantive-technical and organizational aspects of these surveys. The substantive-technical evolution concerns developments in research questions and survey design, whereas the organizational evolution concerns the industrialization and internationalization of the survey market.
Substantive evolution: From describing to explaining
Around mid-2000s, social scientists started to use public opinion data to theorize about Indonesian voters’ political behavior. This early use was characterized by descriptive approaches and correlational framework. The focus was on understanding how variables were associated with each other, rather than on establishing causal claims. Some studies adopted a bivariate analysis, examining how two variables are related to each other, such as in the case of demographic characteristics and support for Islamism (Mujani and Liddle Reference Mujani and Liddle2004) or support for Islamism and vote preference (Mujani and Liddle Reference Mujani and Liddle2009). Other studies employed regression models that allowed researchers to test and control for the effects of multiple variables at once (Liddle and Mujani Reference Liddle and Mujani2007; Mujani and Liddle Reference Mujani and Liddle2010).
In the early 2010s, descriptive and correlational studies started to be complemented—though not replaced—by studies that emphasized causal claims. Arguably, this phase was most evidently marked by the publication of Pepinsky, Liddle, and Mujani (Reference Pepinsky, Liddle and Mujani2012), in which they employed a survey experiment to examine the extent to which Islamist parties are advantaged over non-Islamist parties. Survey experiments became more common in Indonesian political science research and scholars started to use the method to study topics ranging from identity politics in polarized elections (Sumaktoyo Reference Sumaktoyo2021), intolerance (Toha et al. Reference Toha, Gueorguiev and Sinpeng2021), partisanship, and support for democracy (Fossati et al. Reference Fossati, Muhtadi and Warburton2021), to the effects of foreign policy events on anti-Chinese sentiments (Sumaktoyo and Muhtadi Reference Sumaktoyo and Muhtadi2022).
As scholars became more comfortable with survey methods, the variety and sophistication of surveys fielded evidently grew. Another significant milestone was created when researchers began to study groups other than the general voting population. Fossati and colleagues, for example, fielded what to our knowledge was the first systematic survey of Indonesian political elites by sampling and interviewing 508 politicians sitting in local legislative councils (Fossati et al. Reference Fossati, Aspinall, Muhtadi and Warburton2020; Warburton et al. Reference Warburton, Muhtadi, Aspinall and Fossati2021). This pioneering study provided a framework and cultivated technical knowledge for future research. In a later study, Hsiao and Kuipers (Reference Hsiao and Kuipers2025) fielded a three-wave longitudinal elite survey, surveying 800 politicians running in the 2024 legislative elections. In addition to these surveys of political elites, it is also worth noting that several research institutes published research reports based on representative surveys of non-traditional target populations, such as Islamic studies teachers (Convey Indonesia Reference Indonesia2018) or high-school and university students (Syafruddin and Ropi Reference Syafruddin and Ropi2018).
Organizational evolution: Industrialization and internationalization
Simultaneously with the evolution in survey design and research questions, another important change took place. The insights offered by opinion surveys to politicians and the public alike nurtured demand for these surveys, which in turn led to the professionalization and industrialization of the market. Survey agencies were founded that specialize in social research, political research, or even combining political research with political consultancy. Some notable firms or organizations in the industry include the Indonesian Survey Institute (Lembaga Survei Indonesia or LSI), Indikator Politik Indonesia, Saiful Mujani Research and Consulting (SMRC), SurveyMeter, Charta Politika, and the Center for Strategic and International Studies (CSIS). The Union of Indonesian Public Opinion Surveys (Persepi or Perkumpulan Survei Opini Publik Indonesia), a professional association akin to the American Association of Public Opinion Research (AAPOR), was also established to ensure the firms conduct surveys that are both ethical and methodologically sound.Footnote 1
The establishment of a polling industry has had two consequences. First, to some extent, reputable survey agencies improve Indonesia’s quality of democracy by pushing for accountability, increasing transparency, and upholding the integrity of the electoral regime (Tomsa Reference Tomsa2020). The clearest example of this contribution is in election polling. Prior to the election, survey agencies regularly conduct surveys and report candidates’ electability. On election day, many of them conduct a quick count or an exit poll. These surveys and polls serve as guardrails that help protect election integrity by setting citizens’ expectations. It would raise questions, for example, if reputable pre-election and election-day surveys consistently predict one result, but then the electoral commission announces another result.
Another consequence of a survey industry is that it allows researchers to hire a firm and conduct their own surveys without having to build the infrastructure (e.g., network of interviewers and mechanisms to print, distribute, and collect questionnaires) from scratch. This does not necessarily mean that anyone can commission a survey. Fielding high-quality, representative public opinion surveys in Indonesia remains extremely expensive, given the geography of the country, and also because they are typically carried out face-to-face. Based on our own experiences, we estimate that, on average, the highest-quality survey firms in Indonesia charge between $30 and $60 per respondent (in 2025 USD).
However, a selection of reputable firms does mean that it is possible to collect quality survey data relatively easily provided one has the financial resources. This, and the general opening of the political system, opened the way for Indonesia to be included in several cross-national survey projects, such as the Comparative National Elections Project in 1999, the World Values Survey in 2001, and the Asian Barometer in 2006.
The inclusion of Indonesia in these projects is of particular importance. As data from these projects are publicly available, this means that even scholars who do not have the resources to collect original data on their own can still benefit from high quality political surveys. To some extent they level the playing field between scholars with more resources and those with less resources.
Surveys on Indonesians’ Knowledge of and Attitudes on Politics (SIKAP)
It is in the context of these two evolutions that we introduce our high-frequency Surveys on Indonesians’ Knowledge of and Attitudes on Politics (SIKAP) data. Being the first high-frequency political survey run in Indonesia, SIKAP is part of the substantive-technical evolution. It advances existing surveys that are primarily cross-sectional, constrained to narrow field periods, or follow idiosyncratic timing. In the case of international surveys, the timing depends on the main project’s timeline. The World Values Survey fielded their study in Indonesia in 2001, 2006, and 2018, whereas the Asian Barometer fielded theirs in 2006, 2011, 2016, 2019, and 2021. This sparse timing means that these surveys may have missed important political events such as elections and campaign seasons. The modules across these surveys are not harmonized, either, meaning the variables are often not comparable even if combining survey data across projects may yield greater temporal coverage.
The five-wave Indonesian Family Life Survey (IFLS; Strauss et al. Reference Strauss, Witoelar and Sikoki2016a) conducted by the RAND Corporation is one of the few exceptions to this cross-sectional norm, being a publicly available longitudinal public opinion survey, having been conducted since 1993. Starting in the fourth wave (2007/2008), continuing into its fifth (2013/14), the IFLS included sociopolitical modules gauging respondents’ attitudes about social trust and religion and politics. However, the IFLS is chiefly an economic and welfare-oriented survey, not a political one, meaning that its advantages in terms of its temporal coverage are partially outweighed by the absence of substantive focus on Indonesian politics.
As detailed below, SIKAP’s field period coincided with significant political events in 2024, including the presidential and legislative elections. SIKAP’s high-frequency design enables researchers to capture fluctuations in voters’ political attitudes in response to these events almost in real time. That some SIKAP respondents are repeat participants means that it is possible to examine within-subject variations in how voters respond to political events. Lastly, releasing SIKAP for public use is our contribution to encouraging data sharing, which we hope will help leveling the playing field among students of Indonesia, and data-driven research on Indonesian politics.
Data collection procedures
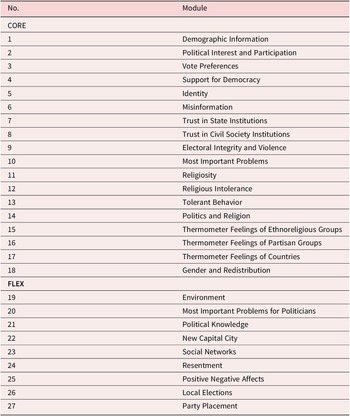
At its core, SIKAP is an initiative that revolves around weekly online surveys that we conducted over a 58-week period, starting on November 27, 2023 and concluding on January 5, 2025. This timeline encompasses several key political milestones in Indonesia, including the February 2024 presidential election, the October 2024 inauguration of Prabowo Subianto, and the local elections in November 2024. The SIKAP project was inspired by the Nationscape study, conducted by the Democracy Fund and UCLA, similarly carried out with Lucid, and it has analogs in other initiatives such as the Russia Watcher project conducted by political scientists at Princeton University.Footnote 2 A set of core modules appeared in every one of the 58 survey waves (see Table 1). These core modules were supplemented with “Flex” modules, which appeared less frequently or only on specific weeks. The full questionnaires can be accessed in the anonymized Open Science Framework (OSF) project directory.Footnote 3
SIKAP modules

Table 1. Long description
The table is organized into two columns: No. and Module. It is divided into two primary sections: CORE and FLEX.
CORE section includes modules 1 through 18:
1. Demographic Information.
2. Political Interest and Participation.
3. Vote Preferences.
4. Support for Democracy.
5. Identity.
6. Misinformation.
7. Trust in State Institutions.
8. Trust in Civil Society Institutions.
9. Electoral Integrity and Violence.
10. Most Important Problems.
11. Religiosity.
12. Religious Intolerance.
13. Tolerant Behavior.
14. Politics and Religion.
15. Thermometer Feelings of Ethnoreligious Groups.
16. Thermometer Feelings of Partisan Groups.
17. Thermometer Feelings of Countries.
18. Gender and Redistribution.
FLEX section includes modules 19 through 27:
19. Environment.
20. Most Important Problems for Politicians.
21. Political Knowledge.
22. New Capital City.
23. Social Networks.
24. Resentment.
25. Positive Negative Affects.
26. Local Elections.
27. Party Placement.
These modules might not cover all topics relevant to the study of Indonesian politics. However, they still enable researchers to study an arguably comprehensive sample of them. For example, interested researchers can use the ethnoreligious thermometer feelings module to study polarization between ethnoreligious groups, directly examining whether outgroup animosity increases in election times as existing studies suggest (Mietzner et al. Reference Mietzner, Muhtadi and Halida2018; Mietzner and Muhtadi Reference Mietzner and Muhtadi2018). Researchers can also combine the core Most Important Problems module, in which respondents rated how important various problems are to the country, with a similar module in the flex part of the survey, in which respondents indicated how important they thought the same problems are to politicians. This analysis speaks to the issue of representation, which scholars in Indonesia have started to study quantitatively (Fossati et al. Reference Fossati, Aspinall, Muhtadi and Warburton2020). Tapping into a more contemporary issue, SIKAP also includes a module on the new capital Nusantara. We asked not only whether respondents supported its development, but also the importance of the project relative to other programs, such as social assistance and defense spending. Interested researchers can examine the ups and downs of popular support for the project and its relative importance, and correlate them with other political variables, such as feelings toward then-president Joko Widodo or then-president-elect Prabowo Subianto.
Each survey wave sampled 1,650 respondents aged 18 or older via the online panel provider Cint (formerly Lucid).Footnote 4 Due to logistical considerations, respondents were eligible to participate again after an eight-week interval.Footnote 5 In total, the final SIKAP dataset includes 95,923 responses from 84,588 unique respondents. Of these respondents, 76,258 participated in exactly one wave, 6,054 in two waves, 1,683 in three waves, 473 in four waves, 104 in five waves, and 16 in six waves.Footnote 6
This rolling cross-section design has both advantages and limitations. Drawing a new sample each week allows us to capture a wide range of demographic perspectives, while permitting repeat participation enables us to observe how individuals’ political and social attitudes may shift over time. At the same time, that we did not specifically encourage repeat participation through targeted sampling of existing respondents means that the intervals between repeat participations varied widely. For example, 120 respondents participated in Week 36 and then again in Week 45. In contrast, 136 week combinations (e.g., {1,45}, {1,51}, {9,38}) were observed for only one respondent each.
This limits how the data can be analyzed longitudinally. Researchers may not be able to simply select several survey waves covering dates of theoretical interest and conduct a longitudinal analysis (e.g., lagged regression or cross-lagged modeling), as these waves might not include a sufficient number of panel respondents spanning them. Instead, it may be necessary to combine adjacent survey waves to increase the overall panel size. Alternatively, for some research questions, it may be justifiable to focus on elapsed time rather than specific waves. Researchers might analyze all repeat participations with a given interval (e.g., a 10-week interval can be constructed by combining repeat participations in Weeks 1 and 11, Weeks 20 and 30, Weeks 31 and 41, and so on), treating the first participation as the first wave and the second as the second wave. Ultimately, like any dataset, SIKAP can be especially useful in answering certain research questions and less useful in answering others.
Sample quality
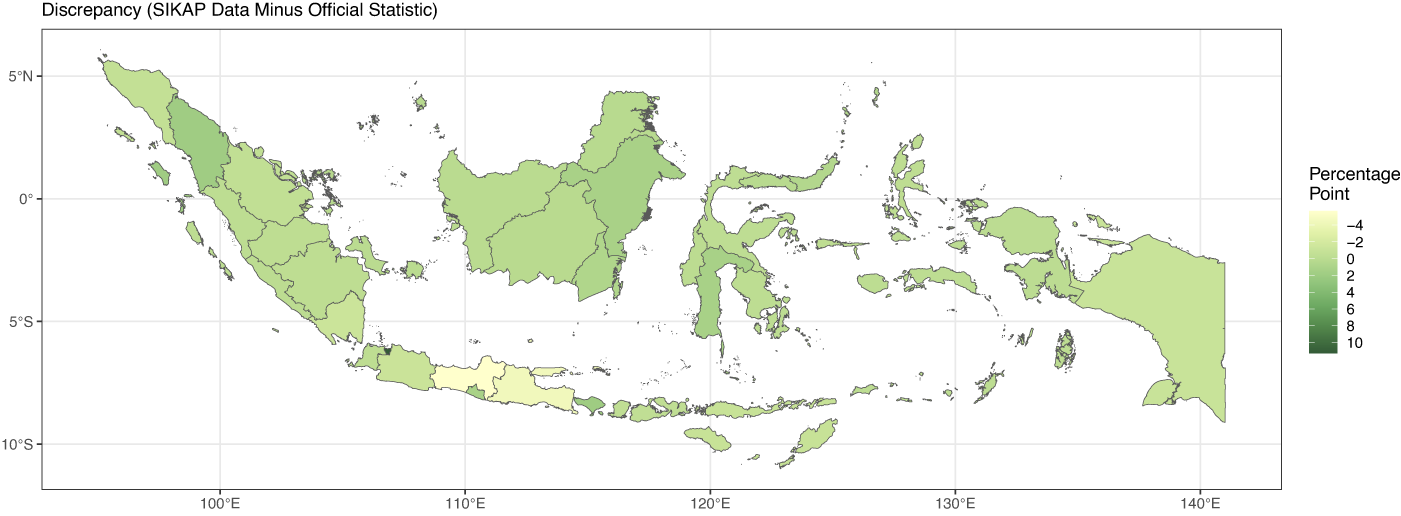
As an online survey, SIKAP also shares the challenges faced by other online data collection methods. SIKAP respondents, for example, are more educated than the general population. While these challenges mean that SIKAP is not fully representative of the Indonesian population—in part due to disparities in internet access that correlate with some of the attitudes we measured—we implemented quotas to ensure balanced representation by gender, age, and region. These quotas enhanced the overall representativeness of the data while also allowing each wave to be completed within a week. Table 2 presents a comparison of the SIKAP sample with the population on several key characteristics. We complement this with Figure 1, which compares the geographic distribution of our respondents against the distribution of the Indonesian population drawn from official statistic.
SIKAP sample characteristics
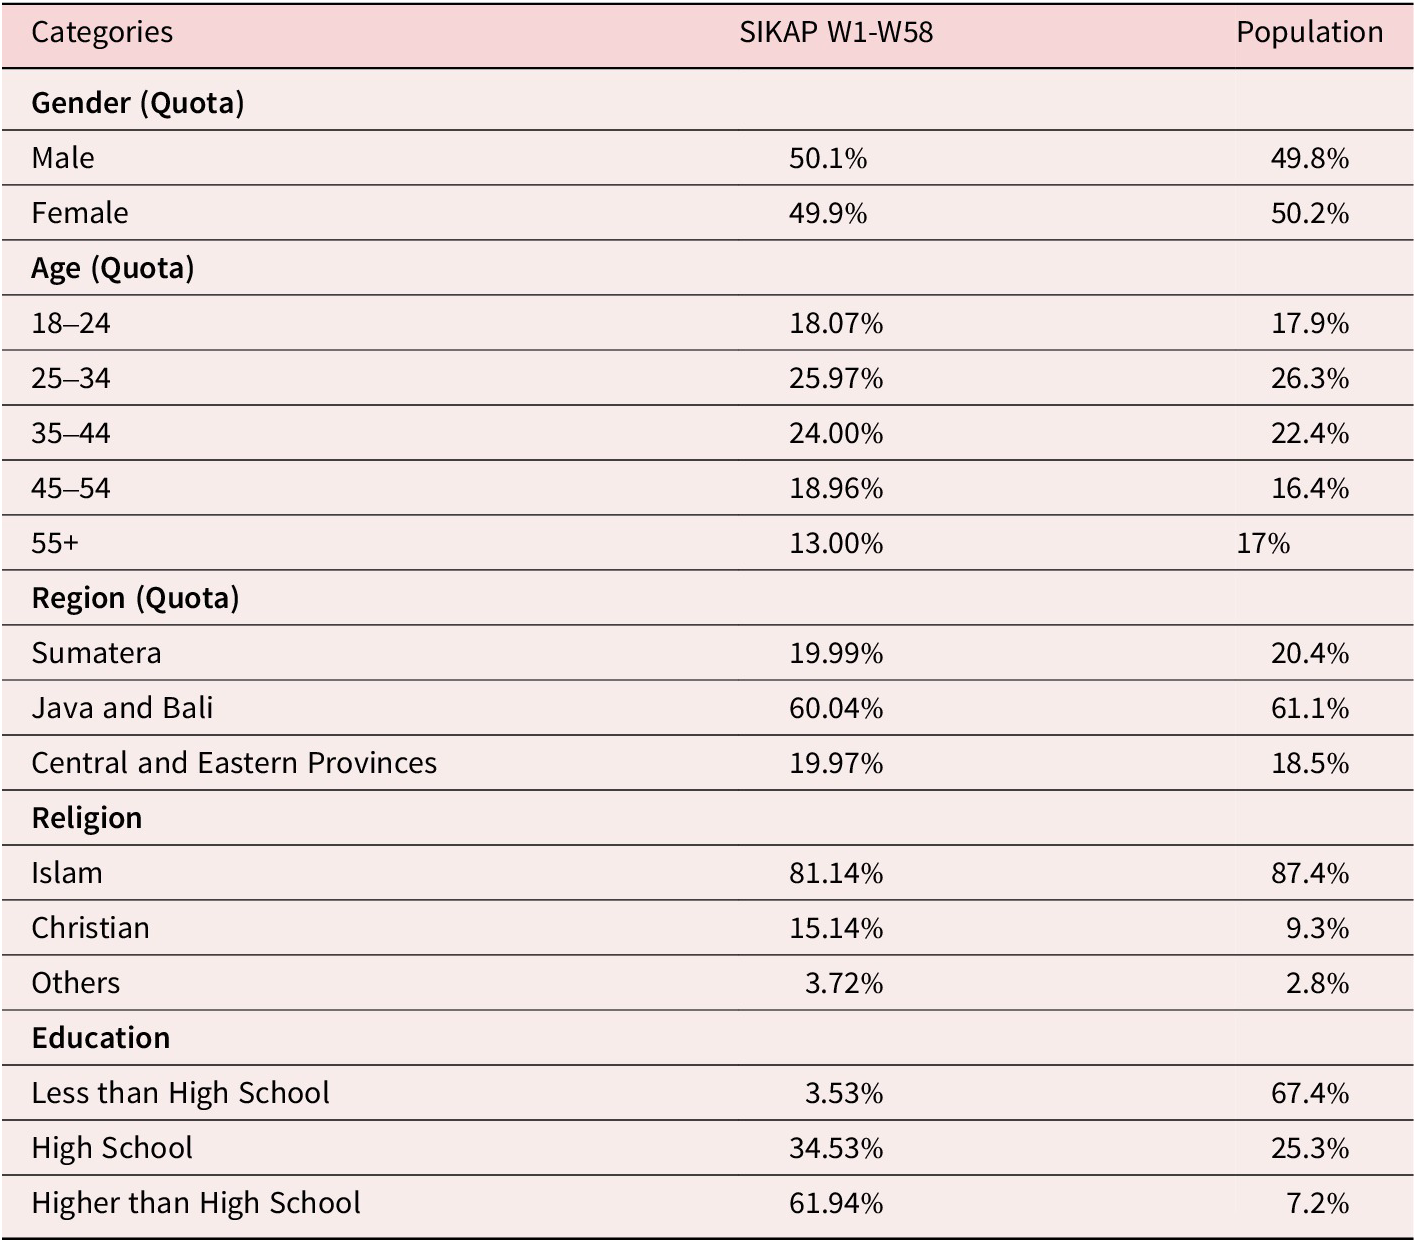
Table 2. Long description
The table contains three columns: Categories, S I K A P W 1 dash W 5 8, and Population.
Gender Quota:
- Male: 50.1 percent in sample versus 49.8 percent in population.
- Female: 49.9 percent in sample versus 50.2 percent in population.
Age Quota:
- 18 to 24: 18.07 percent in sample versus 17.9 percent in population.
- 25 to 34: 25.97 percent in sample versus 26.3 percent in population.
- 35 to 44: 24.00 percent in sample versus 22.4 percent in population.
- 45 to 54: 18.96 percent in sample versus 16.4 percent in population.
- 55 plus: 13.00 percent in sample versus 17 percent in population.
Region Quota:
- Sumatera: 19.99 percent in sample versus 20.4 percent in population.
- Java and Bali: 60.04 percent in sample versus 61.1 percent in population.
- Central and Eastern Provinces: 19.97 percent in sample versus 18.5 percent in population.
Religion:
- Islam: 81.14 percent in sample versus 87.4 percent in population.
- Christian: 15.14 percent in sample versus 9.3 percent in population.
- Others: 3.72 percent in sample versus 2.8 percent in population.
Education:
- Less than High School: 3.53 percent in sample versus 67.4 percent in population.
- High School: 34.53 percent in sample versus 25.3 percent in population.
- Higher than High School: 61.94 percent in sample versus 7.2 percent in population.
Note: Population data is based on the 2010 census for residents aged 18 or older.
Note: Population data is based on the 2010 census and calculated with residents aged 18 or older as the baseline.
Distribution of respondents relative to population, by province.

Figure 1. Long description
A geographical map of Indonesia plotted on a coordinate grid with the Y axis ranging from 5 degrees North to 10 degrees South and the X axis ranging from 100 degrees East to 140 degrees East. The title at the top reads Discrepancy open parenthesis S I K A P Data Minus Official Statistic close parenthesis. A color scale legend on the right titled Percentage Point ranges from negative 4 in pale yellow to 10 in dark green.
* In the Northwest, Sumatra and its provinces are shaded in light green, indicating a discrepancy near 0 to 2 percentage points.
* In the South, Java shows the highest variance, with Central Java and East Java shaded in pale yellow, indicating a negative discrepancy of approximately negative 2 to negative 4 percentage points.
* In the center, Kalimantan and Sulawesi are shaded in a uniform light green.
* In the East, the provinces of Papua and West Papua are shaded in a slightly lighter green than the central islands.
* Small coastal areas and minor islands are shaded in dark grey, indicating missing data or zero values. Overall, the map shows a relatively uniform distribution with the most significant deviations occurring on the island of Java.
Some discrepancies notwithstanding, the distribution of SIKAP respondents on average follows the distribution of the Indonesian population. SIKAP somewhat undersampled respondents in Central Java (-5.6 percentage point difference compared to the population count) and East Java (-4.5 point difference), and oversampled those in the capital Jakarta (+11 point difference). This reflects the nature of our geographic quotas, which imposed sample limits according to island group, meaning that “Java” was representative with respect to its share of the national population even if its constituent provinces exhibited some discrepancies. Importantly, the absolute value of respondents from East and Central Java are still high, meaning users can conduct within-provincial analyses should they be especially interested in the dynamics of those regions. And, in other provinces, the differences between SIKAP and the official count are always smaller than two percentage points.
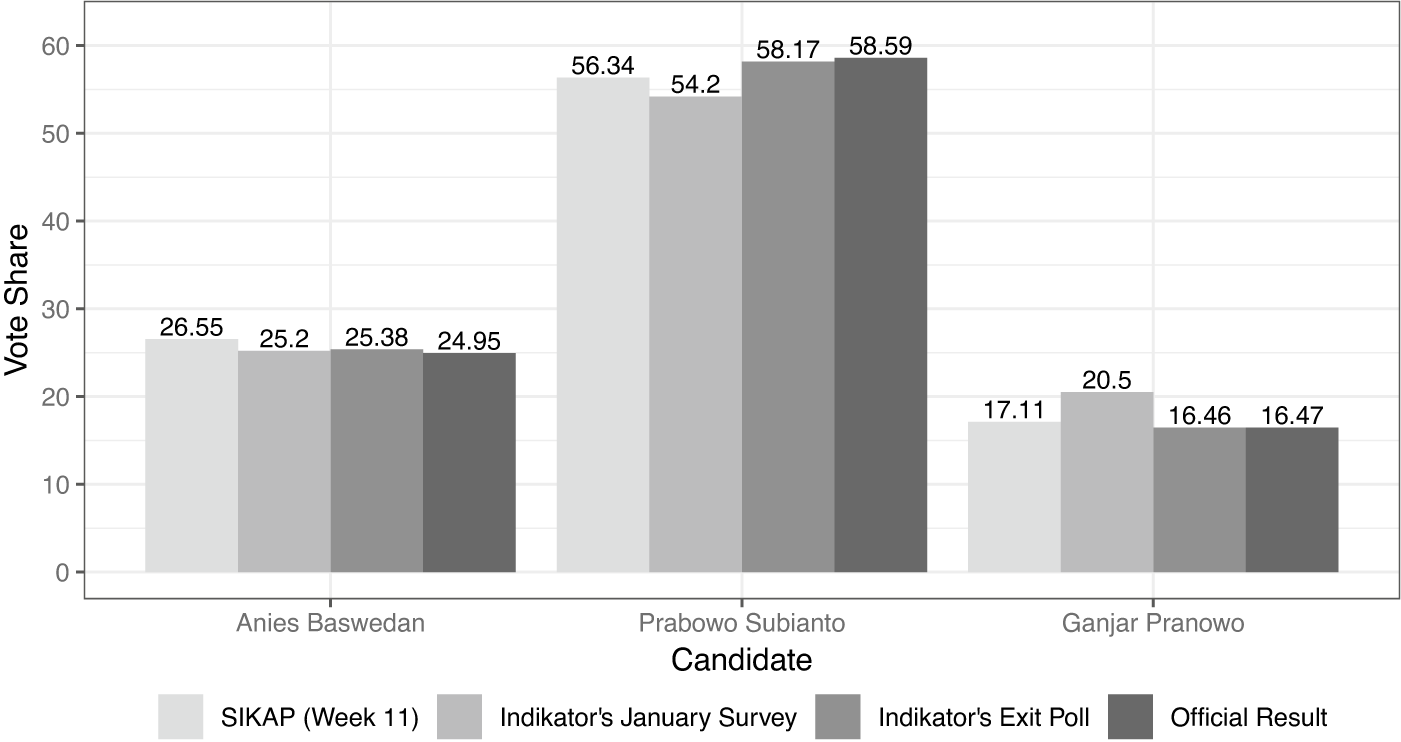
In an earlier article, we demonstrated that estimates of presidential vote shares from SIKAP’s pre-election waves closely matched that of a reputable survey agency’s exit poll conducted on the election day of 14 February 2024 (Kuipers, Toha, and Sumaktoyo Reference Kuipers, Toha and Sumaktoyo2024) see also Figure 2. Considering our hard quotas on age, gender, and region, and efforts taken by our vendor to ensure a diverse pool of respondents, we can imagine scenarios where a simple descriptive statistic based on SIKAP resembles that of the official statistic or one derived from a more representative sample. However, given inherent limitations on the representativeness of an online sample, we caution against using the data for such straightforward descriptive statistics or generalizations.
SIKAP Estimates of presidential vote share, benchmarked.

Figure 2. Long description
The Y-axis is labeled Vote Share and ranges from 0 to 60. The X-axis is labeled Candidate and features three individuals. Each candidate has four bars representing different data sources. From left to right, the sources are S I K A P Week 11, Indikator's January Survey, Indikator's Exit Poll, and the Official Result.
* Anies Baswedan: S I K A P at 26.55, Indikator January at 25.2, Indikator Exit Poll at 25.38, and Official Result at 24.95.
* Prabowo Subianto: S I K A P at 56.34, Indikator January at 54.2, Indikator Exit Poll at 58.17, and Official Result at 58.59.
* Ganjar Pranowo: S I K A P at 17.11, Indikator January at 20.5, Indikator Exit Poll at 16.46, and Official Result at 16.47.
Prabowo Subianto shows the highest vote share across all metrics, while Ganjar Pranowo shows the lowest. The S I K A P estimates closely track the official results for all candidates.
That being said, it is worth underscoring that we believe that SIKAP to be best suited for two kinds of analyses that hinge on the internal validity of the research design rather than the external validity of the data. The first is correlational or regression-based analysis where the primary objective is to establish relationships between variables. Studies show that these types of analyses tend to be less dependent on sample quality and that relational results from less representative samples often replicate in higher quality samples (Berinsky et al. Reference Berinsky, Huber and Lenz2012; Coppock et al. Reference Coppock, Leeper and Mullinix2018; Coppock Reference Coppock2019; Ellis et al. Reference Ellis, Savchenko and Messer2023).
The second type of analysis concerns analyses of trends and disruptions of trends. This type of analysis is the most obvious strength of high-frequency surveys. For example, in a recent political application of a high-frequency survey, using the US-based Nationscape survey, Reny and Newman (Reference Reny and Newman2021) examine the effects of George Floyd’s murder on racial attitudes in the United States by looking at how the trends of racial attitudes changed before and after the murder. In regard to SIKAP, researchers might focus on several core variables of interest, examining their trends over the course of 58 weeks and whether these trends are disrupted by a significant political event. In the next section, we provide two examples of such an analysis, both to demonstrate the utility of SIKAP and to answer substantive questions regarding voter behavior.
Some empirical illustrations of SIKAP’s utility
Empirical Illustration #1: Constitutional court controversy
To what extent do political controversies cost an incumbent’s public approval? Standard models of democratic accountability depict engaged and critical citizens who hold sanction politicians for deviating from their preferences. But the empirical reality often misses the mark of this ideal. For at least two reasons, negative information about a political actor may fail to influence voters’ evaluation and approval of the actor. First, studies show that voters may lack political interest and knowledge necessary to make informed political judgments (Lupia Reference Lupia2016; Converse Reference Converse and Apter1964; Carpini and Keeter Reference Carpini, Michael and Keeter1997). If the negative information or controversy itself never reaches voters as the intended audience, it is unlikely that they will use this information to make political judgments. Second, even if voters are aware of some negative information about a political actor, partisanship and confirmation bias may persuade voters to discount this information, further weakening their potentially negative effects (Campbell et al. Reference Campbell, Converse, Miller and Stokes1960).
We test these propositions using the SIKAP data by looking at President Jokowi’s popular support around a controversial series of decisions. On 20 August 2024, the Indonesian Constitutional Court (MK; Mahkamah Konstitusi) made two rulings concerning regional elections, scheduled for November 2024, that would spark a series of political maneuvers by elites and mass demonstrations in the following weeks (see Muhtadi Reference Muhtadi2024 and Wilson Reference Wilson2024 for more comprehensive overviews of the ruling and the regional elections). The first ruling specifies which parties or coalitions of parties may nominate a candidate in a regional election. The original thresholds, based on the Law No. 10/2016, specified that only parties or coalitions of parties with at least 25 percent of the popular vote in the last local election or 20 percent of the seats in the local assembly had the right to nominate candidates for regional heads. The court lowered these thresholds significantly to between 6.5 percent and 10 percent of popular votes, depending on the region’s population size. It also ruled that these lower thresholds apply as well to parties with no seats in the local assembly. The second ruling is concerned with age requirements for candidacy. The court affirms that candidates must be at least 30 years of age at the time nomination.
The first ruling opened the field for more independent candidates to participate and defied attempts by the dominant parties and elites to exclude opposition politicians from the ballots. The gubernatorial election in Jakarta was a telling example. Prior to the court’s ruling, Jakartan voters would have to choose between two candidates: Ridwan Kamil, the social media-savvy politician supported by parties of the Advanced Indonesia Coalition (KIM, Koalisi Indonesia Maju) supportive of the incumbent president Joko Widodo (Jokowi), and Dharma Pongrekun, an unknown independent candidate who was a former police general. The Indonesian Democratic Party of Struggle (PDI-P, Partai Demokrasi Indonesia Perjuangan), the holder of the second most seats in the local assembly, could not advance their own nominee and the stage was practically set for Ridwan Kamil to win comfortably. The ruling turned this scenario upside down by allowing PDI-P to nominate their own cadre Pramono Anung, who ended up winning the election in just one round.
The second ruling on the age limit explicitly ruled out the possibility of Jokowi’s youngest son, Kaesang Pangarep, running as a candidate for the vice governor position in Central Java. This avoided a repeat of the controversy during the presidential election in February 2024, when another of the court’s rulings—that time headed by Jokowi’s brother in-law—opened the way for Jokowi’s eldest son, Gibran Rakabuming Raka, to be nominated as vice president and paired with Prabowo Subianto.
These rulings were well received by the public and civil society activists. A social media analysis finds that more than 70 percent of conversations on the topic on X (formerly Twitter) were supportive of the rulings (Fahmi Reference Fahmi2024). While the decisions were welcomed by the public, the national parliament (DPR, Dewan Perwakilan Rakyat), dominated by Jokowi’s and Prabowo’s coalition, immediately tried to outmaneuver them. On August 21, less than 24 hours after the court’s ruling, DPR advanced a draft of a regional election law that would stipulate that the lowered thresholds apply only to parties that did not have seats in the local assembly—preventing established parties not part of the KIM coalition like PDI-P to nominate their own candidates—and that the age limit should refer to the age on the inauguration day, not the nomination day.
The public reacted negatively to this DPR’s maneuvering. Social media users posted pictures of a blue garuda (Indonesia’s national emblem) with text overlaid saying “Emergency Warning” (Peringatan Darurat). Students and civil society activists organized demonstrations in big cities across Indonesia. In Jakarta, protesters surrounded the parliament building and clashed with the police, preventing the parliament from achieving a quorum for passing the law (Ningtyas and Jalli Reference Ningtyas and Jalli2024). Of particular relevance to our purpose of analyzing the effect of public backlash on an incumbent’s popularity, these protests mostly targeted and criticized Jokowi as the president. His coalition dominated the parliament and the efforts to skirt the court’s ruling on the age limit were widely seen as his attempting to build a political dynasty by giving his sons influential positions.
To test the impact of these events, we leverage two SIKAP questions that directly measured respondents’ evaluations of Jokowi. The first question, fielded from February 26 to October 27, 2024, asked respondents the extent to which they were satisfied with Jokowi’s performance as president. We list the questions (and all others) in the OSF directory from which readers and potential users can download the data and related documentation.Footnote 7 Responses were recorded on a 4-point scale ranging from very dissatisfied to very satisfied. The second question tapped into favorability. It asked respondents about their feeling to Jokowi and recorded the responses on a 5-point scale from a strong dislike to a strong liking. This question was fielded from June 27, 2024 to the last day of SIKAP on January 5, 2025. One advantage of this question is that it also asked about respondents’ feeling toward President-elect Prabowo Subianto. This allowed us to examine whether the seeming public resentment against Jokowi following the MK’s ruling controversies spilled over to his preferred presidential candidate and the eventual winner.
Our analytical approach is straightforward. We dichotomized the two questions. Respondents received a score of 1 for the satisfaction variable if they were satisfied or very satisfied with Jokowi’s performance and 0 if they were dissatisfied or very dissatisfied. They received a score of 1 for the favorability variable if they expressed a positive or very positive feeling toward Jokowi and 0 if the feeling was negative. We then ran linear probability models that regressed the dependent variables on survey week dummy variables, controlling for gender, age group, education level, religion, region, and ethnicity.
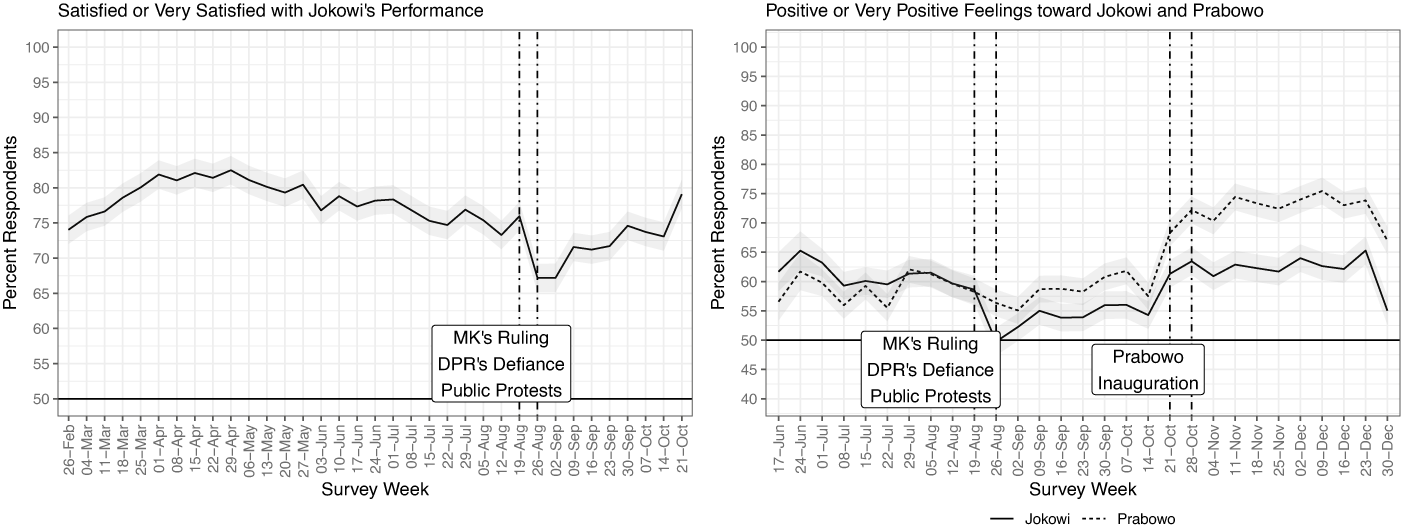
Figure 3 presents the percentages of respondents who were satisfied or very satisfied with Jokowi’s performance as president (left panel) or expressed a positive or very positive feeling toward Jokowi, derived from the regression models with the shaded areas representing 95 percent confidence intervals. Both figures show an obvious decline in Jokowi’s public approval and favorability during the week of the MK’s ruling controversies. This indicates that voters, at least some of them, do pay attention to political developments and hold their leader accountable for unacceptable political maneuvering by withdrawing their support. The favorability rating of Prabowo, on the other hand, was unaffected by the controversies. This suggests that voters did not associate Prabowo with the controversies and validated his team’s strategy to have surrogates share with the public the fact that Prabowo was very angry with the DPR’s maneuvering, even though his party was part of Jokowi’s coalition.
Approval and favorability ratings of Jokowi.

Figure 3. Long description
A two-panel figure. Both panels use a Y-axis labeled Percent Respondents ranging from 40 to 100 and an X-axis labeled Survey Week.
Left Panel: Satisfied or Very Satisfied with Jokowi's Performance. The data line begins at 74 percent in late February, peaks at 82 percent in mid-April, and gradually declines to 73 percent by mid-August. Two vertical dashed lines mark the period of August 19 to August 26, labeled M K's Ruling, D P R's Defiance, and Public Protests. During this window, satisfaction drops sharply to 67 percent before recovering to 79 percent by late October.
Right Panel: Positive or Very Positive Feelings toward Jokowi and Prabowo. A solid line represents Jokowi and a dotted line represents Prabowo. Jokowi's favorability fluctuates between 55 and 65 percent. Prabowo's favorability starts near 57 percent, stays below Jokowi's until late August, then rises significantly after the first protest window. A second set of vertical dashed lines marks October 21 to October 28, labeled Prabowo Inauguration. Following the inauguration, Prabowo's favorability peaks at 75 percent while Jokowi's remains steady around 63 percent before a final dip to 55 percent in late December.
At the same time, the figures show that the declines were relatively modest at about 10 percent. They were also short-lived. The approval and favorability ratings practically returned to their original levels after seven weeks, which coincided with the inauguration of Prabowo Subianto as president. We may attribute this return-to-normal to voters’ inability to sustain political attention in the face of complex and constant flow of political information. However, we believe that voters are just one part of the equation. Another part is the lack of credible opposition in Indonesia’s political system. No opposition means no parties dedicated to sustain the public dissatisfaction alive and used it to hold the government accountable.
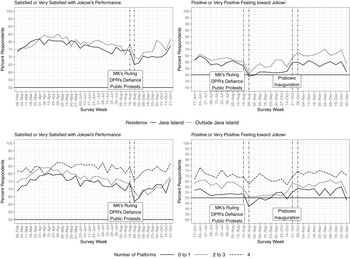
Lastly, in Figure 4 we show that the general patterns are also evident regardless of whether the respondents resided on the Island of Java or the number of social media platforms (Instagram, Facebook, Twitter, or TikTok) that they frequented daily. Those who indicated that they obtained information from all four platforms on daily basis were most positive of Jokowi. But even among them we still observe a modest decline in their evaluations of Jokowi that coincided with the MK controversies. This suggests that the declines we observed in Figure 4 might be an across-the-board phenomenon, not limited to specific voter groups.
Approval and favorability ratings by residence and social media consumption.

Figure 4. Long description
A four-panel line graph display. All panels share a Y-axis of Percent Respondents ranging from 30 to 100 and an X-axis of Survey Week.
Top Row: Residence comparison. Solid line represents Java Island and dotted line represents Outside Java Island.
- Left panel: Satisfied or Very Satisfied with Jokowi's Performance. Both regions show a decline from approximately 80 percent in April to a sharp dip in late August around the M K's Ruling, D P R's Defiance, and Public Protests.
- Right panel: Positive or Very Positive Feeling toward Jokowi. Ratings fluctuate between 50 and 70 percent, with a notable drop in late August followed by a slight recovery around the Prabowo Inauguration in October.
Bottom Row: Social media consumption comparison. Solid line is 0 to 1 platforms, dotted line is 2 to 3 platforms, and dashed line is 4 platforms.
- Left panel: Satisfied or Very Satisfied with Jokowi's Performance. Users of 4 platforms consistently report higher satisfaction (80 to 85 percent) compared to those using 0 to 1 platforms (70 to 75 percent). All groups show a sharp synchronized drop during the late August protests.
- Right panel: Positive or Very Positive Feeling toward Jokowi. There is a clear hierarchy where higher social media usage correlates with higher favorability. The 4-platform group stays above 65 percent, while the 0 to 1 platform group dips below 45 percent in late August before recovering toward 60 percent.
Empirical Illustration #2: Losers’ Consent and Support for Democracy
As a second empirical illustration we examine support for democracy over time. A robust literature in political science has examined the extent to which support for democracy changes in the build-up to and aftermath of an election. One of the dominant findings to emerge from this literature is the idea that voters whose preferred candidate loses the election are more likely to turn against the value of democracy (Anderson Reference Anderson2005; Nadeau and Blais Reference Nadeau and Blais1993). This finding draws theoretical support from an even deeper expectation in political science around the concepts of frustrated expectations, thwarted ambition, and zero-sum thinking. When voters freight the stakes of election outcomes with heightened significance, the consequences of their chosen candidate losing can be psychologically damaging, causing them to turn against the value of the system itself (Tilley and Hobolt Reference Tilley and Hobolt2024).
There is little in the way of empirical evidence on whether or not this phenomenon prevails in Indonesia. In a new paper, Kuipers (Reference KuipersForthcoming) studies how candidates for Indonesian DPRD-II offices respond to electoral defeat, tracking their support for democracy before and after the election, finding no differential decline. But different dynamics may obtain at the level of mass politics. In 2019, after all, large numbers of Prabowo Subianto’s supporters marched on the Indonesian electoral commission (KPU) to prevent the certification of his loss, in a series of protests that resulted in at least six deaths (Gunia Reference Gunia2019). There were no such events in the wake of Anies Baswedan and Ganjar Pranowo’s electoral defeat at the ballot box on February 14, 2024. But it may be that their supporters nonetheless quietly withdrew support from democracy, in line with the theoretical predictions of the literature on losers’ consent.
To test this possibility, we focus on one item from the SIKAP core module that asked respondents the extent to which democracy was “suitable” for Indonesia. As before, we dichotomize the variable such that any positive statement of democracy being suitable in Indonesia takes a “1” and all other responses are coded as a “0.” Again, we use linear probability models that regressed the dependent variables on survey week dummy variables, controlling for gender, age group, education level, religion, region, and ethnicity. We plot the predicted values and the associated 95% confidence intervals.
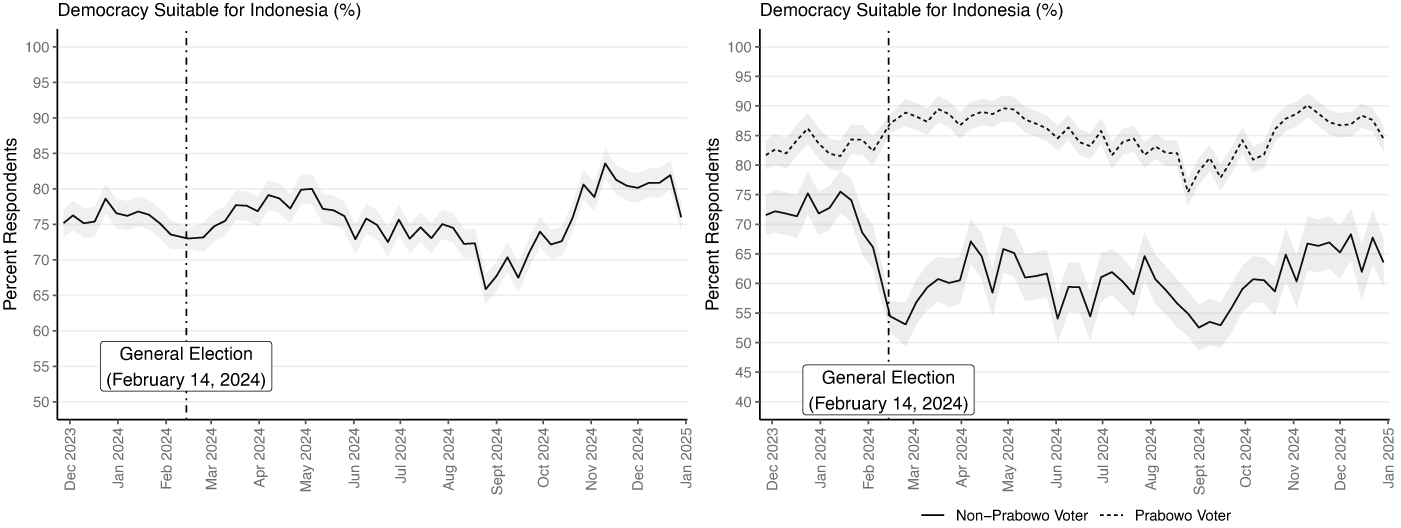
We present our results in Figure 5. The left-hand panel presents the pooled trend in support for democracy, between December 2023 and January 2025. Three things stand out and are worth highlighting. First, on balance, support for democracy is both high and robust over time; at no time does it dip below 65 percent of respondents saying democracy is suitable for Indonesia, and it is usually around 75 percent. Second, on average, there was relatively little movement around the election in support for democracy. Third, there was a dip in support for democracy in August 2024, which coincided with the public’s reaction to the constitutional court rulings and DPR countermoves, described above. There was a steady increase in the aftermath, in which democratic suitability reached 85 percent in early November 2024, likely a bump owing to the inauguration of Prabowo Subianto in October 2024 and the dividends from a peaceful transfer of power.
Democracy suitability for Indonesia, by presidential candidate support.

Figure 5. Long description
The figure consists of two panels. Both panels share a Y axis labeled Percent Respondents ranging from 40 to 100 and an X axis showing a timeline from December 2023 to January 2025. A vertical dashed line marks the General Election on February 14, 2024.
Left Panel. A single solid black line with a gray confidence interval represents the total population. The line fluctuates between 73 and 80 percent until August 2024, where it drops to a low of approximately 66 percent in September before rising to a peak of 83 percent in November 2024 and ending near 76 percent.
Right Panel. Two lines compare different voter groups.
- The Prabowo Voter group is represented by a dashed line. It starts at 82 percent, rises after the election to nearly 90 percent, and remains high between 80 and 90 percent throughout the period.
- The Non-Prabowo Voter group is represented by a solid line. It starts at 72 percent but drops sharply following the General Election to a low of 53 percent in March 2024. It fluctuates significantly between 53 and 68 percent for the remainder of the year, consistently staying 20 to 30 percentage points lower than the Prabowo supporters.
The test of the losers’ consent hypothesis is presented in the right-hand panel of Figure 5, in which we break out perceptions of democratic suitability by whether the respondent supported Prabowo Subianto or a different candidate in the general election. Until February 2024, both groups of voters reported parallel trends in support for democracy. The dotted line represents perceptions of democratic suitability among Prabowo Subianto voters, which shows a continuing trend after the election on February 14, 2024. The solid black line shows perceptions of democratic suitability for non-Prabowo voters, which drops by approximately 20 percentage points (from 75 percent to 55 percent) around the general election. This figure recovers over the ensuing twelve months, but remains persistently lower than prior to the election by a margin of 10 percentage points. On balance, the results underscore the inherent challenges associated with managing losers’ grievances in a patronage democracy.
Discussion, limitations, and conclusion
In this note, with an eye toward encouraging more data sharing and data-driven social science research on Indonesia, we introduce the Surveys on Indonesians’ Knowledge of and Attitudes on Politics (SIKAP). The surveys, fielded weekly over 58 weeks and covered the 2024 presidential elections and other significant political events, offer students of Indonesia an opportunity to answer various research questions. Researchers may use SIKAP data as cross-sectional data similar to other publicly available data such as the Asian Barometer or the World Values Survey. Researchers may also leverage the longitudinal and high-frequency features of SIKAP, examining how political attitudes of repeat participants evolve over time or how a significant political event disrupts the trend of public opinion on an issue.
We demonstrated the utility of SIKAP’s high-frequency design by focusing on two use cases. First, we demonstrate how SIKAP captured a decline in voters’ favorability toward Jokowi as a result of his legislative coalition’s defiance against the Constitutional Court’s rulings. Contradicting the pessimistic notion that voters’ judgments are impaired by political inattentiveness and confirmation bias, this finding shows that voters are receptive and responsive to negative information about a political leader, even an extremely popular one. At the same time, the decline was relatively transient. Second, we look at how support for democracy changes over time, finding a significant decline among voters who supported candidates other than Prabowo Subianto at the ballot box. Worryingly, the results indicate that, among this subgroup, support for democracy had not recovered to pre-election levels even one year later.
It is worth underscoring some of the limitations associated with our approach. As we discussed above, our surveys over-samples high-SES individuals, especially those with higher levels of education. This enables researchers to use our data to answer certain research questions that pertain to the behavior of highly sophisticated voters. For instance, researchers may wish to conduct analyses of this subgroup’s media consumption patterns. Or researchers may want to probe forms of participation beyond voting among high-SES respondents (e.g., contacting officials, petition-signing, volunteering). Our data, meanwhile, are poorly suited for generalizing to Indonesians with limited schooling: a large share of the population (approximately 40 percent) has not completed primary school and is virtually absent from our sample. But their exposure to print and social media, and their modes of participation, differ markedly from their higher-SES peers. We urge researchers who use the SIKAP data to reflect on the limitations of the inferences they can draw based on the characteristics of the sample as they carry out their analyses.
We conclude by calling for a greater commitment to open data sharing practices on the part of scholars studying Indonesia. In this spirit, we hope to replicate SIKAP in future election cycles. Our data collection strategy was cost-effective (cost per respondent approx. US$3.) meaning efforts to replicate the SIKAP initiative in future election cycles ought to be feasible. More broadly, collaborative data collection efforts such as this one—from which a broader community of researchers may benefit—ought to become more commonplace. At the very least, harmonization and standardization of survey items across disparate data collection efforts would ensure comparability across research endeavors and over time.
Acknowledgements
This research was supported by grants from the Singaporean Ministry of Education (MOE-T2EP40123–0001) and the National University of Singapore (22–4852-P0001). The data collection protocols were approved by the National University of Singapore Institutional Review Board (NUS-IRB-2023–798). We thank Abdul Aziz, Putri Hening Graha, and Phoebe Virginia for excellent research assistance. For implementation assistance, we thank the staff at Cint, especially Aswin KB and Ishu Bhardwaj. The authors contributed equally to this manuscript and the overall project management. SIKAP dataset and associated questionnaires can be accessed through the following link: https://osf.io/6e9sm/.
Competing interests
The authors declare none.

 Open access

