



In humans and animals, the appearance kinetics of nutrients in portal blood depends on the kinetics of nutrient passage, hydrolysis and absorption in the gastrointestinal tract (GIT). It has been shown that asynchronous appearance of metabolic complementary nutrients may affect the nutrient’s metabolic fate. For example, pigs fed with a free lysine diet v. a protein-bound lysine dietReference Batterham and Bayley (1) , or pigs asynchronously fed amino acids and glucose within a dayReference van den Borne, Schrama and Heetkamp (2) showed an increased loss of amino acids as a result of oxidation. As the small intestine is the main site of nutrient absorption, the kinetics of nutrient passage before this site can influence the kinetics of portal blood appearance. Hence, the kinetics of nutrient passage through the stomach and small intestine is important to consider when one is interested in the metabolic fate of ingested nutrients.
The passage of nutrients through the stomach is a heterogeneous processReference Minami and McCallum (3) . Due to the morphology and motility of the stomach, solids pass slower than liquidsReference Collins, Houghton and Read (4 , Reference Holt, Reid and Taylor 5) . After ingestion, solids are first retained in the proximal stomach, whereas liquids rapidly distribute throughout, and empty from the stomachReference Collins, Houghton and Read (4) . The passage of liquids from the stomach is driven by (fundic) pressure and is related to stomach volumeReference Kwiatek, Menne and Steingoetter (6 , Reference Strunz and Grossman 7) . Solids, however, first pass from the proximal to distal stomach, where they can be reduced in size before they are emptied into the small intestineReference Meyer, Ohashi and Jehn (8 , Reference Marciani, Gowland and Fillery-Travis 9) . Moreover, several feedback mechanisms along the GIT are known to control the gastrointestinal motility and inhibit digesta passage from the stomach and/or in the intestines. These feedback mechanisms can be triggered by receptors along the GIT by the presence of protein, carbohydrates and fat degradation productsReference Gregory, McFadyen and Rayner (10 , Reference van Citters and Lin 11) . Increasing the nutrient load of a meal, for example, resulted in a decreased stomach emptying rate of solids and liquids in both human and pigsReference Collins, Houghton and Read (4 , Reference Gregory, McFadyen and Rayner 12 , Reference Houghton, Read and Heddle 13) . Hence, the rate of passage of solids and liquids through the stomach is a net result of multiple factors that stimulate or inhibit the passage process.
The difference in passage rate of digesta phases (i.e. solids v. liquids) and the influence of nutrient load on passage kinetics indicate that dietary nutrient solubility can influence the passage rate of digesta from the stomach. An increase in dietary nutrient solubility causes nutrients to shift from the solid to the liquid digesta fraction. Nutrients in the latter fraction enter the small intestine quickly after ingestion, thereby potentially triggering nutrient feedback mechanisms that affect digesta passage kinetics in the proximal GIT. Moreover, relevant variation in nutrient solubility between feed ingredients exists. Protein solubility, for example, varies between 0 % in faba beans and 61 % in maize gluten meal at stomach pHReference Cone (14) and close to 90 % in whey protein isolates at pH 4·6Reference de Wit (15) . While previous studies observed an effect on stomach emptying rate by increasing the nutrient load of the liquid fraction of the dietReference Collins, Houghton and Read (4 , Reference Houghton, Read and Heddle 13) , the effect was confounded with the effect of increasing total nutrient intakeReference Gregory, McFadyen and Rayner (12) . Although in humans and pigs the passage rate of solids and liquids in the stomach has been studiedReference Collins, Houghton and Read (4 , Reference Gregory, McFadyen and Rayner 12 , Reference Houghton, Read and Heddle 13 , Reference Camilleri, Malagelada and Brown 16 , Reference Wilfart, Montagne and Simmins 17) , only limited studies have quantified the passage rate of digesta solids and liquids in other segments of the GITReference Wilfart, Montagne and Simmins (17) . Therefore, this study aimed to evaluate the effects of (1) dietary nutrient solubility (S) and (2) feed intake level (F), on the passage behaviour of solids and liquids in multiple GIT segments of growing pigs. It was hypothesised that an increase in S or F would result in an increase in mean retention time (MRT) of solids and liquids in the proximal GIT.
Methods
The study was approved by the Dutch Animal Ethics Committee (2014.III.06.056) and carried out at the Swine Research Centre of Nutreco N.V. (Sint Anthonis, the Netherlands). This includes daily welfare assessments as required and guided by European legislation (European Commission: Directive 2010/63/EU). The study objective considers the pig as the main research subject.
Animals and housing
A total of forty male growing pigs (Hypor×Maxter; Hendrix Genetics) with an average initial body weight (BW) of 32·0 (sd 1·4) kg were used. The experiment was performed in two sequential batches of twenty pigs each. Pigs were individually housed in pens (2·48×0·94 m) equipped with partial slatted floors and half-open walls between pens to allow visual and physical contact of adjacently housed pigs. Temperature was controlled at 23±1°C and the facility was lit from 06.00 to 18.00 hours.
Diets and feeding
In a randomised complete block design, the pigs were assigned to one of four treatments differing in S and F. Dietary treatments were a low, medium and high S diet at high F (HF-LS, HF-MS and HF-HS, respectively), and a low S diet at low F (LF-LS). Low and high F represent feed intake levels of, respectively, 1·9 and 2·8×metabolisable energy requirement for maintenance (MEm: 419 kJ ME/kg BW0·75)
(18)
. Low, medium and high S diets consisted of 8, 19 and 31 % of soluble protein and glucose equivalents $\left( {{{{(\rm starch/0\cdot 9)}}}{\plus} {\rm reducing}\hbox { }{\rm sugars}} \right)$
, respectively. Whereby dietary nutrient solubility was considered as the proportion of nutrients that are soluble when brought in a buffer solution (pH 3–3·5, stomach pH in pigs)Reference Cone
(14
,
Reference de Wit
15
,
Reference Wilfart, Jaguelin-Peyraud and Simmins
19
–
Reference Anguita, Gasa and Martín-Orúe
21)
.
$\left( {{{{(\rm starch/0\cdot 9)}}}{\plus} {\rm reducing}\hbox { }{\rm sugars}} \right)$
, respectively. Whereby dietary nutrient solubility was considered as the proportion of nutrients that are soluble when brought in a buffer solution (pH 3–3·5, stomach pH in pigs)Reference Cone
(14
,
Reference de Wit
15
,
Reference Wilfart, Jaguelin-Peyraud and Simmins
19
–
Reference Anguita, Gasa and Martín-Orúe
21)
.
The experimental diets were composed of two basal diets (Table 1): a basal low-soluble diet and a basal high-soluble diet, these diets were formulated using ingredients covering a low or high range of nutrient solubility, respectively. The basal diets were designed to be equal in crude protein (CP), glucose-equivalents and crude fat content. These basal diets were produced as mash and were mixed in different ratios to obtain the four experimental diets (Table 2). Soyabean meal, maize and wheat were hammer milled to pass a 4-mm sieve, and sugar beet pulp and rapeseed meal to pass a 2·75-mm sieve.
Ingredient composition of the basal low-soluble, and high-soluble diets used to compose the experimental diets
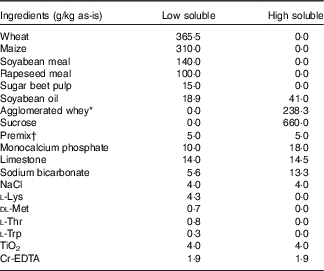
* Volactive UltraWhey 90 instant=agglomerated, instantised whey protein isolate 90 % (Volac International Ltd).
† Composition of premix, per kg diet: 2·4 mg vitamin A, 40 µg vitamin D3, 30 mg vitamin E, 1·5 mg vitamin K3, 1·0 mg vitamin B1, 4·0 mg vitamin B2, 1·5 mg vitamin B6, 20 µg vitamin B12, 20 mg niacin, 12 mg d-pantothenic acid, 150 mg choline chloride, 0·2 mg folic acid, 100 mg Fe (as FeSO4.H2O), 20 mg Cu (as CuSO4.5H2O), 30 mg Mn (as MnO), 70 mg Zn (as ZnSO4.H2O), 0·68 mg iodine (as KI) and 0·20 mg Se (as Na2SeO3). Carrier: maize meal.
Experimental design: intake of basal diets and resulting intake of nutrients of pigs fed diets with a low nutrient solubility (LS), medium nutrient solubility (MS), or high nutrient solubility (HS), and low feed intake (LF) or high feed intake (HF)Footnote *

BW, body weight; ME, metabolisable energy.
* Feed intake level at 1·9 (LF) or 2·8 (HF)×ME requirement for maintenance (419 kJ ME/kg BW0·75) (18) .
† Unless stated otherwise.
‡ Protein solubility in phosphate buffer AReference Boisen and Fernández (24) , 0·1 m at pH 3·5 and 39°C.
§ Glucose equivalents: (starch/0·9)+reducing sugars.
|| NSP as calculated (25) from diet composition: organic matter – crude protein – crude fat – starch – gluco-oligosaccharides – 0·9×sugar. Insoluble NSP calculated based on water-insoluble cell wall content from calculated diet composition (26) .
¶ MEReference Noblet, Fortune and Shi (27) (MJ)=(20·0×digestible crude protein+39·1×digestible diethyl ether extract+17·5×starch+16·6×sugars+17·2×digestible NSP)/1000.
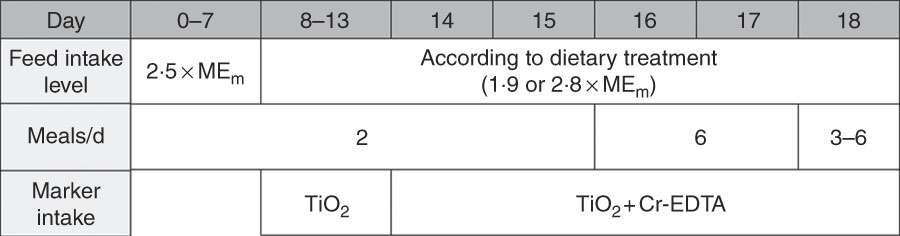
All pigs were gradually switched from a commercial diet to the experimental diets in 3 d before the experiment. The experiment lasted for 18 d (Fig. 1). Pigs were fed the experimental diets at a feeding level of 2·5 MEm until day 7, followed by the feeding level of the respective treatments until the end of the trial. The pigs were fed twice daily at 08.00 and 16.00 hours until day 15, followed by frequent feeding to induce steady state passage of digesta in the GIT. During the frequent feeding period, the daily feed allowance was divided in six equal portions. On days 16 and 17, the pigs received portions once every 3 h from 05.30 until 20.30 hours. On day 18, the pigs received portions once every 2 h from 02.30 hours until 2 h before euthanasia, with a minimum of three portions fed on this day. Feeding time on this day (day 18) was scheduled according to the scheduled time of euthanasia of each pig, starting at 08.30 hours with the first pig. The diets contained TiO2 as the indigestible insoluble markerReference Jagger, Wiseman and Cole (22) from day 8 onwards, and Cr-EDTA as the indigestible soluble markerReference Udén, Colucci and Van Soest (23) from day 16 onwards. Diets were fed as mash and mixed with water (1:2·5, w/w) in the feed trough. In addition, the pigs received 0·5 litre of water/d, 0·25 litre in the morning and 0·25 litre in the afternoon. During the frequent feeding period, the pigs did not receive additional water. Twice weekly the pigs were weighed to adjust the amount of feed allowed based on the pigs’ BW.
Timeline of the study. MEm, metabolisable energy requirement for maintenance.
Sample collection and chemical analysis
At day 18, the pigs (45·2 (sd 3·2) kg BW) were euthanised for quantitative digesta collection from various segments of the GIT. Pigs were euthanised sequentially by sedating i.m. with Zoletil® 100 (0·06 ml/kg BW), followed by injecting Euthasol® (20 %; 24 mg/kg BW) in the ear vein and exsanguinating via the carotid artery. The sequence of sacrificing pigs was balanced for treatment by block. Each block consisted of four adjacently housed pigs, each pig receiving a different dietary treatment. Immediately after exsanguination, the abdominal cavity was opened and the GIT was divided into segments by placing tie wraps at the beginning and end of the stomach, small intestine, caecum and colon+rectum (further mentioned as colon), and halfway the small intestine and colon. Digesta from the stomach, proximal and distal half of the small intestine, caecum and proximal and distal half of the colon were collected by gentle stripping. After digesta collection, homogenous digesta subsamples were taken and stored at 4°C, pending measurements of viscosity and water-binding capacity (WBC). The remaining digesta was stored at –80°C pending freeze-drying. After freeze-drying, the samples were centrifugal milled to pass a 1-mm sieve (Retsch ZM 200). The process from euthanasia until sample storage lasted 15 min/pig.
Diets and digesta were analysed for contents of DM (28) , CP (N (29) ×6·25), starch (30) , reducing sugarsReference van Vuuren, van der Koelen and Valk (31) , TiReference Myers, Ludden and Nayigihugu (32) and Cr (measured at 357·9 nmReference van Bussel, Kerkhof and van Kessel (33) after sample preparation according to Williams et al. Reference Williams, David and Iismaa (34) ). Single analyses were carried out. In addition, 10 % randomly chosen samples were analysed in duplicate to evaluate the precision of the analyses. Precision and thereby results from analyses were considered valid in case over 90 % of observed duplicate differences were below the set maximum allowable differences for the respective nutrients. In absolute terms, maximum differences were set for DM (2 g/kg) and for starch (2 g/kg, if starch concentration >100 g/kg; or 1 g/kg if starch concentration <100 g/kg). In relative terms, maximum differences were set for N (5 %), Ti (5 %) and Cr (10 %). Samples were reanalysed when values were outside the range of the mean value±2×SD within treatment and GIT segment.
WBC of digesta was measured using centrifugational force. Fresh digesta samples were centrifuged at 4000 g for 10 min at 21°C after which the supernatant was decanted. The WBC, in g/g digesta DM, was calculated as the weighed amount of water retained after decanting. This analysis was performed in duplicate if the quantity of available sample allowed. In total, twenty-five samples were analysed single, 120 in duplicate and for ninety-five samples insufficient materials were available.
Dynamic viscosity of digesta was measured within 96 h after digesta collection by an MCR502 and MCR301 rheometre (Modular Compact Rheometer; Anton Paar GmbH). Measurements were carried out at 39°C with declining shear rates from 50/s to 1/s in twenty-five steps. Different geometries were used for digesta from the proximal and distal GIT segments due to the differences in digesta consistencies within these segments. Stomach and small intestinal samples were measured in a Ti concentric cylinder (i.e. cup) system (CC17-SN2540; Anton Paar GmbH). Caecum and colon digesta samples were measured on a Ti parallel profiled plate–plate measuring system (PP25/P2-SN25463, PP25/P2-SN25491; Anton Paar GmbH) with a 1·5 mm gap width.
Calculations and statistics
Calculations and statistics were performed in Statistical Analysis Systems statistical software package version 9.3 (SAS Institute Inc.). The MRT of digesta in each GIT segment was calculated (Eq. (1)) based on the assumption that in a steady state, pool sizes of digestible marker in each segment reflects the MRT of digesta in that segment (discussed by de Vries & GerritsReference de Vries and Gerrits (35) ).
 $${\rm MRT\ (h)}{\equals}{{{\rm Marker}\hbox\; {\rm pool} \hbox \; {\rm size}\hbox\; {\rm in}\hbox\; {\rm digesta\ (g)}} \over {{\rm Marker}\hbox\; {\rm intake}\left( {{g \over h}} \right)}}$$
where the marker is either Ti (as TiO2) or Cr (as Cr-EDTA). Marker pool sizes in digesta of each GIT segment were calculated by multiplying the digesta marker concentration (g/kg DM) by the weight of digesta in the corresponding segment (g DM). Marker intake was calculated by multiplying the marker concentration of the diet (g/kg DM) by the meal intake at day 18 (kg DM/h).
The apparent digestibility of starch and protein in the proximal segments (i.e. stomach, proximal and distal half of the small intestine) of the GIT was calculated (Eq. (2)) according to Kotb & LuckeyReference Kotb and Luckey (36) :
 $${\rm Nutrient}\,{\rm digestibility}\,({\rm \%)}{\equals}\left( {1{\minus}{{\left( {{{[{\rm Nutrient}]_{{{\rm digesta}}} } \over {[{\rm Marker}]_{{{\rm digesta}}} }}} \right)} \over {\left( {{{[{\rm Nutrient}]_{{{\rm diet}}} } \over {[{\rm Marker}]_{{{\rm diet}}} }}} \right)}}} \right){\times}100$$
where [Nutrient]digesta, [Nutrient]diet, [Marker]digesta, [Marker]diet are concentrations (g/kg DM) of nutrient (CP or starch) and marker (Ti or Cr) in the digesta or diet samples.
Dynamic digesta viscosity is described to have non-Newtonian shear-tinning flow behaviourReference Dikeman, Barry and Murphy (37) . Therefore, the non-Newtonian flow behaviour was fitted using a power-law modelReference Shelat, Nicholson and Flanagan (38) (Eq. (3)):
 $$\eta {\equals}K\dot{\gamma }^{{n{\minus}1}} $$
where η=viscosity (Pa×s), K = consistency constant,
 $$\dot{\gamma }$$
=shear rate (per s) and n=power-law index. The power-law model parameters (K,n) were estimated per pig per GIT segment using non-linear least squares regression (PROC NLIN). The viscosity in the Newtonian region at 45/s was calculated from the power-law model and reported.
$$\dot{\gamma }$$
=shear rate (per s) and n=power-law index. The power-law model parameters (K,n) were estimated per pig per GIT segment using non-linear least squares regression (PROC NLIN). The viscosity in the Newtonian region at 45/s was calculated from the power-law model and reported.
The effects of the dietary treatments on digesta MRT, nutrient digestibility and viscosity parameters were analysed per GIT segment using a general linear model (PROC GLM). Dietary treatment, batch, treatment×batch and block were considered as fixed effects, and the pig as experimental unit. Studentised residuals were tested for normality using the Shapiro–Wilk test. Data distribution was visually evaluated to confirm heteroscedasticity. Non-normal distributed variables were transformed (i.e. logarithmic, exponential, reciprocal or quadratic) before the statistical evaluation. Post hoc separation of means was performed after Tukey–Kramer adjustment. Difference between the LF-LS and HF-LS treatment was considered as a pre-planned contrast and evaluated using a contrast statement. Due to unbalanced data and lack of fixed effects, only means and standard deviations of digesta physicochemical properties for WBC and viscosity were reported. Differences in digesta physicochemical properties between GIT segments were analysed using the previously mentioned general linear model including the fixed effect of GIT segment. Results are presented as back-transformed least square means, and pooled standard deviation (sd pooled), unless indicated otherwise. Considering stomach MRT of solids and liquids as the most important parameters of this study, a power larger than 0·95 was reached on the main effect of treatment using retrospective power analysis (PROC GLMPOWER) with a two-sided α level of 0·05 and current study design and results. Differences among means with P values <0·05 were considered significant and P values between 0·05 and 0·10 were considered a trend.
Results
All pigs remained clinically healthy during the study duration and no adverse events were observed in any of the experimental groups. Data of one pig from the HF-LS treatment were excluded from statistical analyses due to feed refusals that exceeded 10 % of the daily feed allowance for seven consecutive days before the pigs’ dissection.
Digesta passage
On average, the MRT of solids was longer than that of liquids in the stomach (3·2 v. 1·2 h, P<0·0001; Table 3) and in the stomach+small intestine (5·3 v. 3·7 h, P<0·0001) but shorter in the distal half of the small intestine (1·8 v. 2·3 h, P<0·0001). The HF-HS pigs had a shorter MRT of solids (2·9 v. 4·1 h, P=0·01) and liquids (0·8 v. 1·5 h, P=0·002) in the stomach than the HF-MS pigs, but no other differences were observed between treatments varying in the proportion of S (HF-LS v. HF-MS v. HF-HS). Nutrient solubility did not influence the MRT of solids or liquids in the small intestine. When F increased with the additional intake of low-soluble nutrients (LF-LS v. HF-LS), MRT in the stomach increased for both solids (2·5 v. 3·3 h, P=0·041) and liquids (0·6 v. 1·3 h, P=0·0001). When F increased with additional intake of high-soluble nutrients (LF-LS v. HF-HS) no effects on MRT in the stomach were observed. In the distal half of the small intestine, the MRT of solids decreased with additional intake of low-soluble nutrients (LF-LS v. HF-LS: 2·1 v. 1·7 h, P=0·006) as well as high-soluble nutrients (LF-LS v. HF-HS: 2·1 v. 1·7 h, P=0·03).
Mean retention time (h) of digesta solids (TiO2) and liquids (Cr-EDTA) in consecutive segments of the gastrointestinal tract of pigs subjected to dietary treatments varying in feed intake level and nutrient solubilityFootnote † (Mean values and standard deviations)

LF-LS, low feed intake–low nutrient solubility; HF-LS, high feed intake–low nutrient solubility; HF-MS, high feed intake–medium nutrient solubility; HF-HS, high feed intake–high nutrient solubility; SI, small intestine; ME, metabolisable energy; MRT, mean retention time.
a,b,c Mean values within a row with unlike superscript letters were significantly different (P<0·05).
Significant difference between MRT of the solid and liquid phases of digesta per treatment within segment: **P<0·001, ***P<0·0001.
† Feed intake level at 1·9 (LF) or 2·8 (HF)×ME requirement for maintenance (419 kJ ME/kg BW0·75)( 18 ). Dietary nutrient solubility levels were 8 % (LF-LS and HF-LS), 19 % (HF-MS) and 31 % (HF-HS) regarding the amount of soluble protein and sucrose in the diet.
‡ Number of pigs per treatment: HF-LS=9; LF-LS, HF-MS and HF-HS=10.
§ Model established P values for fixed effects of treatment (overall dietary treatments), and the contrast between low or high feed intake level (LF-LS v. HF-LS).
|| Significant treatment×batch effect (P=0·025) for liquid phase MRT.
Nutrient digestibility
Digestibility of starch was calculated using TiO2 as marker, and apparent protein digestibility using both TiO2 and Cr-EDTA as markers. Calculated digestibility values of starch (TiO2) and protein (Cr-EDTA) in the stomach were negative and therefore not presented. Dietary treatment did not affect starch digestibility (Table 4). When F increased with additional intake of low-soluble nutrients, only the apparent protein digestibility (based on Cr-EDTA) increased in the proximal half of the small intestine (LF-LS v. HF-LS: –6 v. 25 %, P=0·013).
Apparent digestibility of starch and nitrogen (%) in the proximal and distal half of the small intestine (SI), based on TiO2 and Cr-EDTA as indigestible markers in pigs subjected to dietary treatments varying in feed intake level and nutrient solubilityFootnote †, including the overall effects of dietary treatment (low feed intake–low nutrient solubility (LF-LS) v. high feed intake–low nutrient solubility (HF-LS) v. high feed intake–high nutrient solubility (HF-HS) v. high feed intake–medium nutrient solubility (HF-MS)) and feed intake level (LF-LS v. HF-LS) (Mean values and standard deviations)

Significant difference between protein digestibility based on TiO2 and Cr-EDTA per treatment within segment: *P<0·05, **P<0·001, ***P<0·0001.
† Feed intake level at 1·9 (LF) or 2·8 (HF)×ME requirement for maintenance (419 kJ ME/kg BW0·75)( 18 ). Dietary nutrient solubility levels were 8% (LF-LS and HF-LS), 19% (HF-MS) and 31% (HF-HS) regarding the amount of soluble protein and sucrose in the diet.
‡ Number of pigs per treatment: HF-LS=9; LF-LS, HF-MS and HF-HS=10.
§ Model established P values for fixed effects of treatment (overall dietary treatments), and P values representing the contrast between low or high feed intake level (LF-LS v. HF-LS).
|| Significant batch effect in SI1 and SI2 (P=0·038 and P=0·003): starch digestibility of pigs in batch 1 smaller than pigs in batch 2.
Physicochemical properties
Dietary treatments did not affect the physicochemical properties of digesta in any GIT segment (P>0·12) as within-treatment variation was greater than between treatment variation (online Supplementary material). Therefore, results are presented as descriptive statistics (Table 5). Results on the WBC of digesta in the proximal half of the small intestine are not presented due to an insufficient number of samples. The average WBC of digesta was lowest in the stomach (1·9 g/g digesta DM) and highest in the caecum (5·7 g/g digesta DM) compared to the WBC of digesta in any other GIT segment (P<0·005). Dynamic viscosity properties of digesta, partly represented by apparent viscosity at 45/s and K, were on average higher in the distal half of the small intestine than in other GIT segments (visco 45: 8·4>2·2–3·3 Pa×s, P<0·0001; K: 177>35–54 Pa×s, P<0·0001).
Hydration and dynamic viscosity properties of digesta per gastrointestinal tract segment (Mean values and standard deviations)

SI, small intestine; ND, not determined; C, colon.
* Due to insufficient observations (one observation).
† Viscosity parameters derived by using a power-law function(
Reference van Bussel, Kerkhof and van Kessel
33
):
 $$\eta {\equals}K\dot{\gamma }^{{n{\minus}1}} $$
, where η=viscosity in Pa×s, K=consistency constant,
$$\eta {\equals}K\dot{\gamma }^{{n{\minus}1}} $$
, where η=viscosity in Pa×s, K=consistency constant,
 $$\dot{\gamma }$$
=shear rate (/s) and n=power-law index.
$$\dot{\gamma }$$
=shear rate (/s) and n=power-law index.
Discussion
This study aimed to evaluate the effects of (1) nutrient solubility and (2) feed intake level on the MRT of the solid and liquid digesta fraction in several GIT segments in growing pigs. The experimental design allowed to study the effects of (1) S as the proportion of soluble nutrients within the diet (HF-LS v. HF-MS v. HF-HS), (2) F (LF-LS v. HF-LS) on the MRT of digesta solids and liquids in the stomach and small intestine and (3) the dependency of F on S (i.e. LF-LS v. HF-LS or HF-HS). Based on ingredient selection, nutrient solubility of the low-soluble diet is considered representative for commercially fed dry diets to growing pigs. Dietary nutrient solubility was increased by exchanging low-soluble ingredients for high-soluble ingredients, thereby covering the range of variation in solubility between ingredients regarding protein (from 4 % in wheat to >80 % in whey protein isolate)Reference de Wit (15 , Reference Wilfart, Jaguelin-Peyraud and Simmins 19) and starch (i.e. glucose-equivalents; from 4 % in wheat to 100 % in sucrose)Reference Wilfart, Jaguelin-Peyraud and Simmins (19) . Concerning the treatments differing in S, the proportion of soluble nutrients in the diet increased from the HF-LS to the HF-HS treatment with a factor 2·3 for protein and 4·6 for glucose equivalents. Hereby, 45 kJ gross energy/kg metabolic BW per meal was shifted from insoluble to soluble nutrients, exceeding the nutrient load (approximately 33 kJ gross energy/kg metabolic BW per meal) that induced an effect on gastric emptying rate in previous studies in humansReference Collins, Houghton and Read (4 , Reference Houghton, Read and Heddle 13) .
Although it was expected that an increased intake of soluble nutrients could reduce gastric emptying through stimulation of nutrient feedback mechanisms in the small intestineReference Collins, Houghton and Read (4 , Reference Houghton, Read and Heddle 13) , the results in the present study do not support this hypothesis. Instead, increasing S, via the relative higher intake of soluble nutrients, resulted in a decreased MRT of digesta in the stomach. The latter indicates faster emptying of the stomach. This result, however, was only observed when S increased to the highest level applied (HF-MS to HF-HS), thereby indicating a non-linear effect of S on the MRT of digesta in the stomach. Previous studies showed an increase in MRT of digesta in the stomach with additional intake of soluble nutrients, the effect however being confounded with the effect of total nutrient and energy intake (1230 v. 1967 kJ gross energy/meal). Whereas it has also been shown that increasing feed intake level causes increased stomach MRT in both pigs and humansReference Gregory, McFadyen and Rayner (12 , Reference Moore, Christian and Coleman 39) . By shifting nutrients from the solid to the liquid fraction of digesta in our study, we expected stimulation of nutrient feedback mechanisms in the small intestine by the rapid postprandial appearance of soluble nutrients in that segment. It seems that the intake of the high-soluble nutrients in this study to increase S and F were not able to trigger the feedback mechanisms. As the feedback mechanisms regulating digesta passage are complex in nature and their stimulation depends on many factors such as the type of stimuli, GIT location and duration of stimulation(Reference Marciani, Gowland and Fillery-Travis 9 – Reference van Citters and Lin 11 , Reference Lin, Doty and Reedy 40) . Potentially the stimulus duration was too short, as high-soluble nutrients are generally absorbed rapidly after entering the small intestineReference Kong and Singh (41 , Reference Rerat 42) . Unfortunately, the study design does not allow to speculate the dietary or animal factors that particularly caused the non-linear effect of S the passage kinetics of digesta.
The effect of F was dependent on S, as additional intake of high-soluble nutrients did not affect the digesta passage from the stomach, while additional intake of low-soluble nutrients caused the MRT of digesta in the stomach to increase. This is in agreement with the previous findings, where an increase in feed intake level caused stomach MRT to increaseReference Gregory, McFadyen and Rayner (12 , Reference Moore, Christian and Coleman 39) . It seems that the low-soluble nutrients were able to stimulate nutrient feedback mechanisms in the small intestine, in contrast to the high-soluble nutrients. As with solids, the passage of additional low-soluble nutrients depends on the gradual trituration process in the stomachReference Kong and Singh (41) which might also have caused the observed increase in MRT.
In the small intestine, no effects of S on the MRT of solids and liquids were observed. The dietary treatments with low, medium or high S were designed to provide equal amounts of digestible nutrients. Exchange of ingredients from the low S to the high S diet resulted in a slightly lower intake of NSP in pigs fed the HF-LS v. HF-MS and HF-HS. Differences in intake of NSP was not corrected by adding fibres, as (purified) fibres can affect physicochemical properties of digesta and subsequently affect gastric emptying rateReference Guerin, Ramonet and Lecloarec (43) . As current dietary treatments were not designed to evoke effects on physicochemical properties of digesta, these properties were analysed for confirmation. The results confirmed that dietary treatment caused no differences between the physicochemical properties of digesta.
Regarding the digestibility of protein and starch in the small intestine, no treatment effects were observed, except in the proximal half of the small intestine. In the proximal half of the small intestine, using Cr-EDTA as marker, the apparent protein digestibility was lower for pigs fed low F compared to pigs fed high F (LF-LS v. HF-LS). Negative digestibility values observed in particular GIT segments are likely related to endogenous protein secretions and/or discrepancies between the passage rates of nutrients and trace markers. The discrepancy in apparent protein digestibility values when using either TiO2 or Cr-EDTA as marker likely results from shifts of nutrients, and possibly of markers, between the solid and liquid digesta fractions during transit through the GITReference Williams, David and Iismaa (34) . However, as digesta transits along the GIT nutrients are hydrolysed and absorbed, and digesta becomes more homogenous. Therefore, differences between passage rates of solids and liquids become smaller, and artefacts in calculations of nutrient digestibility reduce.
In conclusion, the MRT of solids was greater than that of liquids in the stomach and stomach+small intestine. Dietary nutrient solubility affected the stomach MRT of solids and liquids in a non-linear manner. When S increased, the stomach MRT of solids and liquids decreased, but only at the highest level of S. Feed intake level increased stomach MRT of solids and liquids, only when F increased with additional low-soluble nutrients. Furthermore, F decreased the MRT of solids and, to some extent, of liquids in the distal small intestine. Hence, dietary nutrient solubility and feed intake level affect the passage rate of digesta. These study results can be used to better predict the metabolic fate of nutrients, taking into account the kinetics of nutrient passage and thereby the kinetics of nutrient absorption.
Acknowledgements
The authors would like to thank Jennifer Ellis, Piet van Wikselaar, Gera Uittenbogaard, Ruud Dekker, Jos Sewalt (Wageningen University and Research, Wageningen, the Netherlands), Carlijn de Bruijn, Martien Nooijen, Jos Weerts and animal caretakers at the Swine Research Centre (Boxmeer, the Netherlands) for their advice and/or skilled assistance during the set-up and practical work of this study.
This research was carried out and funded within the framework of the public–private partnership ‘Feed4Foodure’ (‘Vereniging Diervoederonderzoek Nederland’ (VDN) and the Dutch Ministry of Economic Affairs and Climate Policy; BO-31.03-005-001).
M. S., A. J. M. J. and W. J. J. G. designed research; M. S. conducted research and handled data; M. S., A. J. M. J., S. d. V. and W. J. J. G. interpreted data and wrote paper. All authors read and approved the final manuscript.
The authors declare that there are no conflicts of interest.
Supplementary material
For supplementary material/s referred to in this article, please visit https://doi.org/10.1017/S0007114518003756



