


INTRODUCTION AND SITE DESCRIPTION
The Eifel region in central Europe is an established geoarchive for climate reconstruction in central Europe as the climate in the area between Belgium and Poland is thought to have been nearly homogenous on longer time scales (Wernli and Pfahl, Reference Wernli, Pfahl and Wetter2009). Here we present a new eolian dust record from the Auel dry maar, located in the Eifel volcanic field in Germany (Fig. 1). The record spans almost the past 60 ka, as the volcano erupted around 59.3 ka ago (Sirocko, unpublished data). The Eifel volcanic field consists of seven recent maar lakes and about 60 dry maar lakes (sediment-infilled former maar lakes). The silted-up Auel Maar lake had a diameter of about 1.3 km and a depth of 105 m (Brunck et al., Reference Brunck, Sirocko and Albert2016; Sirocko et al., Reference Sirocko, Knapp, Dreher, Förster, Albert, Brunck and Veres2016). A small, 5-km-long creek (modern “Tieferbach”) filled up the maar lake until the early Holocene (Brunck et al., Reference Brunck, Sirocko and Albert2016). Hence, we have chosen to end the presented timeseries with the Laacher See Tephra, which marks the date of 12,930 yr b2k (all ages are given in b2k, years before 2000 Common Era) and is established from varve counting (Brauer et al., Reference Brauer, Endres and Negendank1999). The creek fed the maar lake, which led to a comparatively high sedimentation rate of about 2 mm per yr (Sirocko et al., Reference Sirocko, Knapp, Dreher, Förster, Albert, Brunck and Veres2016). The geology surrounding the Auel dry maar belongs to the Variscan basement terrain of the Rhenish Shield. It is characterized by non-calcareous sand-, silt-, and mudstones mostly of Lower Devonian age. Carbonate rocks are not found west of the dry maar in the catchment area of the creek (see Fig. 1), but are exposed to the north, east, south, and southwest in the immediate vicinity of the Auel dry maar (Meyer, Reference Meyer2013; Landesamt für Geologie und Bergbau, 2020).
(color online) Simplified geological map of the Auel dry maar area showing basement rocks and calcareous rocks of the Eifel (modified after Meyer, Reference Meyer2013; Landesamt für Geologie und Bergbau, 2020).

The climate of central Europe was characterized by the Weichselian ice age during the last 60 ka. The Early Marine Isotope Stage 3 (MIS3; Lisiecki and Raymo, Reference Lisiecki and Raymo2005), beginning around 60 ka and lasting until 48 ka, was warm and humid with intensified tree growth (Sirocko et al., Reference Sirocko, Knapp, Dreher, Förster, Albert, Brunck and Veres2016). Speleothem growth is documented in the Bunker Cave in close proximity to the Eifel (Weber et al., Reference Weber, Scholz, Schroeder-Ritzrau, Deininger, Spoetl, Lugli and Mertz-Kraus2018). The middle MIS3 (48–38.5 ka) was characterized by colder and drier conditions (Sirocko et al., Reference Sirocko, Knapp, Dreher, Förster, Albert, Brunck and Veres2016) and increased dust transport processes (Seelos et al., Reference Seelos, Sirocko and Dietrich2009). These conditions intensified within the late MIS3 (38.5 to 24 ka), and dust became the major component of Eifel maar lakes (Sirocko et al., Reference Sirocko, Dietrich, Veres, Grootes, Schaber-Mohr, Seelos and Nadeau2013). During the last glacial maximum (LGM, 26.5–19 ka; Clark et al., Reference Clark, Dyke, Shakun, Carlson, Clark, Wohlfarth, Mitrovica, Hostetler and McCabe2009), dryness and cold and westerly to northwesterly winds were predominant (Hatté et al., Reference Hatté, Fontugne, Rousseau, Antoine, Zöller, Laborde and Bentaleb1998; Huijzer and Vandenberghe, Reference Huijzer and Vandenberghe1998; Renssen et al., Reference Renssen, Kasse, Vandenberghe and Lorenz2007), but a number of easterly wind events were still apparent (Dietrich and Seelos, Reference Dietrich and Seelos2010). High wind speeds and increased aridity are usually accompanied by intensive dust and loess deposition (e.g., Sun et al., Reference Sun, Wang, Liu and Clemens2010). After the LGM with maximum ice sheet extent, the glacial termination took place, which was characterized by increased moisture and temperature (e.g., Clark et al., Reference Clark, Dyke, Shakun, Carlson, Clark, Wohlfarth, Mitrovica, Hostetler and McCabe2009; Denton et al., Reference Denton, Anderson, Toggweiler, Edwards, Schaefer and Putnam2010). However, for the larger region around the Eifel, which includes Belgium (e.g., Vandenberghe et al., Reference Vandenberghe, Huijzer, Mücher and Laan1998; Rommens et al., Reference Rommens, Verstraeten, Peeters, Poesen, Govers, Van Rompaey, Mauz, Packman and Lang2007; Haesaerts et al., Reference Haesaerts, Borziac, Chekha, Chirica, Damblon, Drozdov, Orlova, Pirson and van der Plicht2009, Reference Haesaerts, Damblon, Gerasimenko, Spagna and Pirson2016), northern France (e.g., Antoine et al., Reference Antoine, Catt, Lautridou and Sommé2003), and the Rhine valley (e.g., Antoine et al., Reference Antoine, Rousseau, Zöller, Lang, Munaut, Hatté and Fontugne2001; Rousseau et al., Reference Rousseau, Sima, Antoine, Hatté, Lang and Zöller2007; Frechen et al., Reference Frechen, Ellwanger, Hinderer, Lämmermann-Barthel, Neeb and Techmer2010; Frechen and Schirmer, Reference Frechen and Schirmer2011; Krauß et al., Reference Krauß, Kappenberg, Zens, Kehl, Schulte, Zeeden, Eckmeier and Lehmkuhl2018), and also for China (e.g., Lu et al., Reference Lu, Wang, Ma, Tan, Vandenberghe, Miao, Li, Sun, An and Cao2004; Sun et al., Reference Sun, Wang, Liu and Clemens2010), evidence of intensive loess deposits during the glacial termination and the Holocene is presented.
Eolian particles of grain sizes larger than 63 μm are often transported locally or regionally in saltation. However, grains of this size are lightweight enough to be transported by wind, and they represent more local or regional dust compared to the silt fraction (Vandenberghe, Reference Vandenberghe2013). During this transport process, edges and corners are cut off and grains become rounder. Percussion marks can also be found after such a transport. Therefore, more-rounded grains of this size are a clear indication of eolian transport (e.g., Krinsley and Doornkamp, Reference Krinsley and Doornkamp2011; Mycielska-Dowgiałło and Ludwikowska-Kędzia, Reference Mycielska-Dowgiałło and Ludwikowska-Kędzia2011; Vandenberghe, Reference Vandenberghe2013; Woronko and Pisarska-Jamroży, Reference Woronko and Pisarska-Jamroży2016).
Previous studies have shown increased dust activity during glacial and stadial times for several regions in Europe. For example, the Nussloch loess sequence (e.g., Rousseau et al., Reference Rousseau, Sima, Antoine, Hatté, Lang and Zöller2007; Antoine et al., Reference Antoine, Rousseau, Moine, Kunesch, Hatté, Lang, Tissoux and Zöller2009) revealed detailed climate variations comparable to the Greenland Interstadials (GI) recorded in the Greenland ice cores (e.g., North Greenland Ice Core Project Members et al., Reference Andersen, Azuma, Barnola, Bigler, Biscaye, Caillon and Chappellaz2004; Rasmussen et al., Reference Rasmussen, Bigler, Blockley, Blunier, Buchardt, Clausen and Cvijanovic2014). The landforms and grain characteristics of loess and eolian sand have traditionally been used as a basis for dust reconstruction in west and central Europe (e.g., Manikowska, Reference Manikowska1985; Gozdzik, Reference Godzik1991, in Poland; Vandenberghe, Reference Vandenberghe1991; van Huissteden et al., Reference van Huissteden, Gibbard and Briant2001a, Reference van Huissteden, Schwan and Batemanb; Kasse, Reference Kasse2002, in the Netherlands). In contrast to the mentioned loess sequences, the Eifel Laminated Sediment Archive (ELSA; Seelos et al., Reference Seelos, Sirocko and Dietrich2009; Sirocko et al., Reference Sirocko, Knapp, Dreher, Förster, Albert, Brunck and Veres2016) Dust Stack-20 of the Auel dry maar represents a continuous sedimentation within a terrestrial archive with a high temporal resolution that extends from a millennial time scale to a finer scale of annual total organic carbon data (Sirocko, unpublished data). Other established dust records include, for example, the loess plateau in East Asia (e.g., Sun et al., Reference Sun, Wang, Liu and Clemens2010) or marine sediment cores of the Arabian Sea (e.g., Schulz, et al., Reference Schulz, von Rad, Erlenkeuser and von Rad1998; Deplazes et al., Reference Deplazes, Lückge, Peterson, Timmermann, Hamann, Hughen and Röhl2013). Eolian dust reconstructions are also known from the Atlantic Ocean, especially from the Sahara Desert (e.g., Collins et al., Reference Collins, Govin, Mulitza, Heslop, Zabel, Hartmann, Röhl and Wefer2013). A kind of reference record for eolian particle transportation in the Northern Hemisphere is represented by the dust reconstructions of Ruth and colleagues (2007) from the North Greenland Ice Core Project (NGRIP) ice core. They investigated the dust concentration and reconstructed a long and continuous eolian time series.
As yet, there is not a commonly accepted definition for “loess.” Nevertheless, there is a fundamental consensus that loess is a mainly silt-dominated eolian dust deposit (Sprafke and Obreht, Reference Sprafke and Obreht2016) often enriched in carbonates. Hence, we interpret the dust sequences of the Auel Maar as a lacustro-eolian deposit comparable to loess as defined by Vandenberghe (Reference Vandenberghe2013). The key objective of this paper is to present a dust record, reconstructed from carbonate roundness and CaCO3 data of the ELSA Dust Stack-20, that will serve as a continuous terrestrial sediment record for central Europe with almost all Greenland stadials (GS) and Heinrich events between 60 and 13 ka represented.
METHODS
The ELSA Dust Stack-20 was composed of two overlapping sediment cores (AU3 and AU4) from the Auel dry maar. The approximately 100-m-long cores (see Supplementary Material) were synchronized using different marker layers (such as tephrene [Förster et al., Reference Förster, Zemlitskaya, Otter, Buhre and Sirocko2020], prominent diatom layers, distinct Corg maxima, etc.) and then divided into 1000 samples of 10 cm each (Sirocko et al., unpublished data). Each of these samples covers about 50 years, and the average sedimentation rate is 1.7–2 mm per yr (Sirocko et al., Reference Sirocko, Knapp, Dreher, Förster, Albert, Brunck and Veres2016, unpublished data). Events such as landslides, tephrenes, or large flood layers were subsequently removed from the stack to achieve temporally continuous data series. The 10-cm samples from the Auel cores were used for several measurements, including loss on ignition (LOI), CaCO3 and grain measurements (this study); beetle remains (Britzius et al., unpublished data); macro remains and pollen (Sirocko et al., Reference Sirocko, Knapp, Dreher, Förster, Albert, Brunck and Veres2016); and flood layers (Brunck et al., Reference Brunck, Sirocko and Albert2016). For core photos, see the Supplementary Materials. For further methods, Corg(chlorins) data, and the respective age model, see Sirocko and colleagues (unpublished data).
The stratigraphy of the core is based on tephra layer correlation and palynostratigraphy, but mainly on 14C dating and the 10Be maximum during the Laschamp (Sirocko et al., unpublished data). The core was then fine-tuned using the LOI and Corg(chlorins) (organic carbon) of the ELSA-20 Auel Stack and a Bayesian Age Model in comparison to the δ18O of the NGRIP ice core (see Sirocko et al., unpublished data).
The CaCO3, LOI and grain analyses were performed from the 10-cm bulk stack-samples. The LOI was analyzed with a Muffle furnace B410 (Nabertherm, Lilienthal). Therefore, 4 grams of dry sample material were mortarized and homogenized. The samples were then placed in the muffle furnace af 550 °C for four hours and weighed back afterwards. The resulting weight loss is proportional to the organic carbon (Corg).
The “Scheibler Gasometer” (Fa. Carl Hamm GmbH, Essen, Germany) determination of the total carbonate content is a volumetric method, relative to the dry mass of the sample. First, the sample must be pulverized and dried. Then a small part of the sample is sprinkled with 2 mol / l HCl in order to determine the sample quantity for the Gasometer based on the varying effervescence of the sample, which depends on the calcareous content. The sample was weighed (0.3 g for very persistent effervescent samples to 5.0 g for non-sparkling samples) and filled into the gas development vessel, and the gas cylinders were filled with water up to the zero mark of the measuring cylinder using a pump. Next, 10 ml of the hydrochloric acid was poured into the test tube in the gas evolution chamber and brought into contact with the sample. Due to the CO2 development, the water column of the measuring cylinder shifts. The carbonate content can be determined from the displaced water quantity. By comparison with pure calcium carbonate (CaCO3) an equivalent content of CaCO3 of the 10-cm bulk samples is determined.
The grain analyses were performed for every second sample of the 1000 samples, while the rest were archived for future analyses. The samples were weighed and allowed to react with 7.5% H2O2 for three days to remove organic material. The clay aggregates were then crushed by ultrasonic waves, and the samples were sieved to 63-μm grain size to retain the sand fraction. After sieving, the samples were dried again and weighed. Thin sections of the sieve samples were prepared. Then, a transparent two-component adhesive was applied to object slides, on which the grains were scattered in a single layer. The thin sections were then automatically scanned under polarized light with an Olympus BX51 microscope (Olympus K.K., Shinjuku Tokyo) and an Olympus SC50 camera on a Märzhäuser stage (Märzhäuser, Wetzlar).
Measurements were performed with the Stream motion software from Olympus. The different grains were visually separated, and one type of grain was identified as carbonate grains by using hydrochloric acid (HCl). The grains were then automatically distinguished for each sample by their interference colors (Seelos and Sirocko, Reference Seelos and Sirocko2005; Dietrich and Seelos, Reference Dietrich and Seelos2010). These grain classifications were then exported as tables and imported into a RADIUS module, where the analysis was carried out. The RADIUS software package was originally introduced by Seelos and Sirocko (Reference Seelos and Sirocko2005) and updated for this work (see Supplementary Material). It is a Matlab-based (The MathWork Corp., Natick) statistical application to calculate particle distribution and particle shape parameters of disturbed or undisturbed multi-compositional samples. In contrast to earlier versions of RADIUS, the new algorithm generates a set of parameters for every single particle (sorting, unconformity, skewness, kurtosis, mean grain size, formfactor, roundness, and content of the previously defined grain types from all analyzed grains; see Seelos and Sirocko, Reference Seelos and Sirocko2005; Seelos et al., Reference Seelos, Sirocko and Dietrich2009; Dietrich and Seelos, Reference Dietrich and Seelos2010), which allows the definition of selection criteria referring to the scientific question (see Supplementary Material for detailed information). The basic measuring data per particle are the equivalent circle diameter (ECD), the form factor (FF), and the elongation (ELO).
The ECD is defined as:

The FF is an attribute of surface roughness (range 0–1), whereby 1 means totally plain and 0 means entirely rough surface:

The ELO is the quotient of the shortest vs. longest diameter (range 0–1), whereby 1 means totally round and 0 means elongated:

The RADIUS results output several different parameters for each grain. The carbonate roundness turned out to be the most robust dust parameter for the present scientific question.
Figure 2 shows carbonate grains that differ in roundness. These are sorted from excellently rounded and eolian transported (see Fig. 2A) to well rounded and only slightly transported (Fig. 2B) to not rounded and almost not transported at all (see Fig. 2C). Figure 2D, in addition, shows carbonates, which are typical for in situ secondary carbonate growth. These are either completely unrounded and formed as a crust at the margins of the maar lake (see Fig. D2), or they are well rounded, indicating that they were formed at some distance and then transported (see Fig. D1).
(color online) Exemplary carbonate grains found in the ELSA Dust Stack-20. (A) well-rounded, dull, eolian-transported carbonate grain, stack sample 671 (AU3 68.6 m, ~39 ka, GS9); (B) slightly rounded with a short eolian transport carbonate grain, stack sample 485 (AU4 49.7 m, ~30 ka, GS5); (C) unrounded with no transport carbonate grain, stack sample 647 (AU4 66.1 m, ~37.5 ka, GI8); (D) carbonates from in-situ carbonate growth, either transported and rounded (D1, stack sample 787, AU3 80.3 m, ~47.5 ka, GS13) or not (D2, stack sample 134, AU3 14.3 m, ~14 ka, GI1).

RESULTS
Figures 3A and 3B show the stratigraphic correlation of the ELSA Dust Stack-20 LOI with almost all GI in the NGRIP ice core. Different stratigraphic nomenclature from the marine and terrestrial realms are also correlated (Vandenberghe, Reference Vandenberghe1985; Lisiecki and Raymo, Reference Lisiecki and Raymo2005; Sirocko et al., Reference Sirocko, Knapp, Dreher, Förster, Albert, Brunck and Veres2016). The MIS3 is named “Middle Pleniglacial” in terrestrial realms (60–29 ka; Vandenberghe Reference Vandenberghe1985; see fig. 3 for stratigraphic correlation). The LGM (Clark et al., Reference Clark, Dyke, Shakun, Carlson, Clark, Wohlfarth, Mitrovica, Hostetler and McCabe2009; 26.5–19 ka) was partly synchronous with the “Late Pleniglacial,” while the glacial termination was named “Late glacial” in terrestrial realms. The carbonate grain roundness of the ELSA Dust Stack-20 presents a terrestrial time series for the period of 60 to ~13 ka (see Fig. 3C) showing prominent increases within most GS; however, GS5.1 and GS4 are not visible. The sediments of GS12 show sedimentary disturbance, which Sirocko and colleagues (unpublished data) interpreted as having been caused by a complete freezing of the maar down to depths, disturbing the uppermost sediments of GS12 and GI12. The layering is disturbed; accordingly, the event did not preserve all information and the interpretation is difficult. Parts of GS12 were consequently removed from the data sets of carbonate grain roundness and CaCO3.
Comparison of climate proxies (B)–(E) for central Europe for 60–13 ka b2k with the NorthGRIP δ18O climate record. All data were plotted in such a way that the spikes, which correlate to the Greenland Stadials (GS), can be found on the left side as in the well-known North Greenland Ice Core Project (NGRIP) diagram. (A). Light yellow bars indicate Greenland Interstadials (GI), light blue bars indicate GS, and shaded areas indicate Heinrich Events (Naafs et al., Reference Naafs, Hefter, Grützner and Stein2013; Rasmussen et al., Reference Rasmussen, Bigler, Blockley, Blunier, Buchardt, Clausen and Cvijanovic2014). (B) shows ELSA Dust Stack-20 loss on ignition data, which correspond to organic carbon documenting peaks during GI (Sirocko et al., unpublished data). (C) shows carbonate grain roundness (10 cm bulk samples [grey line: original data; black line: 200-year running mean-smoothed original data]) shows most GS by increased roundness values. HE1 shows the highest roundness values, even beyond the displayed scale, which is indicated by dots. (D) shows CaCO3 values of the ELSA Dust Stack-20 (10-cm bulk sample resolution). (E) shows the ELSA Dust Stack (2009) dust index (Seelos et al., Reference Seelos, Sirocko and Dietrich2009) with almost all GI visible. Landscape Evolution Zones (LEZ) for stratigraphic correlation can be found in Sirocko et al., Reference Sirocko, Knapp, Dreher, Förster, Albert, Brunck and Veres2016 (For interpretation of the references to color in this figure legend, the reader is referred to the web version of this article.)
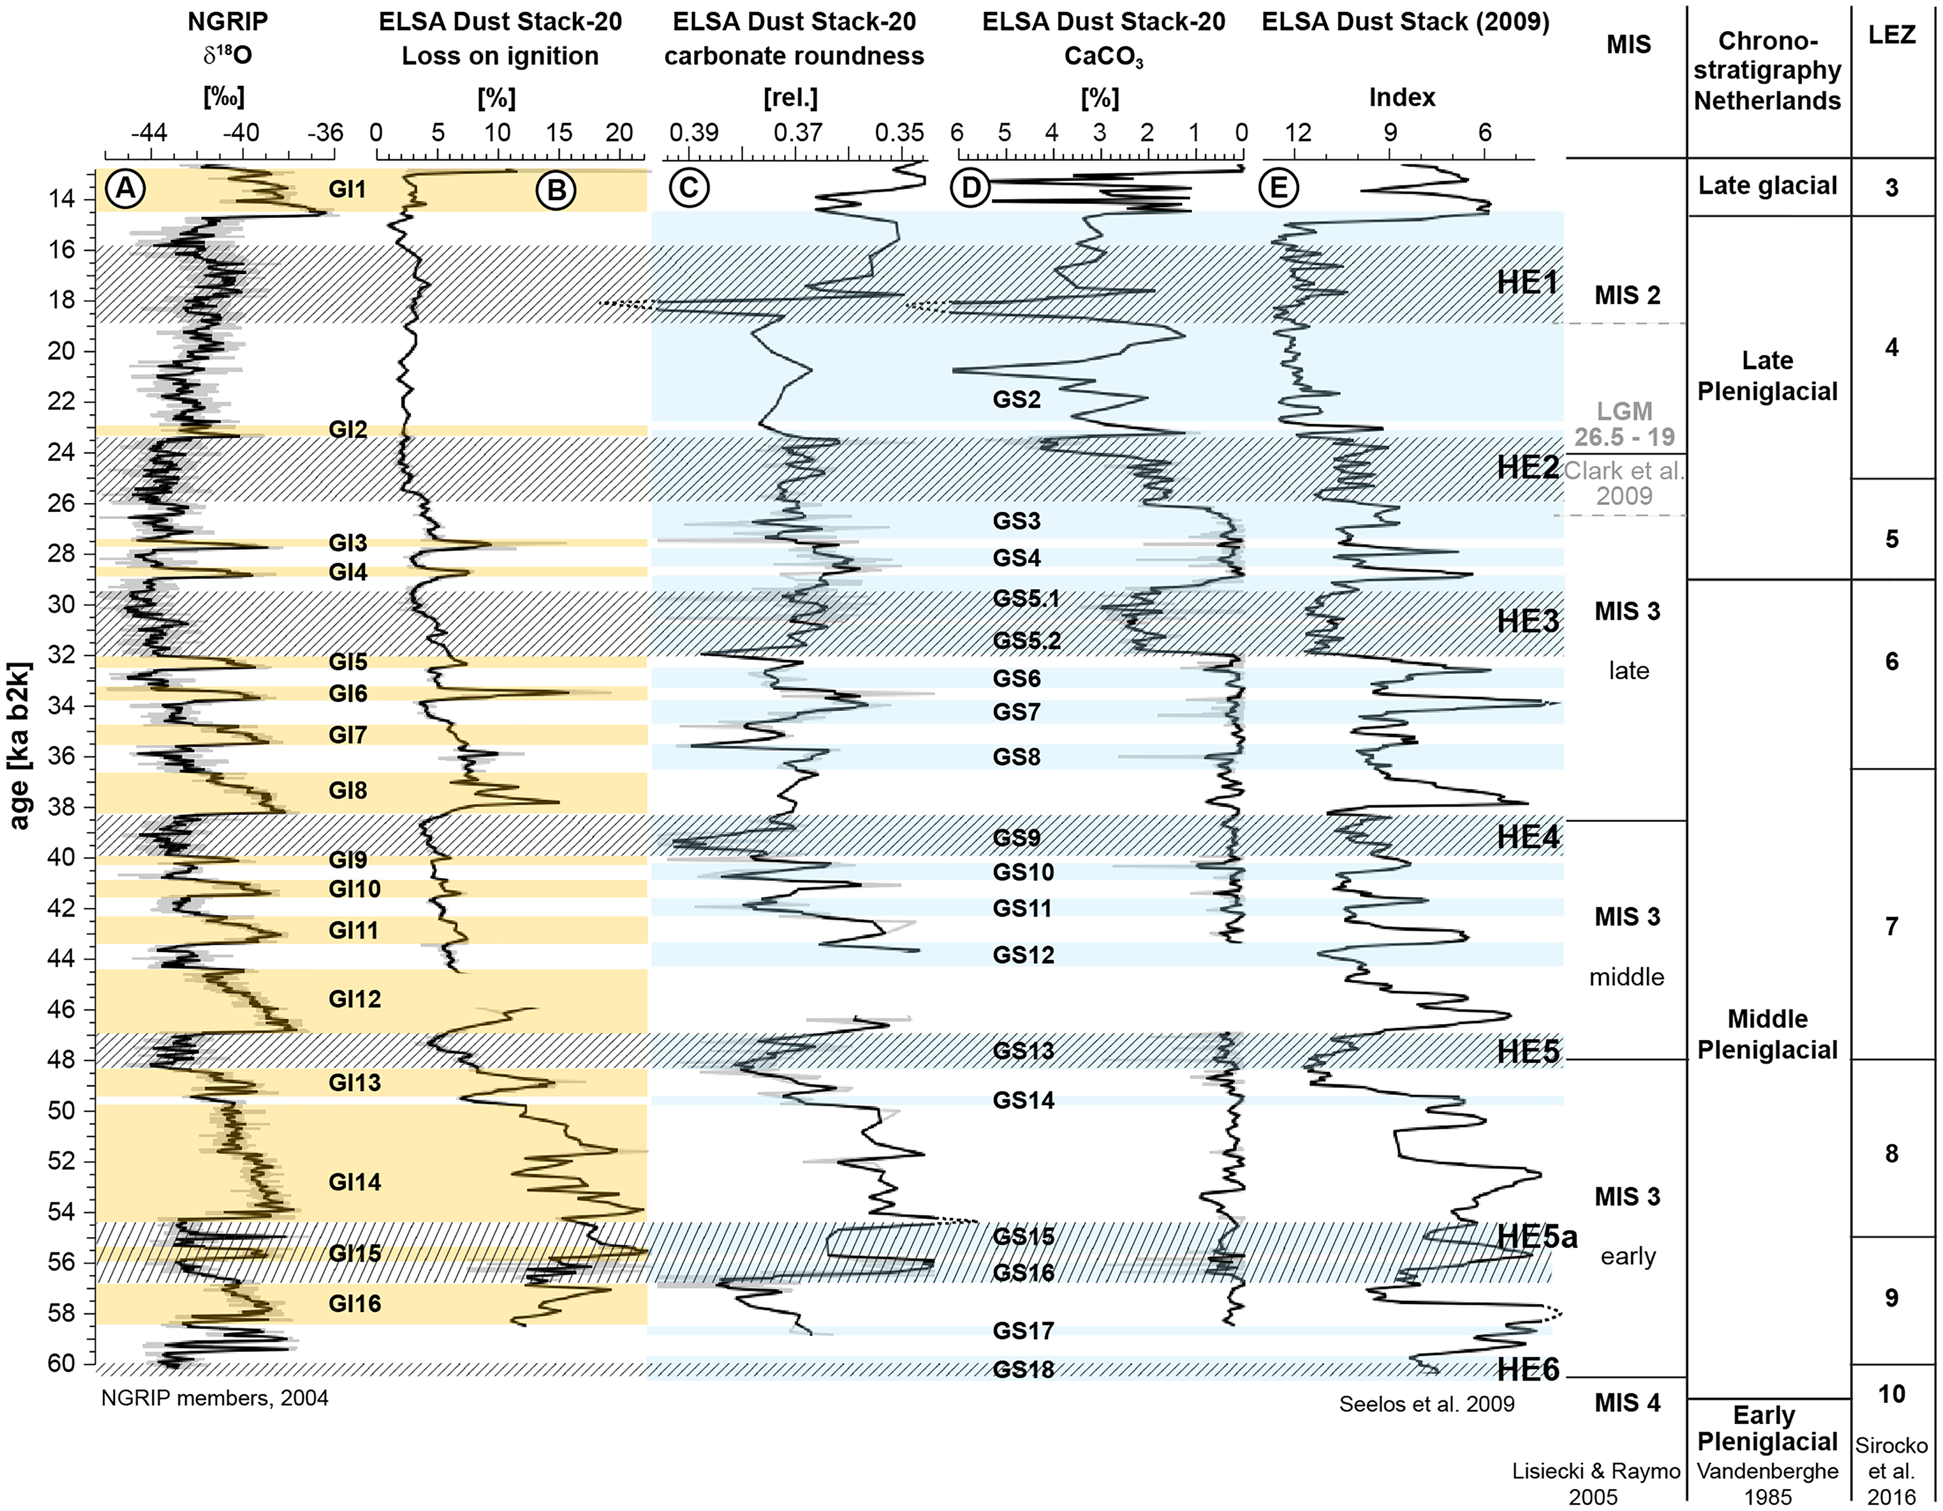
The carbonate roundness data are comparable to the GS of the NGRIP ice core (North Greenland Ice Core Project Members et al., Reference Andersen, Azuma, Barnola, Bigler, Biscaye, Caillon and Chappellaz2004). In particular, the stadials that coincide with Heinrich events are identifiable. HE5a, HE5, HE4, and HE1 are visible in the carbonate roundness data, but HE3 and HE2 are not. The lowermost carbonate roundness values of the entire data set are found at the beginning of GI14 (~53.5 ka). Subsequently, the roundness increases during GI14 and toward GS13/HE5, where the grain roundness values are very high. After the carbonate grain roundness values drop significantly at the end of HE5, they subsequently increase again in the trend toward HE4. However, this is not observed after HE4, where the carbonate grain roundness values vary between stadial/interstadial times, although the trend remains relatively homogeneous.
Figure 3D shows the CaCO3 time series indicating all stadials during the LGM. The first significant increase occurs simultaneously with the onset of HE3 (~32 ka). Thereafter, the Heinrich stadials HE3, HE2, and HE1 are characterized by a significantly increased CaCO3 content. The characteristic dust double peak of the NGRIP ice core during HE2 (Fig. 4A; Ruth et al., Reference Ruth, Bigler, Röthlisberger, Siggaard-Andersen, Kipfstuhl, Goto-Azuma, Hansson, Johnsen, Lu and Steffensen2007) can be recognized simultaneously (26 and 24 ka) in the CaCO3 values of the ELSA Dust Stack-20 (see Fig. 3D) as a two-stage increase. During the LGM the CaCO3 values vary consistently at relatively high levels. HE1, on the other hand, shows a further significant increase even at these high values.
Comparison of dust-related timeseries from 60 to 13 ka b2k shown with growing distance from the North Atlantic. Light blue bars display Greenland stadials (GS) after Rasmussen and colleagues (Reference Rasmussen, Bigler, Blockley, Blunier, Buchardt, Clausen and Cvijanovic2014); shaded areas show Heinrich events after Naafs and colleagues (Reference Naafs, Hefter, Grützner and Stein2013) and Rasmussen and colleagues (Reference Rasmussen, Bigler, Blockley, Blunier, Buchardt, Clausen and Cvijanovic2014). All data were plotted in such a way that the spikes, which correlate to the GS, can be found on the left side as in the well-known North Greenland Ice Core Project (NGRIP) diagram; (A) Greenland: NGRIP dust concentration; (B) North Atlantic: IODP-305-U1313 marine sediment core, dolomite/calcite ratio as ice raft debris proxy; (C) Central Europe: ELSA Dust Stack-20 terrestrial sediment core, carbonate grain roundness as regional dust proxy; (D) North Africa: GeoB9508-5 marine sediment core, dust content; (E) Arabian Sea: SO130-289KL marine sediment core, reflectance data; (F) East Asia: Jingyuan loess terrestrial archive, mean grainsize. All records show Heinrich events, regardless of the sediment archive type. (For interpretation of the references to color in this figure legend, the reader is referred to the web version of this article.)
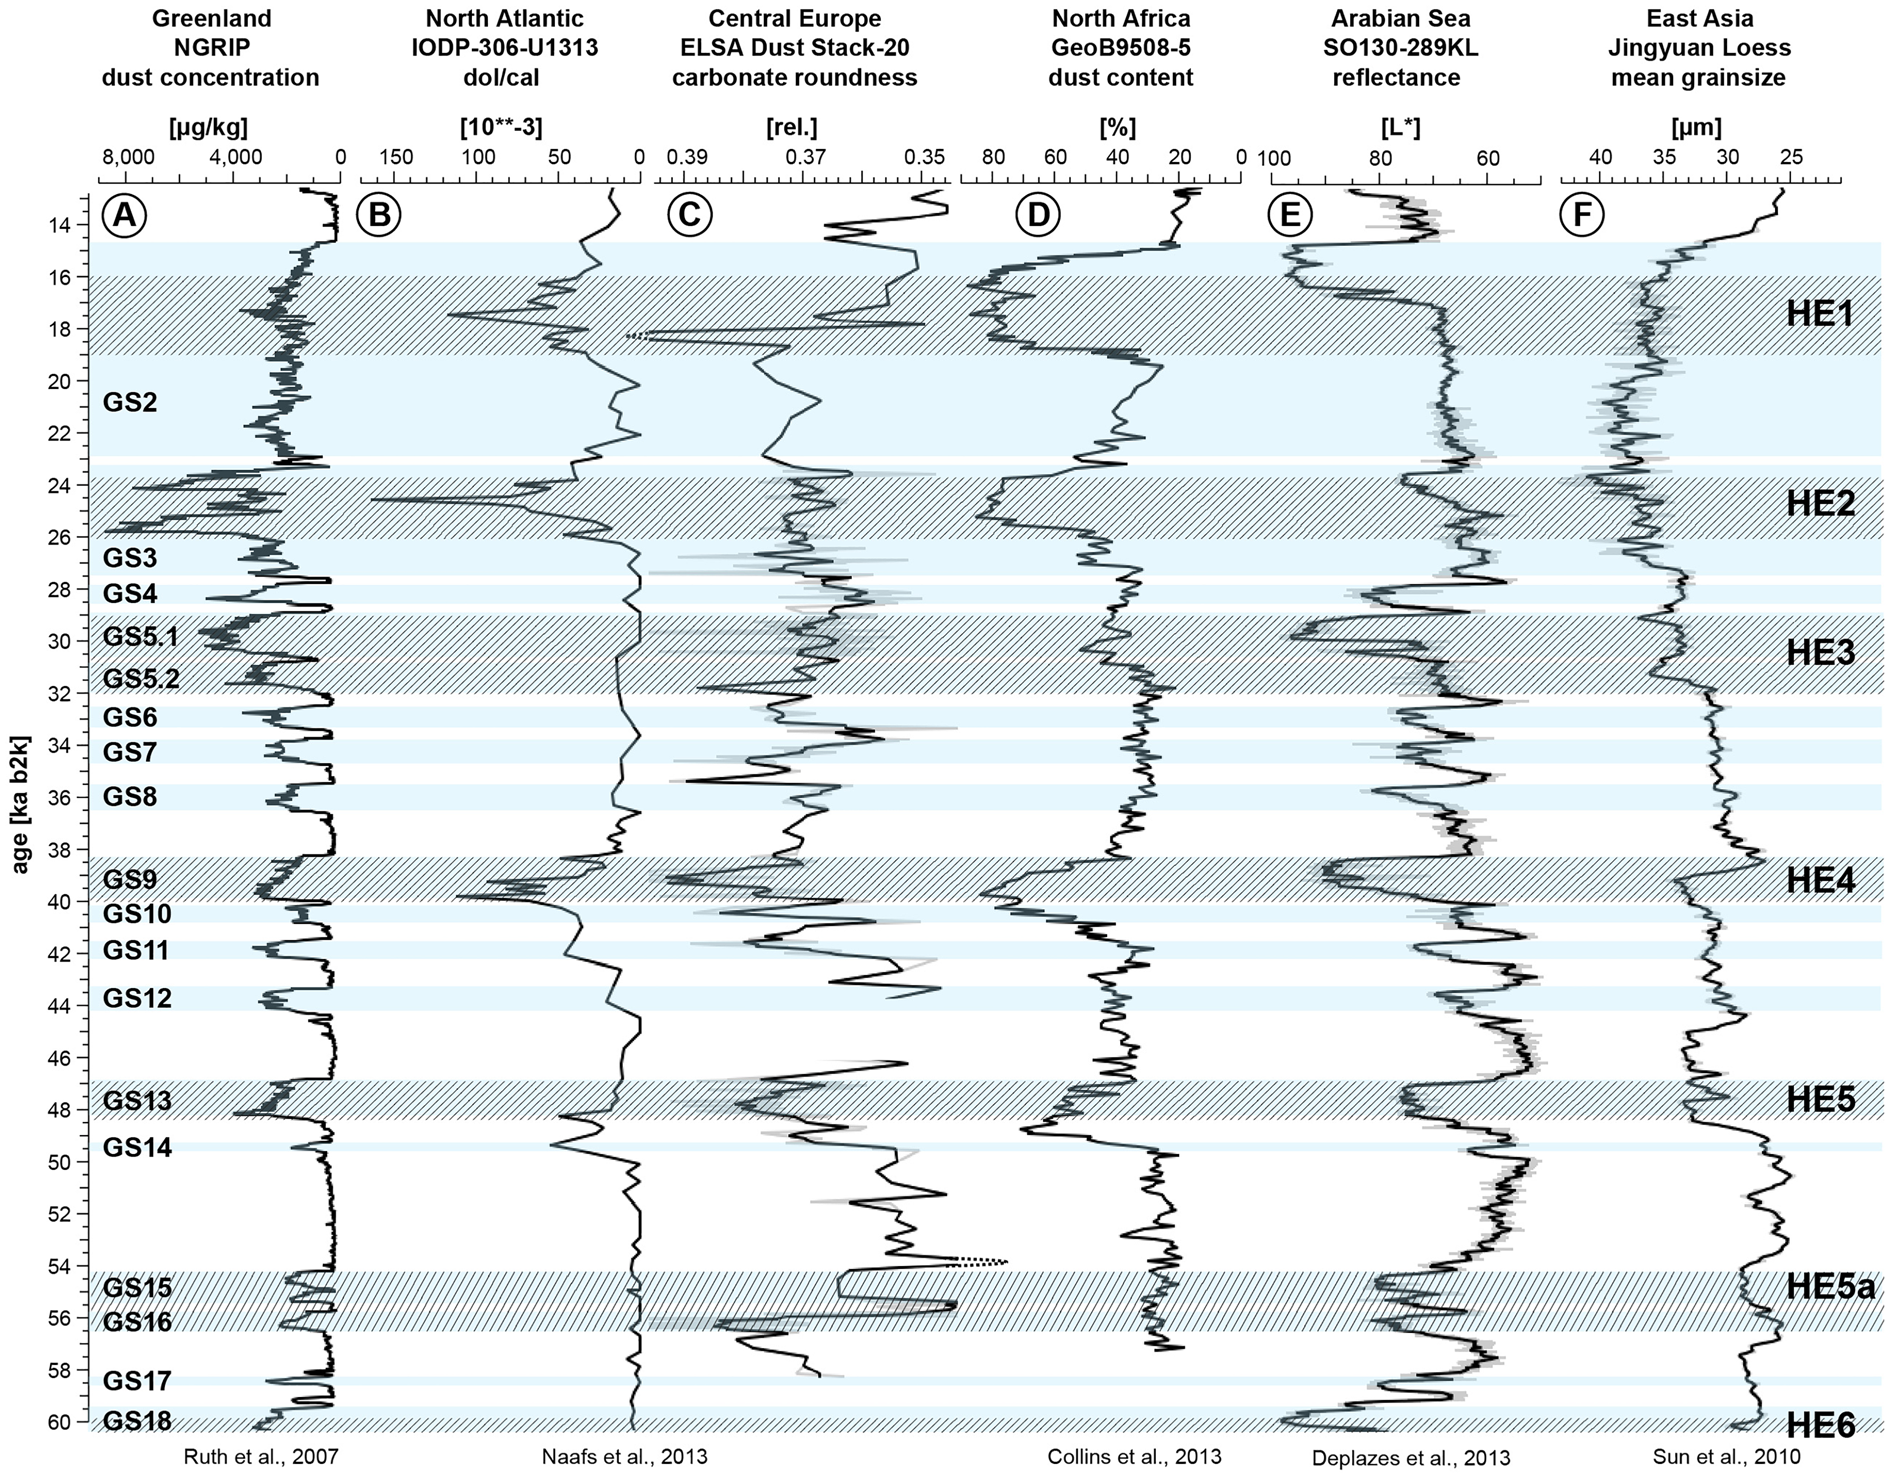
Figure 3E displays the ELSA Dust Stack (2009) by Seelos et al. (Reference Seelos, Sirocko and Dietrich2009). It shows basically all GI; only GI2 is hardly visible. HE5a, HE5, and HE3 are also visible. HE4 and HE2 can be guessed at, but HE1 is not apparent. While the GIs are identifiable, the GSs are not that easy to observe.
The ELSA Dust Stack-20 carbonate roundness (see Fig. 4C) is compared to the global dust time series, which show the Heinrich events as a dominant parameter. The records are displayed with growing distance to the North Atlantic. Figure 4A shows the NGRIP ice core; Figures 4B, 4D, and 4E represent marine archives; and Figures 4C and 4F show terrestrial records with defined Heinrich events.
Figure 4A shows the dust concentration of the NGRIP ice core (Ruth et al., Reference Ruth, Bigler, Röthlisberger, Siggaard-Andersen, Kipfstuhl, Goto-Azuma, Hansson, Johnsen, Lu and Steffensen2007), which reveals all GSs by an increase in dust concentration. The largest dust concentrations of the last 60 ka occur at the beginning of HE2 (~26 ka) and show a striking double peak. Figure 4B displays the dolomite/calcite ratio of the IODP-306-U1313 sediment core from the North Atlantic (Naafs et al., Reference Naafs, Hefter, Grützner and Stein2013). The ratio shows increased values during ice rafting debris deposition. HE1, HE2, HE4, and HE5 can be observed within this data set, but HE3, HE5a, and HE6 are not represented like the other Heinrich events are.
Figure 4C shows the carbonate roundness introduced in Figure 3C. Most stadials, and especially the Heinrich events parallel to GSs, are strongly expressed. Figure 4D shows an eolian dust record off the coast of Senegal (Mulitza et al., Reference Mulitza, Prange, Stuut, Zabel, Dobeneck, Itambi, Nizou, Schulz and Wefer2008; Collins et al., Reference Collins, Govin, Mulitza, Heslop, Zabel, Hartmann, Röhl and Wefer2013), where large amounts of Saharan dust were transported into the Atlantic. Particularly during the Heinrich events, large amounts of dust were deposited, and HE3 shows distinctly lower amounts than the other events. HE5a is not documented in this record.
The SO130-289KL sediment core (see Fig. 4E; Schulz, et al., Reference Schulz, von Rad, Erlenkeuser and von Rad1998; Deplazes et al., Reference Deplazes, Lückge, Peterson, Timmermann, Hamann, Hughen and Röhl2013) shows reflectance data, which is an established proxy for changes in sediment composition, for the northeastern Arabian Sea. It shows not only the Heinrich events but also the GIs.
A record of the mean grain size of the Jingyuan Loess Plateau in East Asia shows loess stadial/interstadial variability (see Fig. 4F; Sun et al., Reference Sun, Wang, Liu and Clemens2010). An increasing deposition of coarse grains is observed during the stadials of the NGRIP ice core. Heinrich events tend to be even more coarse grained within the record.
DISCUSSION
The carbonate grains deflated from the north and southwest cannot reach the maar because of topographic barriers (see Fig. 1). The carbonates located 4 km to the east could not have entered the maar, because to do so they would have had to saltate a few meters uphill and through a river valley. It is remarkable that two carbonate regions lay south of the maar, and both follow the Rhine strike direction (see Fig. 1). It can therefore be assumed that the two carbonate regions were connected during the Middle and Late Pleniglacial and are today covered by younger strata, probably glacial solifluction and Holocene colluvium. The area between the carbonates in the southwest and east of the map is higher than the Auel Maar, and thus saltating particles can easily reach the maar basin with winds from the southeast. Hence, we interpret this area (hatched in Fig. 1) as the region of origin of the carbonate grains, even though we could not find carbonate outcrops in the field today.
Well-rounded, dull eolian carbonate grains indicate stadials in the ELSA Dust Stack-20. The roundness shows increased values (0.39) during stadials compared to values during interstadials (0.37). Dust sedimentation was increased during the colder and drier intervals. These results match findings of previous studies, for example of Dietrich and Seelos (Reference Dietrich and Seelos2010), Sirocko and colleagues (Reference Sirocko, Dietrich, Veres, Grootes, Schaber-Mohr, Seelos and Nadeau2013), and others. As all samples were sieved to 63 μm, no far-transported grains remain within the samples.Therefore, and in accordance with the results of Dietrich and Seelos (Reference Dietrich and Seelos2010), carbonate grains were interpreted as having originated regionally. CaCO3 is interpreted to indicate easterly winds, not westerly, since no carbonate rocks can be found in the area directly west of the Auel Maar.
Between 60 and 32 ka (~ Middle Pleniglacial), CaCO3 values of the ELSA Dust Stack-20 range between 0% and 1.5% with higher values during the stadial phases. After the beginning of HE3 (~32 ka) a general change in the transport system around the Auel Maar is visible. This can be explained by the increased appearance of easterly winds in central Europe during this time (Gullentops et al., Reference Gullentops, Paulissen and Vandenberghe1981; Huijzer and Vandenberghe, Reference Huijzer and Vandenberghe1998; Dietrich and Seelos, Reference Dietrich and Seelos2010). During Heinrich events, easterly wind activities were increased, especially during HE2 and HE1. In the Dehner Maar cores (10 km west of Auel Maar), the content of dust within the sediments was about 75% between the beginning of HE3 and the end of HE2 (see Fig. 3E; Dietrich and Seelos, Reference Dietrich and Seelos2010). This corresponds to increased CaCO3 values during these time intervals within the ELSA Dust Stack-20. The main cause of these phenomena is assumed to be the significantly lower sea surface temperature in the North Atlantic with extended sea ice cover in addition to the increased size of the Laurentide Ice Sheet (Renssen et al., Reference Renssen, Kasse, Vandenberghe and Lorenz2007). The postulated system change with HE3 in the sediments of Auel Maar can also explain why HE2, which is the Heinrich event with the highest dust content in the NGRIP data, is not as equally pronounced in the central European ELSA Dust Stack-20 sediments.
The HE5a, HE5, HE4, and HE1 are visible in the carbonate roundness data, while HE3, HE2, and HE1are well developed in the CaCO3 data. ELSA Dust Stack (2009) and ELSA Dust Stack-20 are similar. While the 2009 Dust Stack mainly shows the GIs, the ELSA Dust Stack-20 mainly shows the GSs. The data of the ELSA Dust Stack-20 are from a single archive, the Auel Maar, while the 2009 Dust Stack contains cores from the Dehner Maar, Schalkenmehrener Maar, and Oberwinkler Maar from the last 60 ka. Therefore, stratigraphic inconsistencies are minimized in the ELSA Dust Stack-20 (see the Bayesian Age Model for the Auel cores; Sirocko et al., unpublished data).
Figure 4 shows that the Heinrich events were not limited to ice raft debris layers in the North Atlantic but had an impact on the continents as well. Climatic changes during the Heinrich events are found in marine and terrestrial sediments of the Northern Hemisphere and may also be seen globally (Muller et al., Reference Muller, Kylander, Wüst, Weiss, Martinez-Cortizas, LeGrande, Jennerjahn, Behling, Anderson and Jacobson2008).
CONCLUSIONS
We present a continuous terrestrial dust sediment record with most GSs and Heinrich events between 60 and 13 ka reconstructed from carbonate roundness of the ELSA Dust Stack-20 and CaCO3 data for central Europe. The record allows five main conclusions to be drawn: (1) Carbonate grain roundness is a useful proxy to detect saltating eolian fraction for Auel dry maar sediments, because eolian-transported grains are rounded and frosted. (2) Carbonate grain roundness data document HE5a to HE4 and HE1; however, HE3 to HE1 become visible only in the carbonate percent record. (3) The discussion of the possible deflation areas of the carbonate sand fraction suggest wind directions from the south and southeast. These match the results of the ELSA Dust Stack (2009), which revealed easterly wind directions for the silt fraction. (4) The sand fraction documents strong wind speeds, which were apparently most severe during the Heinrich events. (5) The ELSA Dust Stack-20 data show that climate extremes during Heinrich events are not limited to the oceans, but also dominate the terrestrial climate between 60 and 13 ka.
SUPPLEMENTARY MATERIAL
The supplementary material for this article can be found at https://doi.org/10.1017/qua.2020.81
ACKNOWLEDGMENTS
This work was supported by the Johannes Gutenberg University of Mainz and the Max-Planck Institute for Chemistry of Mainz. We strongly acknowledge Jef Vandenberghe, Dominik Faust, and an anonymous reviewer for the extensive and constructive reviews. We thank Johannes Albert and Sarah Britzius for discussions and help with the stratigraphic correlations; Philip Süßer, Jennifer Klose, Anastasia Zemlitskaya, Robert Deutsch, and Alexander Blum for sample preparation; Ignatius Perreira for the cartography work; and Petra Sigl for assistance with the figures.


 Open access