




Introduction
Urban agriculture has become popular as an alternative food system that increases environmental sustainability (Gunapala et al., Reference Gunapala, Gangahagedara, Wanasinghe, Samaraweera, Gamage, Rathnayaka, Hameed, Baki, Madhujith and Merah2025), economic stability, and food security (Clinton et al., Reference Clinton, Stuhlmacher, Miles, Uludere Aragon, Wagner, Georgescu, Herwig and Gong2018), as well as social well-being (Diekmann, Gray and Thai, Reference Diekmann, Gray and Thai2020) and justice (Siegner, Sowerwine and Acey, Reference Siegner, Sowerwine and Acey2018; Russ and Gaus, Reference Russ and Gaus2021). Urban agriculture has the potential to provide significant proportions of food needs in many regions (Siegner, Sowerwine and Acey, Reference Siegner, Sowerwine and Acey2018), including 31% of consumed vegetables in Detroit if biointensive growing methods are used (Colasanti and Hamm, Reference Colasanti and Hamm2010). Food security is also tangentially increased through the creation of a ‘commons’ fostered by urban agriculture which provides community, connections to nature, and education to participants (Siegner, Sowerwine and Acey, Reference Siegner, Sowerwine and Acey2018). Potential benefits of urban agriculture vary geographically and are dependent not only on supportive policy and urban planning (Siegner, Sowerwine and Acey, Reference Siegner, Sowerwine and Acey2018; Ballamingie et al., Reference Ballamingie, Blay-Palmer, Knezevic, Lacerda, Nimmo, Stahlbrand and Ayalon2020; Horst, McClintock and Hoey, Reference Horst, McClintock and Hoey2024), but, similar to conventional farms, rely on insect pollinators to meet production needs.
Urban farms and gardens grow a wide diversity of vegetables, fruits, flowers, and herbs, many of which depend on insect pollination to some degree (Klein et al., Reference Klein, Vaissière, Cane, Steffan-Dewenter, Cunningham, Kremen and Tscharntke2007). Popular crops like squash and melons require insect pollination to properly develop fruit (Free, Reference Free1993). However, crops like tomatoes, peppers, and strawberries can develop without pollinator visitation, but they are often larger and more abundant when pollinated by insects (Klein et al., Reference Klein, Vaissière, Cane, Steffan-Dewenter, Cunningham, Kremen and Tscharntke2007). Managed pollinators like European honey bees (Apis mellifera) are popular on urban farms for their pollination services. However, many cities restrict or prohibit maintaining hives in urban and suburban areas (Moriarty, Reference Moriarty2018). Wild insects like native bees, wasps, beetles, and flies are also important crop pollinators (Kevan and Baker, Reference Kevan and Baker1983) and can be valuable to commercial production for many crops grown on urban farms. Large, diverse communities of various insect groups increase yield for many crops like apple (Blitzer et al., Reference Blitzer, Gibbs, Park and Danforth2016), squash (Hoehn et al., Reference Hoehn, Tscharntke, Tylianakis and Steffan-Dewenter2008), and watermelon (Arachchige et al., Reference Arachchige, Evans, Campbell, Delaplane, Rice, Cutting, Kendall, Samnegård and Rader2023). Wild bees are often the most abundant pollinators of crops, like highbush blueberries in Michigan (Tuell, Ascher and Isaacs, Reference Tuell, Ascher and Isaacs2009), and the most effective, as is the case for apples in many regions (Garratt et al., Reference Garratt, Breeze, Boreux, Fountain, McKerchar, Webber, Coston, Jenner, Dean, Westbury, Biesmeijer and Potts2016; Pardo and Borges, Reference Pardo and Borges2020) and pumpkins in eastern North America (Artz and Nault, Reference Artz and Nault2011). Farm management methods utilized by urban farmers can promote the diversity and abundance of pollinator communities (Guenat et al., Reference Guenat, Kunin, Dougill and Dallimer2019).
Pollinator-supportive farm management methods can range from simply reducing insecticide applications, tillage, or mowing to establishing and preserving habitat enhancements that support wild pollinator nesting and foraging needs (Table 1). While these practices may be primarily used to support crop pollination, they can provide additional ecosystem services such as pest control, soil health, and weed management (Wratten et al., Reference Wratten, Gillespie, Decourtye, Mader and Desneux2012; Lundin et al., Reference Lundin, Rundlöf, Jonsson, Bommarco and Williams2021). Adding wildflower plantings to urban green spaces can support more diverse and complex pollinator communities (Poole et al., Reference Poole, Costa, Kaiser-Bunbury and Shaw2025). Higher plant richness generally is associated with more abundant and diverse pollinator communities (Ebeling et al., Reference Ebeling, Klein, Schumacher, Weisser and Tscharntke2008; Kral-O’Brien et al., Reference Kral-O’Brien, O’Brien, Hovick and Harmon2021). Increasing crop richness, specifically, has a positive effect on pollinator abundance and crop yields (Magrach et al., Reference Magrach, Giménez-García, Allen-Perkins, Garibaldi and Bartomeus2022; Sritongchuay et al., Reference Sritongchuay, Beckmann, Dalsgaard, Klein, Lausch, Nielsen, Osterman, Selsam, Wayo and Seppelt2026). However, the implementation of these strategies by urban growers can be influenced by various external factors and limitations.
Descriptions of commonly used and evidence-based on-farm pollinator management strategies

Table 1. Long description
The table has four columns labeled Practice, Description, Responses n, and percent. The first row lists Native flower plantings, described as maintaining areas of flowering plants endemic to the region for pollinators and wildlife, with 69 responses and 94 percent. The second row is Reduced pesticides, minimizing use of chemical or biological agents to control pests, with 69 responses and 90 percent. The third row is Added plant diversity, increasing the number of plant species grown, with 69 responses and 90 percent. The fourth row is Reduced mowing, decreasing the frequency of cutting low cover vegetation or allowing areas to remain undisturbed, with 69 responses and 80 percent. The fifth row is Reduced tillage, decreasing the intensity and frequency of soil disturbance, with 69 responses and 78 percent. The sixth row is Preserved unmanaged ‘wild’ areas, maintaining sections of land to host native flora and fauna and protecting from anthropogenic disturbance, with 68 responses and 72 percent. The seventh row is Cover cropping, growing plants between crop seasons to improve soil health and provide floral resources to pollinators, with 69 responses and 56 percent. The eighth row is Maintained patches of exposed soil, leaving bare ground for ground-nesting bees, with 69 responses and 48 percent. The table footnote explains that n and percent refer to the number and percentage of survey respondents using each practice, and not all respondents answered for every practice.
Note: The number (n) and percentage (%) of survey respondents who used each practice are noted. Not all respondents indicated whether they used each practice.
Implementing pollinator-supportive management strategies relies on input from urban stakeholders, but few studies have considered the external factors that impact the use of these strategies by growers (Hanes et al., Reference Hanes, Collum, Hoshide and Asare2013; Park et al., Reference Park, Joshi, Rajotte, Biddinger, Losey and Danforth2018; Nalepa et al., Reference Nalepa, Epstein, Pittman and Colla2020; Amon et al., Reference Amon, Quezada, Labarre and Guédot2023). These studies primarily focus on specific highly pollination-dependent cropping systems and inquire about various sociodemographic factors (i.e., perception, knowledge, demographics) in relation to pollinator management strategies. There has been a mixed response to whether grower perception correlates with pollinator management strategy implementation. Growers with increased awareness of wild bees, the threats to them and their associated benefits, have been associated with pollinator-friendly practice implementation (Nalepa et al., Reference Nalepa, Epstein, Pittman and Colla2020; Osterman et al., Reference Osterman, Landaverde-González, Garratt, Gee, Mandelik, Langowska, Miñarro, Cole, Eeraerts, Bevk, Avrech, Koltowski, Trujillo-Elisea, Paxton, Boreux, Seymour and Howlett2021). However, while some growers may understand threats to pollinators, this does not always translate into pollinator-supportive practices (Westlake, Reference Westlake2019; Hevia et al., Reference Hevia, García-Llorente, Martínez-Sastre, Palomo, García, Miñarro, Pérez-Marcos, Sanchez and González2021; Bloom et al., Reference Bloom, Bauer, Kaminski, Kaplan and Szendrei2021). Informational resources can also play an important role in the implementation of pollinator management (Garbach and Morgan, Reference Garbach and Morgan2017). These resources have been developed, primarily for rural and large-scale farmers, by a range of agricultural professionals from university extension systems, non-profit organizations, government agencies, and other farmer education and community groups through different mediums and formats. Due to unique constraints and growing conditions on urban farms such as limited land access, urban heat island effects, city ordinances, and other factors (Teoh, Wong and Mazumdar, Reference Teoh, Wong and Mazumdar2024), pollinator management and related education may need to be executed differently for urban growers.
We conducted a survey of urban growers to better understand factors that influence their decisions about pollinator management. Urban farming communities have been historically underserved and underrepresented in agricultural extension and outreach. Better understanding the drivers behind using pollinator management on these farms could potentially help agricultural educators and community groups reach a wider range of growers when developing programing. By understanding which resources growers are using, education and resource providers can create educational materials in formats preferred by urban growers. Thus, it is important to create pollinator management recommendations and educational information specific to this stakeholder group. In this study, we explored whether the following factors impact pollinator management strategy implementation and crop richness on urban farms: (1) grower demographics, (2) perception of pollinators and conservation, (3) motivation for farming and pollinator management, (4) resource use and accessibility, and (5) source of educational information.
Methods
Survey design
The primary objective of our survey was to identify and evaluate factors that informed pollinator management decisions initiated by urban growers. This included attempting to elucidate the relationship between the use of pollinator management methods and grower dependence on insect pollinators based on the crops they grow. Additionally, we aimed to investigate how decisions are impacted by grower demographics, perception of pollinators and conservation, motivation for urban farming and pollinator management, resource use and accessibility, and their source of educational information. A secondary objective was to evaluate pollinator educational resources used by growers to increase our understanding of their learning preferences and improve pedagogy.
To support our objectives, we developed a survey with 45 questions that were a mix of three-point Likert-style, multiple choice, true or false, and open response (Supplementary Table S1). The survey was made available in English and Spanish and was designed to be completed in approximately 10 minutes. No questions were required; therefore, participants could refrain from answering at their discretion. Questions were divided into four parts: farm/garden description, farm management, pollinator knowledge and resource accessibility, and participant demographics. Responses throughout these sections were used to determine crops grown and pollinator management strategies implemented by growers. They also informed our predictor variables, which fell within five major categories: demographics, perception, motivation, resource use and accessibility, and source of information.
Demographics
Studies have shown that grower demographics can impact the implementation of pollinator management strategies on farms (Hevia et al., Reference Hevia, García-Llorente, Martínez-Sastre, Palomo, García, Miñarro, Pérez-Marcos, Sanchez and González2021). Since grower demographics can influence the types of crops grown (Philpott et al., Reference Philpott, Egerer, Bichier, Cohen, Cohen, Liere, Jha and Lin2020), we inquired about the following grower demographics: age, gender identity, highest level of education, years of agricultural experience, and the percentage of overall income from farming. Age, gender identity, highest level of education, and percentage of overall income from farm were formatted as multiple-choices, while years of agricultural experience was open-response. We also included a multiple-choice for respondents to indicate whether their farm location was urban, suburban, or rural.
Perception
To understand how grower perception—or the knowledge and beliefs associated with pollinators and their management—influences the use of pollinator management strategies, we inquired about their limitations for implementation using a three-point Likert-scale (Supplementary Table S1). We also included true or false questions to inquire about each respondents’ pollinator knowledge. These true or false questions tested grower perception of common beliefs regarding pollinators and their management.
Motivation
Based on previously found motivations for engagement in urban agriculture (McDougall, Kristiansen and Rader, Reference McDougall, Kristiansen and Rader2019), we asked respondents to indicate motivations for urban farming and gardening on a three-point Likert-scale consisting of the following statements: access to fresh and healthy foods, access to culturally appropriate foods, supplementing the food supply for self and household, environmental sustainability, the ability to provide food to the community, enhance social bonding within the community, and additional income (Supplementary Table S1).
Resource use and accessibility
Access to grower information and resources, or resource use and accessibility, can either limit or increase farmers’ capacity for pollinator management. Additionally, numerous urban farmers have experienced limitations when attempting to implement pollinator management strategies. To further understand this, we inquired about the following limitations using a three-point Likert-scale: financial investment, manual labor, city regulations, and access to plant resources.
Source of educational information
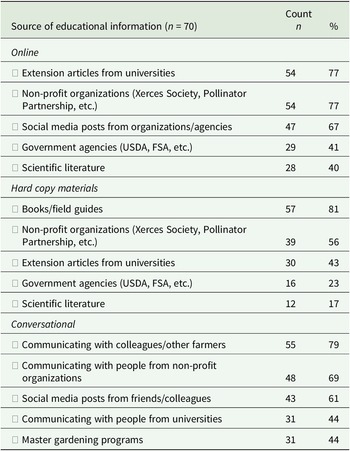
In this part of the survey, we asked respondents to select any of their preferred educational, pollinator sources from a list of online, hard copy, and in-person materials (Table 2 and Supplementary Table S1).
Sources of educational information that respondents reported using

Table 2. Long description
The table is divided into three main sections. The first section, Online, includes Extension articles from universities with 54 respondents (77 percent), Non-profit organizations such as Xerces Society and Pollinator Partnership with 54 (77 percent), Social media posts from organizations or agencies with 47 (67 percent), Government agencies like U S D A and F S A with 29 (41 percent), and Scientific literature with 28 (40 percent). The second section, Hard copy materials, lists Books or field guides with 57 (81 percent), Non-profit organizations with 39 (56 percent), Extension articles from universities with 30 (43 percent), Government agencies with 16 (23 percent), and Scientific literature with 12 (17 percent). The third section, Conversational, includes Communicating with colleagues or other farmers with 55 (79 percent), Communicating with people from non-profit organizations with 48 (69 percent), Social media posts from friends or colleagues with 43 (61 percent), Communicating with people from universities with 31 (44 percent), and Master gardening programs with 31 (44 percent). The note clarifies that respondents could select multiple sources and not all indicated which sources they used.
Note: Various formats of resources (online, hard copy materials, conversational) were provided. The number (n) and percentage (%) of survey respondents who used each source are noted. Not all respondents indicated which sources of educational information they used.
Pollinator management strategies
We evaluated the implementation (presence/absence) of eight common farm practices that positively influence pollinator abundance and diversity (Table 1 and Supplementary Table S1). These practices were selected because they provide resources for pollinators while requiring minimal financial or material investment. To avoid bias, pollinator management strategies were referred to as farm management methods in the survey. For each pollinator management strategy, participants were asked about their primary reason for implementation, with the following options: soil health, pest control, pollinator management, weed control, environmental impact, and ‘I don’t use this method’.
Crop richness and pollinator dependency
An estimate of farm crop richness was gathered by having respondents select the crops they grow out of a list of 21 common fruits and vegetables. These crops ranged in their pollinator dependency, which was used to categorize them into two groups. The highly pollinator dependent group included crops that pollinators are essential to (melons, summer squashes, winter squashes) or highly important for (cucumbers, apples, blueberries, cherries, peaches, plums, pears, raspberries, and blackberries) and the minimally pollinator dependent group contained crops with modest to no dependence (strawberries, currants, gooseberries, eggplants, broad-beans, sunflowers, tomatoes, peppers, and snap peas; Klein et al., Reference Klein, Vaissière, Cane, Steffan-Dewenter, Cunningham, Kremen and Tscharntke2007).
The proportion of high-pollinator-dependent crops grown was used to estimate the level of importance pollinators had for growers. We used this to classify growers into two groups: high and low pollinator importance. In the high importance group, 50% or more of the crops grown were highly dependent on pollinators (n = 26). In the low importance group, less than 50% of crops grown were highly dependent on pollinators (n = 46).
Data collection
Our survey was disseminated both online through Qualtrics (Qualtrics, Provo, UT) and in-person at various events from August to October, 2024. The survey was open to anyone in the United States (USA), but mostly circulated throughout Michigan, USA. Online distribution included social media posts, direct emails, various grower newsletters, university extension communications, Master Gardener Program leaders, and a post-webinar announcement. Hard copy versions and QR codes to the digital survey were made available at a ‘Pollinators in urban agriculture’ field day, the National Urban Agriculture Conference, a local farmers market, and at numerous events with the Greater Lansing Food Bank’s Garden Project.
Growers were incentivized to complete the survey by providing entry into a post-survey raffle to receive a $100 gift card. A QR code and link to the raffle appeared after growers submitted their responses to the digital survey, and it was also located on the last page of the paper survey. The winner was drawn one day after the survey was closed.
Data analysis
We received 126 initial survey responses, which were analyzed using R studio version 2024.12.1+563 (Posit Team, 2025). Surveys with response time less than 4 minutes were removed from analysis (n = 38). Surveys from non-urban growers (n = 10), surveys without any responses, or that were duplicate entries were also removed from the analysis (n = 4). After excluding these surveys, 74 were used in our analyses.
We used generalized linear models to investigate the correlation between the implementation of pollinator management strategies and grower pollinator dependency level. We also created generalized linear models to determine how implementation of pollinator management strategies and crop richness were influenced by the following predictor variable categories: grower demographics, perceptions, motivation, resource use and accessibility, and source of educational information. This was done by using a model selection process. We created separate global models for each of the five predictor variable categories for both pollinator management strategy implementation and crop richness as response variables (Supplementary Tables S2–S11). For grower motivation, ‘reasons for using various farm management methods’ was included only for crop richness as a response variable to avoid collinearity in the pollinator management implementation model. With crop richness models, we used three different response variables: total overall crop richness, total number of highly pollinator-dependent crops, and total number of low pollinator-dependent crops. We then used the ‘dredge’ function in the ‘MuMIn’ package (Bartoń, Reference Bartoń2025) to select the top model for each predictor variable category. Based on these results, we included the most important variables in our statistical models.
Using our model-selected variables, we created unique generalized linear models for each category for both response variables with the ‘glm’ function. Shapiro–Wilk tests were used to check whether the data were normally distributed. Gaussian error distributions were used for continuous response variables (crop richness) and binomial error distributions for dichotomous response variables (use of pollinator management strategies). We ran an analysis of variance modeling using the ‘Anova’ function with the ‘car’ package (Fox and Weisberg, Reference Fox and Weisberg2019). If significant differences were found (p < 0.05), we followed with a means comparison (package = ‘emmeans’; Lenth et al., Reference Lenth, Piaskowski, Banfai, Bolker, Buerkner, Giné-Vázquez, Hervé, Jung, Love, Miguez, Riebl and Singmann2025) to determine pairwise differences between predictor variables.
We also ran an analysis of variance to compare the overall effects of our five predictor variable categories on the implementation of pollinator management strategies. We created model averages from the five global models: demographic (N = 16), motivation (N = 64), resource use and accessibility (N = 128), perception (N = 1,024), and source of educational information (N = 16,384). We then extracted the model averaged sum of weights for all variables for each management strategy. Next, we added the model averaged sum of weights for all predictor variables within a category together for each management method. We then frequency corrected these coefficients by dividing them by the number of variables in the predictor category they were from. We used the ‘Anova’ function to determine differences in the frequency-corrected coefficients across categories.
Results
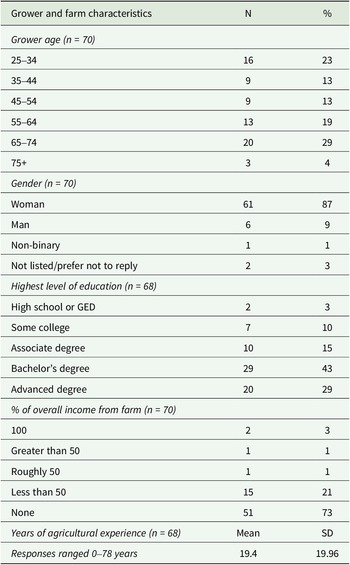
In the 74 surveys included in analyses, grower age ranged from 25 to 75+, with 51% of the respondents 55 or older. Of the remaining respondents, 23% were ages 25–34. Years of agricultural experience also varied widely between 0 and 78 (19.4 ± 19.96, mean ± standard deviation). Gender and education level were heavily skewed toward women (87%) and at least some college experience (96%). The majority of survey respondents (72%) had a bachelor’s degree or some form of advanced degree. Similarly, percentage of overall income from farm was heavily skewed as the majority of growers (94%) made less than half of their incomes from their farms, and most growers (73%) reported none of their income came from their farm (Table 3).
Grower and farm demographic characteristics from survey respondents

Table 3. Long description
The table is organized into five main sections. The first section, Grower age (n equals 70), lists age groups with counts and percentages: 25 to 34 years, 16 respondents, 23 percent; 35 to 44, 9, 13 percent; 45 to 54, 9, 13 percent; 55 to 64, 13, 19 percent; 65 to 74, 20, 29 percent; 75 and older, 3, 4 percent. The second section, Gender (n equals 70), includes Woman, 61, 87 percent; Man, 6, 9 percent; Non-binary, 1, 1 percent; Not listed or prefer not to reply, 2, 3 percent. The third section, Highest level of education (n equals 68), lists High school or G E D, 2, 3 percent; Some college, 7, 10 percent; Associate degree, 10, 15 percent; Bachelor’s degree, 29, 43 percent; Advanced degree, 20, 29 percent. The fourth section, Percent of overall income from farm (n equals 70), includes 100 percent, 2, 3 percent; Greater than 50 percent, 1, 1 percent; Roughly 50 percent, 1, 1 percent; Less than 50 percent, 15, 21 percent; None, 51, 73 percent. The final section, Years of agricultural experience (n equals 68), shows a mean of 19.4 years and standard deviation of 19.96, with responses ranging from 0 to 78 years.
Note: The number (n) and percentage (%) of survey respondents for each characteristic (grower age, gender, highest level of education, percentage of overall income from farm, and years of agricultural experience) are noted. Not all respondents indicated grower and farm characteristics.
When evaluating preferred sources of educational information from our limited survey options, the most popular were hard copy books and field guides. Conversations with colleagues/other farmers were the second most popular source of information of those listed in our survey and the most used conversational source. Online extension articles from universities and online non-profit organization resources were also popular, and both were used by more growers than their hard-copy counterparts (Table 2).
Pollinator management strategies
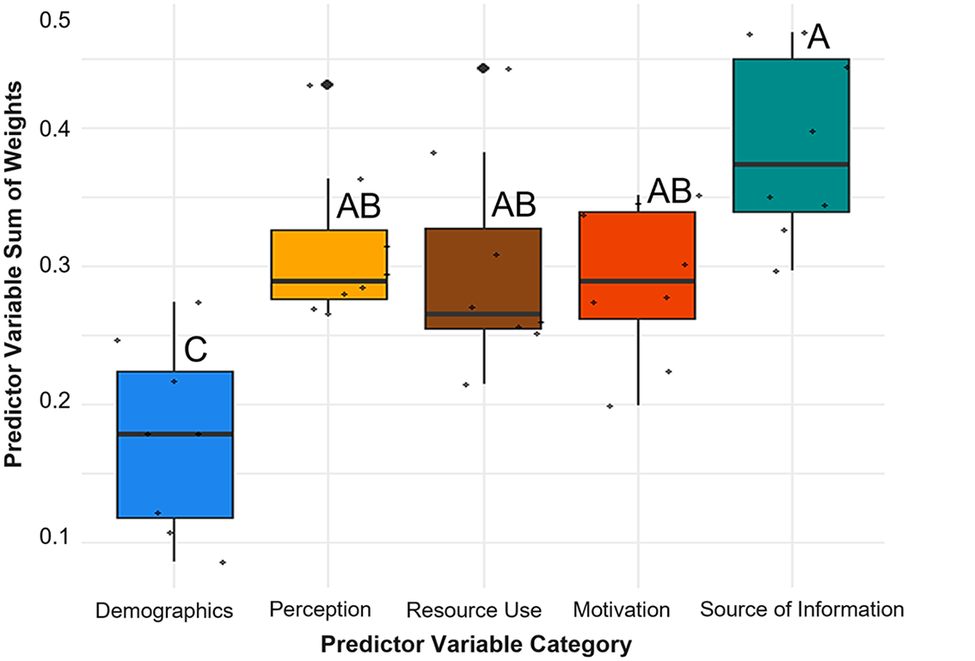
Implementation of the evaluated eight pollinator management strategies was influenced variously by our tested variables. Pollinator importance to growers (high vs. low) did not impact the incorporation of any of the management strategies (p > 0.1 for all models). Instead, grower decisions were influenced most by source of information, resource use and accessibility, perception, and motivation (Fig. 1). All four categories had significantly greater impacts on decision making than demographic variables (Fig. 1; perception: estimate = −0.14, SE = 0.03, t = −4.17, p = 0.002; resource use and accessibility: estimate = −0.12, SE = 0.03, t = −3.73, p = 0.006; motivation: estimate = −0.11, SE = 0.03, t = −3.4, p = 0.01; and source of information: estimate = −0.21, SE = 0.03, t = −6.44, p < 0.0001). Source of information was significantly greater than motivation (Fig. 1; estimate = 0.10, SE = 0.03, t = 3.0, p = 0.04) but not perception (Fig. 1; estimate = 0.07, SE = 0.03, t = 2.3, p = 0.18) or resource use and accessibility (Fig. 1; estimate = 0.09, SE = 0.03, t = 2.7, p = 0.07). There were also no differences between resource use and accessibility and perception (Fig. 1; estimate = −0.01, SE = 0.03, t = −0.4, p = 0.9) or motivation (Fig. 1; estimate = 0.01, SE = 0.03, t = −0.3, p = 0.99). The proportion of variables selected from each category in pollinator management implementation models further demonstrates the marginal impact of demographics.
Box plot of the predictor variable sum of weights totaled for the eight pollinator management strategies across the five predictor variable categories (demographics, perception, resource use, motivation, and source of information). The sum of weight values was extracted from the strategy implementation model averages (demographics N = 16, perception N = 1,024, resource use N = 128, motivation N = 64, source of information N = 16,384), pooled by pollinator management strategy, then frequency corrected by the number of variables within each category (demographics N = 5, perception N = 7, resource use N = 8, motivation N = 7, source of information N = 15). Each dot represents the pooled sum of weights of all predictor variables within a category for a specific pollinator management strategy. Lower and upper hinges are the 25th and 75th percentiles, and the median across pollinator management strategies is represented by the black line in between.

Figure 1. Long description
The chart is a horizontal box plot with five colored boxes, each representing a predictor variable category: Demographics (blue, leftmost), Perception (yellow), Resource Use (brown), Motivation (orange), and Source of Information (teal, rightmost). The x axis is labeled Predictor Variable Category, and the y axis is labeled Predictor Variable Sum of Weights, ranging from 0 to 0.5. Each box contains black dots representing pooled sum of weights for each pollinator management strategy. The median is shown as a thick black line inside each box. Demographics has the lowest median and is labeled C above the box. Perception, Resource Use, and Motivation have similar medians, labeled AB. Source of Information has the highest median and is labeled A. Outliers are shown as individual points above and below the boxes. The boxes show interquartile ranges, with whiskers extending to the minimum and maximum values within 1.5 times the interquartile range. The distribution shows that Source of Information variables contribute the most to the sum of weights, while Demographics contribute the least.
Only 60% (3/5) of demographic variables were selected in pollinator management implementation models compared to 73% (8/11) for perception, 86% (6/7) for motivation, 88% (7/8) for resource use and accessibility, and 93% (14/15) for source of information. Further, source of information variables were relevant to the implementation of all eight management methods, while demographic variables were only relevant to four methods (Supplementary Table S2). Across these categories, 11 specific variables significantly altered management decisions for one or more methods.
Five out of the 11 surveyed variables that impacted grower decisions were related to source of educational information. Hard copy books and online extension articles both positively impacted implementation of two pollinator management strategies. Growers who used books were more likely to cover crop (estimate = 1.78, SE = 0.8, z = 2.2, p = 0.03) and maintain patches of exposed soil (estimate = 1.72, SE = 0.8, z = 2.1, p = 0.04), while those who used online extension articles were more likely to preserve unmanaged areas (estimate = 2.23, SE = 0.8, z = 2.6, p = 0.008) and use reduced tillage practices (estimate = 4.8, SE = 1.8, z = 2.7, p = 0.008). In contrast, growers who used hard copy extension materials were less likely to perform reduced tillage (estimate = −4.8, SE = 1.8, z = −2.7, p = 0.008). The same pattern was true for materials from non-profit organizations, as growers that used online sources were more likely to implement reduced tillage than those who did not (estimate = 3.11, SE = 1.36, z = 2.3, p = 0.02), while the use of hard copy materials made growers less likely to use this method (estimate = −2.51, SE = 1.19, z = 2.1, p = 0.04). The predictor variable category with the second greatest number of influential variables was resource use and accessibility.
Three factors, the use of educational resources to inform farm management practices, city policies, and manual labor, each impacted decision-making. Growers who used educational resources to inform management practices, rather than being neutral about these materials, were more likely to have preserved unmanaged areas (estimate = 3.15, SE = 1.32, z = 2.4, p = 0.04). Maintaining patches of exposed soil was more common with growers who did not feel limited by city policies and regulations compared to those who felt limited (estimate = 2.48, SE = 0.87, z = 2.86, p = 0.012). Lastly, growers who felt limited by manual labor were more likely to implement cover cropping than those who felt neutral about this (estimate = 1.80, SE = 0.74, z = 2.43, p = 0.04). One significant variable pertains to each of the remaining predictor variable categories, grower demographics, their motivation for urban farming, and their perceptions.
Both demographics and motivation impacted cover cropping. This method was implemented more by growers who made less than 50% of their income from their farm compared to those with no farm income (estimate = 3.04, SE = 1.08, z = 2.81, p = 0.04) and by those who agreed, rather than disagreed, with being motivated to farm by additional income (estimate = 2.2, SE = 0.9, z = 2.6, p = 0.03). Growers who perceived native bees as capable of providing sufficient crop pollination were more likely to reduce mowing than those who did not (estimate = 1.66, SE = 0.74, z = 2.2, p = 0.03)
Crop richness
Total crop richness was influenced by resource use, accessibility, and the source of educational information used by growers. Resource use and accessibility, specifically limitations by city policies and regulations, had an influence on total crop richness (χ2 = 7.04, df = 2, p = 0.03). Growers who agreed that their ability to use pollinator management methods on their farm was limited by city policies and regulations had higher crop richness than growers who disagreed (estimate = 3.39, SE = 1.31, t = 2.59, p = 0.036). Multiple sources of educational information influenced crop richness, including hard copy extension articles (χ2 = 11.47, df = 1, p = 0.0007) and master gardening programs (χ2 = 4.82, df = 1, p = 0.03). Specifically, growers who did not use hard copy extension articles had higher crop richness than those who did (estimate = −3.37, SE = 0.96, t = −3.39, p = 0.001). Growers who participated in master gardening programs had higher crop richness than those who did not (estimate = 2.18, SE = 0.99, t = 2.2, p = 0.03). Grower demographics and perceptions did not influence total crop richness.
The number of highly pollinator-dependent crops grown was impacted by the source of educational information. Similarly to total crop richness, growers who did not use hard copy extension articles had a higher number of highly pollinator-dependent plants than those who did (estimate = −1.69, SE = 0.68, t = 2.48, p = 0.016). Growers who used information from master gardener programs had a higher number of highly pollinator-dependent crops than those who did not (estimate = 2.02, SE = 0.71, t = 2.86, p = 0.006). Grower demographics, motivation, and resource use and accessibility did not influence the total number of high-pollinator-dependent crops grown.
Resource use and accessibility and the source of educational information also had an impact on the number of low-pollinator-dependent crops grown. Limitations by city policies and regulations had an impact on the number of low-pollinator dependent crops grown (χ2 = 6.21, df = 2, p = 0.045). Growers who agreed that their ability to use pollinator management methods on their farm was limited by city policies and regulations had higher numbers of low-pollinator dependent crops than growers who disagreed (estimate = 1.44, SE = 0.59, t = 2.44, p = 0.046). Growers who did not use hard copy scientific literature (estimate = −1.93, SE = 0.55, t = 3.5, p = 0.001) or hard copy extension articles (estimate = −1.2, SE = 0.42, t = 3.54, p = 0.006) had a higher number of low pollination dependent crops than those who did. Additionally, growers who communicated with colleagues or other farms about pollination management (estimate = 1.17, SE = 0.52, t = 2.2, p = 0.03) had a higher number of low-pollination-dependent crops than those who did not. Grower demographics, perceptions, and motivations did not impact the total number of low pollination-dependent crops grown.
Discussion
Our findings demonstrate that certain farm and grower factors can impact pollinator management decisions by urban growers. Sources of educational information and resource accessibility used by growers had the greatest impact on pollinator management strategy implementation and crop richness. In contrast, demographic factors we tested (age, gender, income from farming, education, and years of agricultural experience) had no influence on grower decisions. This contradicts previous studies that found a strong influence of farmer demographics, particularly gender, which was heavily skewed female in our study, on plant richness (Philpott et al., Reference Philpott, Egerer, Bichier, Cohen, Cohen, Liere, Jha and Lin2020. Aside from sociological factors, we also found that growers do not currently make management decisions based on the importance of pollinators for the yield of crops that they grow.
Our findings indicated that grower decision-making was not correlated with the importance of pollinators for crop yield. This implies a disconnect in pollinator management for growers of heavily pollinator-dependent crops (Sawe, Nielsen and Eldegard, Reference Sawe, Nielsen and Eldegard2020; Bloom et al., Reference Bloom, Bauer, Kaminski, Kaplan and Szendrei2021). The marginal influence of grower perception on management complements this. Although grower perceptions of pollinator conservation and crop pollination were relevant to most management implementation models (Supplementary Table S3), only one out of the 11 perceptions impacted a decision. None impacted crop richness, which also promotes pollinators (Magrach et al., Reference Magrach, Giménez-García, Allen-Perkins, Garibaldi and Bartomeus2022; Sritongchuay et al., Reference Sritongchuay, Beckmann, Dalsgaard, Klein, Lausch, Nielsen, Osterman, Selsam, Wayo and Seppelt2026). Grower perceptions of pollinator conservation have not aligned with management decisions in previous studies either (Westlake, Reference Westlake2019; Hevia et al., Reference Hevia, García-Llorente, Martínez-Sastre, Palomo, García, Miñarro, Pérez-Marcos, Sanchez and González2021; Bloom et al., Reference Bloom, Bauer, Kaminski, Kaplan and Szendrei2021). In this study, however, growers who perceived that native bees could provide sufficient crop pollination were more likely to reduce mowing practices. The conservation benefits of reduced mowing to pollinators have been well demonstrated within academic (Buri et al., Reference Buri, Humbert and Arlettaz2014; Halbritter et al., Reference Halbritter, Daniels, Whitaker and Huang2015; Hemmings, Elton and Grange, Reference Hemmings, Elton and Grange2022) and non-academic literature (i.e., non-profit and community organizations). This suggests that educational materials and social campaigns on conservation practice use could influence grower management practices. It is unclear whether our survey findings accurately represent grower perceptions of the importance of insect pollinators for crop pollination or whether other factors simply outweigh this understanding when making management decisions. However, our results have identified the source of educational information to be the most impactful variable on grower decisions. Therefore, creating accessible educational resources that guide management and convey the connections between pollinator conservation and crop yield could help better incentivize on-farm pollinator management.
Understanding the substantial influence educational resources have on management decisions gives agricultural educators the opportunity to improve their programs. Various sources of educational information have improved grower pollinator knowledge (Tarakini, Chemura and Musundire, Reference Tarakini, Chemura and Musundire2020). In our survey, growers primarily utilized hard copy books as educational resources. Growers who used books were more likely to use cover cropping and maintain patches of exposed soil on their farms. While there are numerous published pollinator management books, most of these books have a focus on honey bees or general conservation and only a few focus on crop pollination by wild pollinators. Developing guides for the specific needs of pollinator management on urban farms in different geographic regions would be especially helpful (Roedel et al. Reference Roedel, Thomas, Miller and Szendrei2025). Our survey findings also suggested that growers felt their access to educational literature was financially limited, a common challenge for many urban growers (Teoh, Wong and Mazumdar, Reference Teoh, Wong and Mazumdar2024). Allocating additional funding and labor to develop these books could improve accessibility to crop pollination education for urban growers. Educators should consider disseminating information through non-traditional mediums that are more widely fiscally accessible, such as social media posts and grower-targeted newsletter emails. These efforts would complement the popularity of online resources among growers surveyed in this study.
Two of the most popular sources of educational information were online extension articles from universities and online non-profit organization resources. Both were used more frequently than their hard-copy counterparts, suggesting an increased accessibility or preference for online materials. We also found evidence that growers who used hard copy educational materials, such as extension articles and non-profit organization materials, were less likely to use pollinator management strategies like reduced tillage. This could be due to shorter, less comprehensive educational materials not including enough detail for growers to fully understand the associated benefits and effectively incorporate practices. When growers use these materials online, they may be able to access Supplementary Material more easily to deepen their understanding. Our survey did not inquire about the specific resources (titles, authors) accessed by growers, which would have allowed us to identify particularly impactful sources of information and evaluate differences between them. Future work investigating quality of specific educational resources would be highly informative.
Conversations between other growers when making pollinator management decisions were also popular. Farmers often prefer learning in a social and collaborative setting, which can even lead to increased implementation of sustainable practices (Garbach and Morgan, Reference Garbach and Morgan2017; Laforge and McLachlan, Reference Laforge and McLachlan2018; Cooreman et al., Reference Cooreman, Debruyne, Vandenabeele and Marchand2021). Creating community spaces with growers and agricultural educators could allow for more effective learning and increased adoption of pollinator management strategies (Hashemi et al., Reference Hashemi, Mokhtarnia, Erbaugh and Asadi2008). In fact, we found that urban growers who participated in Master Gardener programs had higher crop richness, specifically with more highly pollinator-dependent crops grown on their farms. Offering similar programs to urban growers in an accessible way could foster and improve communal learning related to sustainable pollinator management. This requires urban planning that is supportive of long-term agricultural and community development from a food justice lens (Horst, McClintock and Hoey, Reference Horst, McClintock and Hoey2024) and city policies that do not impede urban food production.
Feeling limited by city policies and regulations influenced both pollination management strategy implementation and crop richness on farms. Specifically, growers were more likely to maintain patches of exposed soil, an important practice for conserving wild bees, when they did not feel limited by these ordinances. While urban agriculture has greatly increased in many cities, many city ordinances have not reflected this change in urban land use. For example, numerous urban growers have shared experiences of being fined for growing native plants and utilizing other pollinator-supportive practices. While some cities are incorporating pollinator-friendly management into their legislation (Detroit MI Code Ordinance, 2019), law enforcers are not readily trained on these new changes. As a result, many urban growers have expressed reluctance and little motivation in using these pollinator habitat practices.
Overall, motivation for urban farming also had a moderate impact on grower decisions. Although different grower motivations were influential for many choices (Supplementary Table S5), ultimately, only additional income influenced a singular management strategy-cover cropping. This may be a reflection of growers’ impressions of the long-term economic returns of cover cropping, despite the economic losses generally associated with this (Zhang et al., Reference Zhang, Che, Rejesus, Cavigelli, White, Aglasan, Knight, Dell, Hollinger, Lane and Mirsky2024). It is also possible that growers motivated by additional income are utilizing subsidies for cover cropping (Myers, Weber and Tellatin, Reference Myers, Weber and Tellatin2019), explaining the increased rate for this group. This illuminates a gap in our study, as we did not evaluate the financial support avenues, like grants and subsidies, that respondents utilized. Grower motivations did not influence crop richness, contrary to previous work surveying urban growers in California (Philpott et al., Reference Philpott, Egerer, Bichier, Cohen, Cohen, Liere, Jha and Lin2020). This is possibly representative of regional differences or because we provided limited options for motivation with a three-point Likert scale for each. Because of this, we are unable to identify the primary motivating factor growers have for farming in this study, which could have revealed the cascading effects on overall farm management reported elsewhere (Pearsall et al., Reference Pearsall, Gachuz, Rodriguez sosa, Schmook, Wal and Gracia2017; Philpott et al., Reference Philpott, Egerer, Bichier, Cohen, Cohen, Liere, Jha and Lin2020). Future studies should evaluate additional motivations and utilize other surveying methods such as interviews.
Conclusion
Each management decision, including the eight pollinator management strategies and level of crop richness, was influenced differently by the various factors evaluated here. This suggests that the factors relevant to decision-making are context dependent. Our results reveal the decision-making paradigm that urban growers operate in, where their source of educational information, access to farm and educational resources, perception of pollinator conservation and crop pollination, and motivations for urban farming non-uniformly impact the various choices they face. Extension staff and other educators should strongly consider this when developing materials and programs intended to guide growers toward a desired outcome by addressing the most limiting factors on a case-by-case basis. This study reveals the importance of adequate and accessible resources and educational information to encourage the use of pollinator management strategies by urban growers. Enhancing urban grower awareness of the importance of the connection between insect pollinators and crop yield could improve long-term adoption of pollinator management practices to create more sustainable urban food systems.
Supplementary material
The supplementary material for this article can be found at http://doi.org/10.1017/S1742170526100453.
Acknowledgments
We thank the farmers who took the time to respond to our survey. We also thank our collaborators from Michigan State University and Xerces Society for Invertebrate Conservation who assisted with distributing these surveys.
Author contribution
J.R., K.T., and Z.S. designed the research. J.R. and Z.S. secured funding. J.R. and K.T. designed and distributed surveys, analyzed the data, and wrote the manuscript. All authors read, edited, and approved the manuscript.
Funding statement
This work was supported by North Central Region Sustainable Agriculture Research and Education (NCR-SARE) Grant (LNC23-489).
Competing interests
The authors declare none.
Ethics statement
Survey approval was granted by the Michigan State University Institutional Review Board (IRB, STUDY00010943 under Exemption 2018 (2)(i)).



 Open access

