


Introduction
Digital advertising has become an increasingly important part of electoral politics in the United States and generates growing revenue streams for platforms. In the 2020 U.S. election cycle, for instance, approximately 18% of all political ads spending went to digital ads ($ 1.6 billion), a dramatic increase from 2 to 3% in the 2016 cycle (Homonoff, Reference Homonoff2020). Unsurprisingly, this change has come with calls for greater regulation. This would place digital media on a more even footing with broadcast media, where political ads have long been subject to specific rules. It is also consistent with growing evidence that the public thinks of political advertising as a distinct category and has different expectations and tolerances for it compared to commercial advertising (Herder and Dirks, Reference Herder and Dirks2022; Zeng, Kohno and Roesner, Reference Zeng, Kohno and Roesner2021). Thus far, regulations have primarily come from the digital platforms themselves, but there is significant interest in expanding government oversight (e.g., Coons, Reference Coons2021).
However, meeting demands for new regulations in this domain is complicated by uncertainty about what people mean when they refer to a “political” ad. If platforms and government officials wish to benchmark their policies to public expectations, a crucial step must be to establish what actually makes an ad political to the public. Are there identifiable dimensions of content that drive these perceptions, and, if so, which factors are most important? Despite the centrality of this question for understanding public preferences in this domain, we are aware that no previous studies tackle it directly, and the existing literature provides little guidance.
In this article, we use two large nationally representative surveys to study what factors contribute to perceptions of “politicalness” in digital ads. Specifically, we compare the importance of ad source, content, and political orientation in shaping public perceptions of the political. The first two features are important to understand because they are the primary features that platformsFootnote 1 have used to define political advertising (although which dimension is essential has varied significantly across platforms and over time). The latter feature is important to study to rule out the possibility that the public merely views content they disagree with as being “political.”
Methodologically, we first use a conjoint design that allows us to isolate the independent causal effects of each dimension (Hainmueller, Hopkins and Yamamoto, Reference Hainmueller, Hopkins and Yamamoto2014). We further conduct a within-between experiment asking respondents to evaluate real ads drawn from the Facebook Ad Library. This allows us to replicate the findings from our conjoint using authentic stimuli, and we refer to this as the real ads experiment.
We find that both sponsor-level cues (e.g., sponsorship by candidates) and content-level cues (e.g., stronger messages advocating for government action) play an independent role in shaping perceptions. Participants attribute more political meaning to ads that clash with their own preferences or are sponsored by ideologically unaligned entities, but these effects are modest. These patterns replicate across studies, although sponsorship is more important in the real ads experiment.
Our results are important because they indicate that the public on average does have a systematic, if implicit, understanding of the political. Although there is no universally accepted definition of political advertising, there are clearly characteristics that drive these perceptions on average. Thus, our results serve as an important benchmark for policymakers and platforms wanting to align their approaches with public expectations on how political ads should be defined. In particular, these results suggest that definitions that rely on sponsor-level or content-level features in isolation do not match the public’s understanding.
What makes an ad political?
Debates on the definition of “political” have a long history, from Aristotle to 19th- and 20th-century theorists (e.g., Arndt, Reference Arndt2019; Weber, Reference Weber2004). However, empirical research often lacks an operational definition (Guess et al., Reference Guess, Munger, Nagler and Tucker2019), with scholars noting they have “largely ignored the problem of vague definition” (Settle, Reference Settle2018, p. 120).
Yet, for social media companies, defining and operationalizing this concept has become unavoidable. Social media has become a sought-after delivery platform for political advertising. And as this has happened over the last decade in particular, public calls for platforms to place limits on political advertisers have grown ever louder. Starting in 2018, social media companies have responded to this pressure by creating new policies to govern the delivery of political advertising on the platforms they control. Exactly which ads should platforms subject to these new policies? And what definitions should they draw upon?
One answer is to use legal definitions. However, in the United States, government entities can offer little legal guidance due to First Amendment constraints on government action in digital spaces and a near-vacuum of federal regulation (Fowler, Franz, and Ridout, Reference Fowler, Franz and Ridout2021). Another approach is to draw from political theory and qualitative insight. Here, while there is broad agreement on core political speech (e.g., candidate ads), the boundaries are politically contested (e.g., the feminist adage that “the personal is political”). To the extent there is a consensus, it is that the definition is contextual. Politicalness, it seems, is highly subjective, “created through the process of developing and clarifying one’s social identity” (Cramer Walsh, Reference Cramer Walsh2004, p.4). This, as one may imagine, is a difficult conceptualization for platforms to execute at scale.
Existing quantitative research on public views of the political offers little better guidance. Fitzgerald (Reference Fitzgerald2013) used a convenience sample of U.S. Americans and Canadians to investigate which issues were considered political across contexts. Settle (Reference Settle2018) relied on a larger representative survey of U.S. Facebook users in 2016 to study how respondents learned the political orientation of friends. Both studies report that what the public views as political is contingent on factors such as ideology, gender, and political engagement, but it is unclear how exactly this translates to online ads. More recently, Groenendyk and Krupnikov (Reference Groenendyk and Krupnikov2021) show that politics is associated with adversarial thoughts (see also Groenendyk et al., Reference Groenendyk, Krupnikov, Ryan and Connors2024). Finally, in research most similar to our own, Sosnovik and Goga (Reference Sosnovik and Goga2021) examine which Facebook ads were considered to be about elections, politicians, or social issues by a non-representative set of labelers. While this study did not attempt to identify which components of ads motivated their choices, its goal of attempting to detect political ads based on user labeling is related to ours (see also Guess et al., Reference Guess, Munger, Nagler and Tucker2019).
Therefore, platforms have, by necessity, been forced to develop definitions themselves with little concrete guidance. To better understand these policies, we believe it is informative to turn to a method frequently employed by both independent and platform-affiliated human-computer interactions (HCI) and social media researchers when studying politics-adjacent issues: user studies (Zeng, Kohno and Roesner, Reference Zeng, Kohno and Roesner2021; Redmiles, Bodford and Blackwell, Reference Redmiles, Bodford and Blackwell2019; Ur et al., Reference Ur, Leon, Cranor, Shay and Wang2012; Redmiles, Chachra and Waismeyer, Reference Redmiles, Chachra and Waismeyer2018; Zeng et al., Reference Zeng, Wei, Gregersen, Kohno and Roesner2021; An, Reference An2020; Wei et al., Reference Wei, Stamos, Veys, Reitinger, Goodman, Herman, Filipczuk, Weinshel, Mazurek and Ur2020; Darke and Ritchie, Reference Darke and Ritchie2007; Gomez-Mejia, Reference Gomez-Mejia and Meiselwitz2020). While public opinion should not necessarily dictate platform activities, it seems reasonable that it should at least inform policy design in this area, as it does in so many others. In this way, our study aligns with research that often relies on respondents’ implicit understanding of “political” (e.g., Guess et al., Reference Guess, Munger, Nagler and Tucker2019; Settle, Reference Settle2018; Sosnovik and Goga, Reference Sosnovik and Goga2021), but leverages our experimental design to more directly interrogate the dimensions that drive these perceptions.
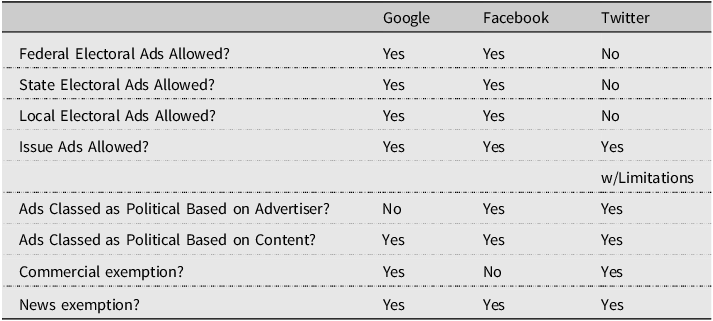
Thus, to motivate our design, we begin by considering how the major social media platforms have defined the political. Definitions on each platform have shifted significantly over the past several years, but broadly speaking, there are two dimensions that platforms use to identify an ad as political or not. First, an ad may be political because of the sponsor, regardless of the ad content itself. For example, platforms identify all ads paid for by federal candidates for office as political (Facebook, 2022d; Google, 2022a; Twitter, 2022c). Second, an ad may be identified as political, regardless of its sponsor, due to its content. For instance, almost all platforms identify ads that are substantially focused on candidates for national office as being political.
Between different platforms, definitions vary about specifically which sponsors or what content makes an ad political. A useful comparison for our experiments is the set of policies at Facebook, Twitter, and Google that were in place during the 2020 U.S. presidential election (and motivated this study). The relevant policies in place at all three companies are indicated in Table 1. Of the three major platforms, Facebook used the broadest definition of political content, including ads about federal, state, or local elections (Facebook, 2022c) and policy issues (Facebook, 2022a). It refers collectively to ads that fall under this umbrella as ads on “social issues, elections, and politics.” However, Facebook (as well as Google and Twitter) exempted ads from verified news publishers from their political ad policies (Facebook, 2022b; Twitter, 2022b; Google, 2021).
Electoral and issue ad policies of major social media platforms during the 2020 U.S. election period

During this period, Google included only federal and state “electoral” content, defined as ads featuring candidates or officeholders on the state or federal level, political parties, and ballot measures (Google, 2022b). It also exempted ads for products and services from these policies, which we refer to as a commercial exemption. Twitter defined two separate categories of political ads. The platform referred to electoral ads on the federal, state, or local level as “political” (Twitter, 2022c) and called issue ads “cause-based” (Twitter, 2022a) advertising. Unlike Google, whose policy for electoral ads was focused solely on content, Twitter defined “political” advertising both in terms of contentFootnote 2 and in terms of the speaker: content from political candidates, office holders, and parties, as well as political action committees (PACs) was always considered political (Twitter, 2022c). By contrast, Twitter defined cause-based advertising as content that seeks to “educate, raise awareness, and/or call for people to take action in connection with civic engagement, economic growth, environmental stewardship, or social equity causes.” This is what we refer to as issue ad content. During the 2020 U.S. presidential election period, Twitter prohibited “political” ads entirely, and limited how “cause-based” ads could be targeted.
Motivated by these policies, our study focuses on a better understanding of how these core features – the source and content – drive perceptions of the political. Specifically, we preregisteredFootnote 3 two main hypotheses.
H1: Ads from sources viewed as being overtly political (i.e. presidential candidates) will be rated as more political than other sources (i.e. corporations and advocacy groups).
H2: Ads with messages that engage in stronger content will be rated as more political, regardless of source.
The term “stronger” refers to content that more expressly advocates for a candidate or public policy. As we discuss in Appendix A in more detail, this definition comes with some ambiguity. However, it was intended to echo the platforms’ content-based definitions.
In addition, our third hypothesis is that respondents will be more likely to label ads as political when they are non-congruent with their own prior attitudes. This expectation builds on past research showing individual heterogeneity in how individuals define “political” (Fitzgerald, Reference Fitzgerald2013), as well as the extensive literature on motivated reasoning (Bolsen, Druckman, and Cook, Reference Bolsen, Druckman and Cook2014; Lodge and Taber, Reference Lodge and Taber2013).
H3: Prior beliefs will influence opinions, in that, participants will perceive ads with messages that do not conform to their beliefs to be more political than those that do
This dimension is important to consider to rule out the possibility that the public simply sees content they disagree with as political.
Finally, one concern is that our results may be driven by the artificial nature of the political ads created for the conjoint experiment. Therefore, we tested if these patterns replicate when using authentic political ads in the following research question.
RQ1: Do the effects measured in the conjoint analysis replicate when respondents evaluate real social media ads?
Methods and materials
Our analyses rely on two nationally representative samples from the American Social Survey (TASS). The samples are collected by the National Opinion Research Center (NORC) at the University of Chicago. TASS draws a national sample of 1,000 from the large panel of 35,000 people already recruited by NORC. These are general population samples of U.S. adults aged 18 and older and were selected from NORC’s AmeriSpeak Panel for this study to match national benchmarks. The NORC1 survey was fielded July 1 – 24, 2020 ( $N = 1,006$
). This survey included the conjoint experiment and the real ads experiment. However, due to a programming error, the conjoint study from this wave was not usable. The NORC2 survey was fielded to re-administer the NORC1 wave with the correct programming for the conjoint. This was fielded from March 31 to April 19, 2021 (
$N = 1,006$
). This survey included the conjoint experiment and the real ads experiment. However, due to a programming error, the conjoint study from this wave was not usable. The NORC2 survey was fielded to re-administer the NORC1 wave with the correct programming for the conjoint. This was fielded from March 31 to April 19, 2021 ( $N = 1,013$
). The conjoint and real ads experiments were both preregistered.Footnote
4
We analyze both the conjoint and real ads data from this survey.Footnote
5
$N = 1,013$
). The conjoint and real ads experiments were both preregistered.Footnote
4
We analyze both the conjoint and real ads data from this survey.Footnote
5
We also conducted two smaller surveys of U.S. adults recruited via Amazon’s Mechanical Turk (AMT). These additional studies were designed to validate our coding of the message strength needed to test H2. These samples are discussed in Appendix D.
Conjoint experiment
We constructed realistic stimuli by recombining a source, message, and image selected at random from a preselected set of components shown in Figure 1. We then constructed ads representing every possible combination of these features. Respondents were shown two of the possible ads at random and were asked to choose the one that was more political. An example task is shown in Appendix C. Respondents completed this task eight times.
All source, message, and image components used to combine the 6 $ \times $
6
$ \times $
6 $ \times $
5 = 180 ads of the conjoint experiment.
$ \times $
5 = 180 ads of the conjoint experiment.

In choosing the ad components, we sought to make a compromise between ad elements that were somewhat realistic and ad elements that lent themselves to clean randomization as part of the conjoint experiment. Since respondents were asked to make eight choices, we also wanted variation in wording and appearance.
To begin, we chose a single broad issue area. We did not want to have ads discussing wildly different topics as this would have introduced yet another dimension. We chose energy and environmental policy, which has the advantage that commercial companies (e.g., Exxon and Patagonia) regularly advertise in this issue area. In addition, choosing one issue area allowed us to create more plausible stimuli since we can match aspects like images and sponsors to the content. It would be implausible, for instance, for the Sierra Club to release ads on abortion rights. We discuss this limitation further in our concluding discussion.
Next, we selected real advertisers who had ads in the Facebook Ad Library related to either oil sector development or environmental protection. The categories of ad sources that we chose included political candidates, nonprofit groups, and politically active companies, such that there was one pro-developmentFootnote 6 and one pro-environmental source in each category. Candidates were selected by choosing the presidential candidate from the Republican and Democratic parties. Nonprofit organizations were selected by first identifying the top-spending nonprofit organizations on environmental and business regulatory issues and then selecting the highest spending pro-environment (The Sierra Club) and pro-development (Power the Future) organizations whose advertising was solely focused on those issues. Politically active corporations, Exxon and Patagonia, were identified by looking for corporations that were top spenders on this topic and then selecting entities with PACs that had more than 75% of their spending identified as being for one party according to Open Secrets.
Message texts were taken from the Ad Library and edited lightly to make them more comparable in terms of message strength. We chose three pro-development and three pro-environment messages of varying strength, where stronger ads more explicitly advocate for government action. To validate our coding of strength, we showed these messages to a small convenience sample. These results are shown in Appendix D and support our coding.
Images were necessary to make the ads seem authentic but are not our focus. We chose relatively generic images that might seem appropriate next to a variety of messages. Recall, however, that the conjoint design means that any effect of the images is marginalized out.
Prior orientation for respondents’ opinions on development was measured based on responses to two items related to global warming and environmental protection. The specific question items are shown in Appendix C. We combined these items additively and used a median split to identify “pro-development” and “pro-environment” respondents.Footnote 7
In our analysis, we use the statistical methods described in Hainmueller, Hopkins, and Yamamoto (Reference Hainmueller, Hopkins and Yamamoto2014) and implemented them in the cjoint R package. This allows us to calculate the average marginal component effect (AMCE) for our main hypotheses. To test how message orientation interacts with prior beliefs, we calculate the average component interaction effect (ACIE).Footnote 8
Real ads experiment
To study how respondents judge the politicalness of more realistic ads, we designed a second experiment using real ads selected from Facebook’s Ad Library. This study was repeated on both the NORC1 and NORC2 waves, which we pool in our analysis below.Footnote 9 Respondents were asked to evaluate ads from eight different sources. We selected ads from the same six advertisers as in the conjoint experiment and added an additional category: nonpolitical corporations. Our nonpolitical corporations, MSC Industrial and Colgate, were identified by looking for advertisers that had a small number of non-declared political ads, and no declared political ads in Facebook’s Political Ad Library.
From each advertiser, we selected two ads. One was coded as a relatively strong political message and imagery, while the other was relatively weaker. As noted above, we define strong ads to be those that more expressly advocate for a candidate or public policy (see Appendix A). All ads are shown in Appendix C. For the nonpolitical corporation category, “strong” ads were selected from the source’s non-disclosed political ads, and “weak” ads were selected from currently running nonpolitical ads from Facebook’s Library for all ads. The relative strength of the messages was validated with the second Mechanical Turk convenience sample ( $N = 302$
), which is discussed in Appendix D.
$N = 302$
), which is discussed in Appendix D.
In the experiment, each respondent was shown one ad from each sponsor (for a total of eight ads) and asked, “How political is this ad?” Responses were on a five-point scale ranging from “not at all political” (1) to “extremely political” (5). For each source, respondents were randomly assigned to see either the “strong” or “weak” ad. Thus, this can be considered a within-between experiment since respondents rated multiple ads but the exact composition of the ads was randomized for each respondent. In the main text, we estimate the effects of ad strength separately for each source, essentially treating them as eight separate between-subject experiments.Footnote 10
Results
We begin by reporting the AMCE for the conjoint. There are 8,008 observations from 1,013 respondents. The AMCE estimates are shown in Figure 2, and the full table of results is shown in Appendix F. While both the ad source and message matter, it is the content of the ad messages that has the largest AMCE on perceived politicalness. Specifically, moving from the baseline of a weak message (e.g., “Let’s work together to preserve America’s natural beauty for future generations to enjoy”) to a moderately strong message (e.g., “Texas oil … production is making America more energy secure.”) has an effect of 13.3% ( $se = 0.02$
,
$se = 0.02$
, $p \lt 0.001$
). Moving from the baseline to a strong message (e.g., “Politicians are trying to gut the National Environmental Policy Act”) has an effect of 37% (
$p \lt 0.001$
). Moving from the baseline to a strong message (e.g., “Politicians are trying to gut the National Environmental Policy Act”) has an effect of 37% ( $se = 0.02$
,
$se = 0.02$
, $p \lt 0.001$
). Substantively, this effect size is large. In all, this is clear evidence in favor of H2.
$p \lt 0.001$
). Substantively, this effect size is large. In all, this is clear evidence in favor of H2.
Effect of advertisement’s attributes on the perception of ad’s politicalness (Average Marginal Component Effects). Estimates of the effects of the randomly assigned ad attributes on the perceived politicalness of the ad in a paired conjoint experiment. The full model includes an attribute accounting for the images displayed in each ad. See Table F.1 for full results. (Source: Sample NORC2; $N = 1,013$
).
$N = 1,013$
).
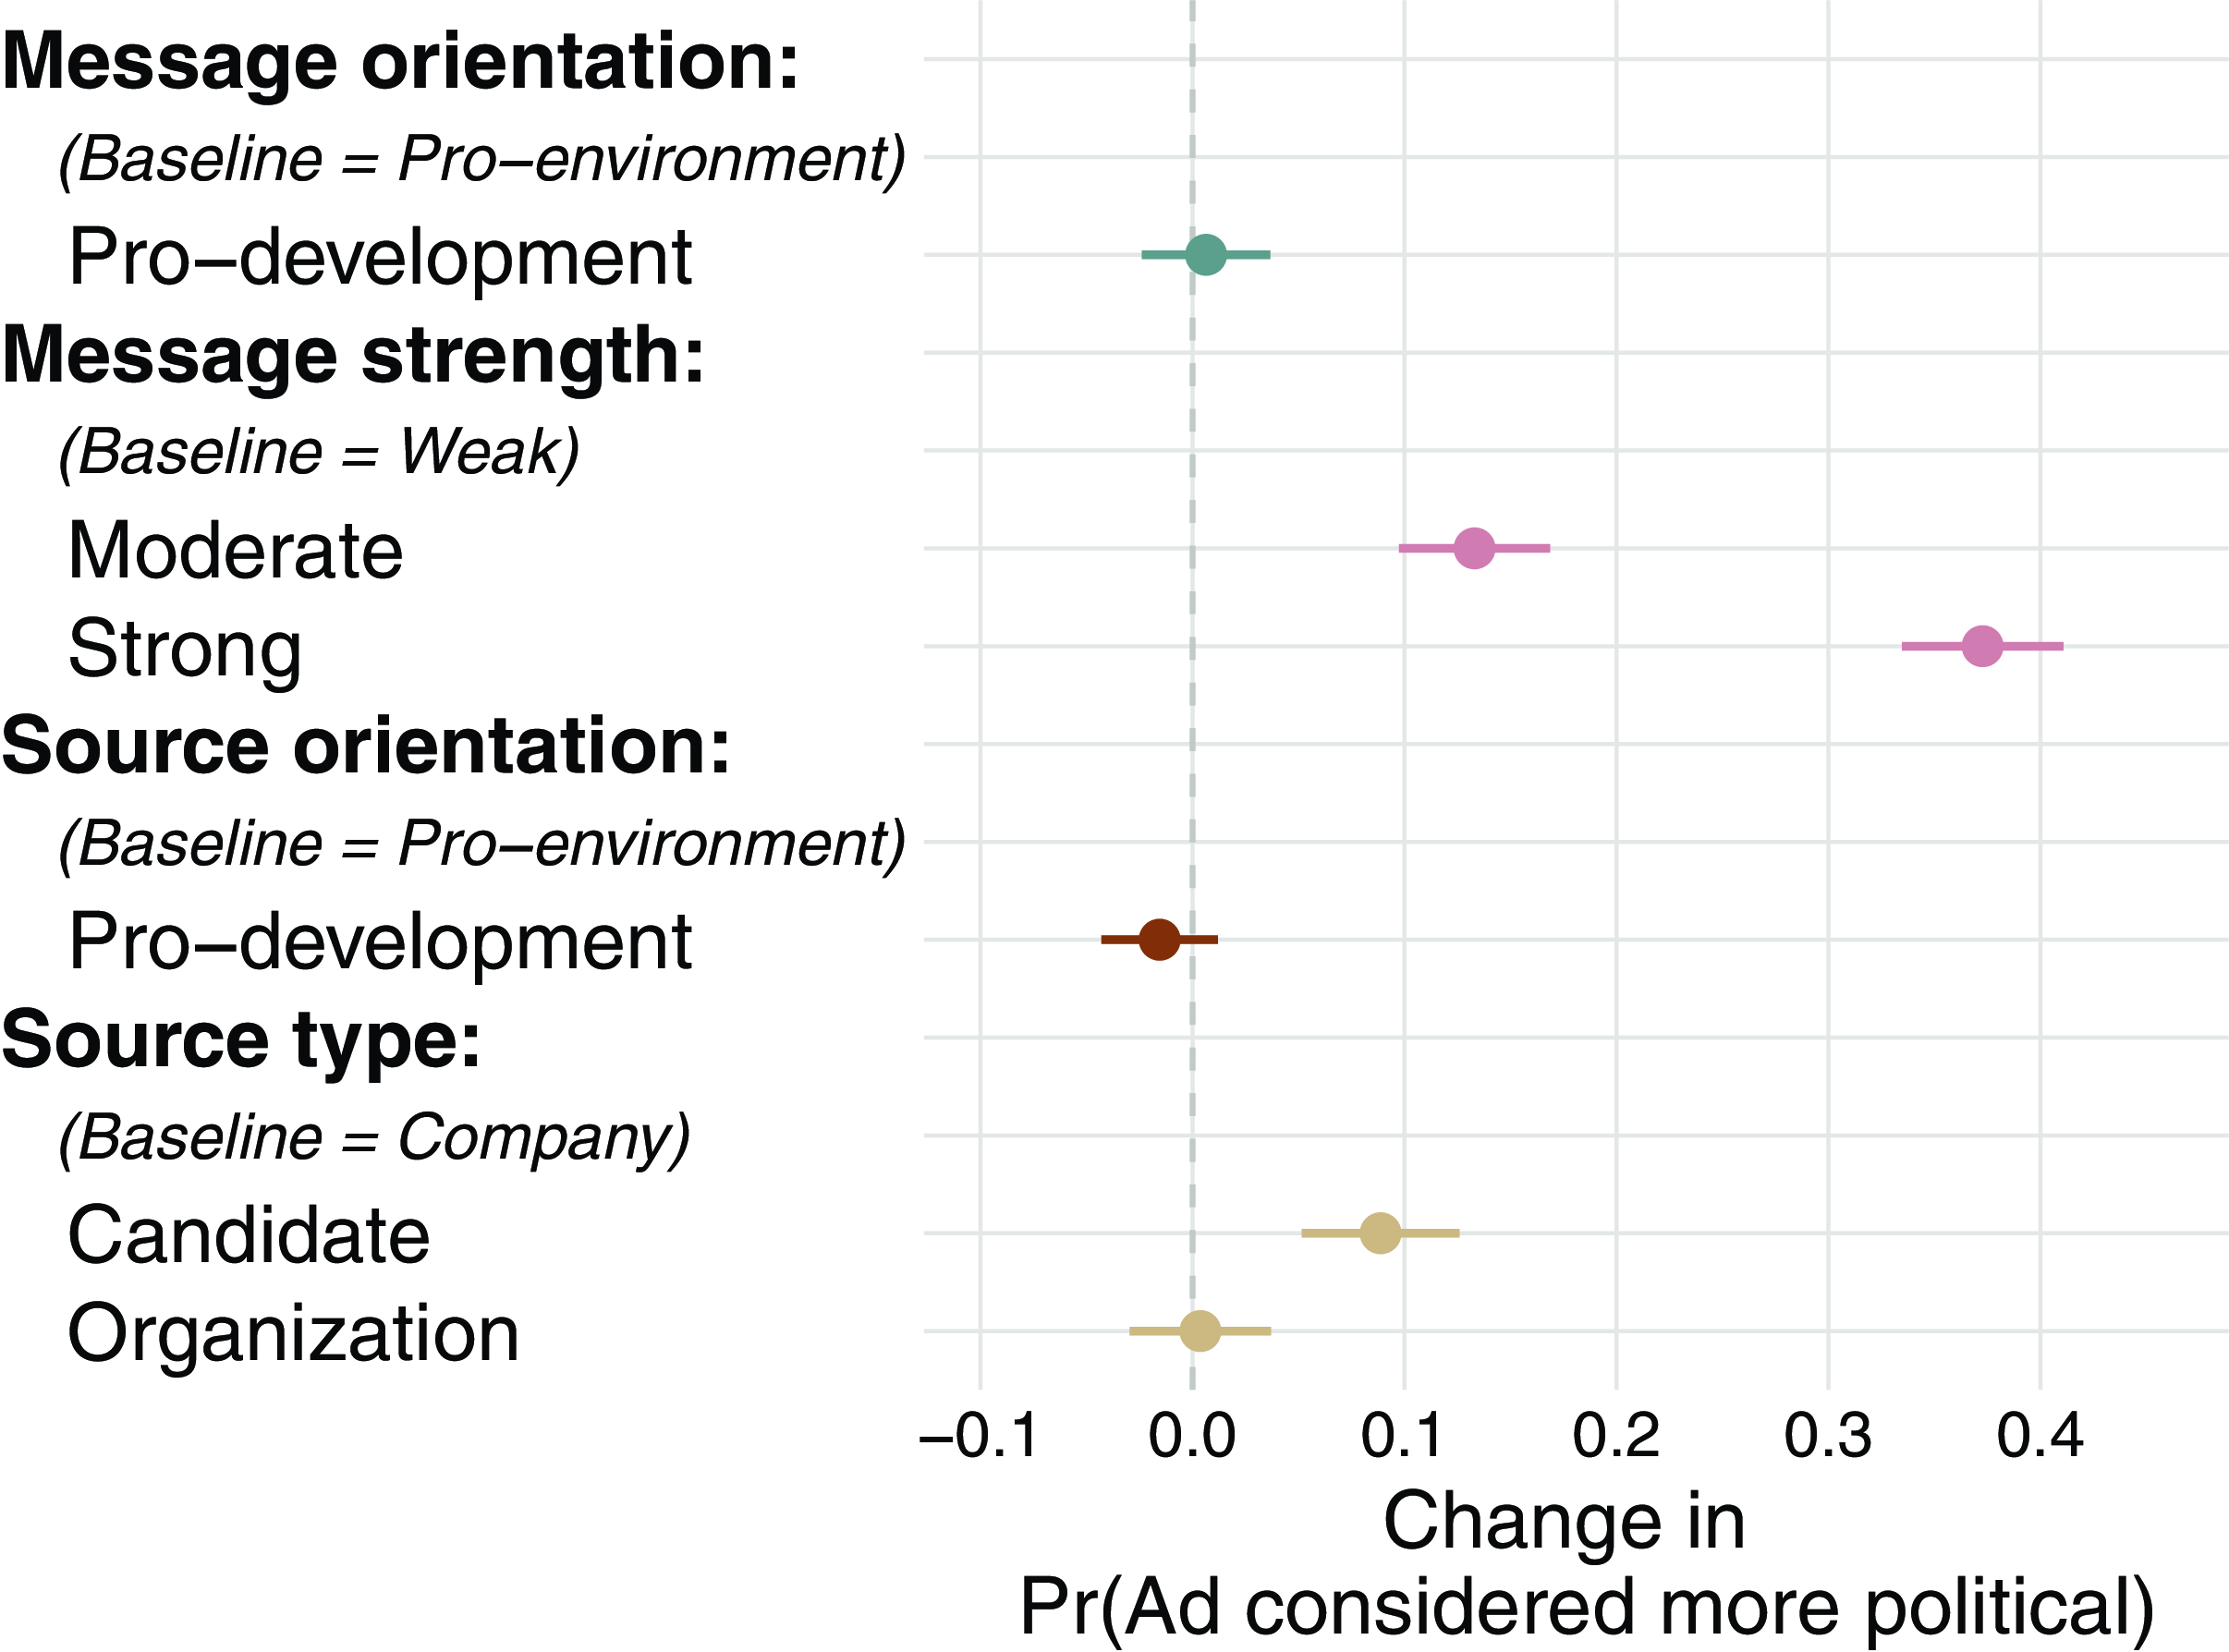
In terms of ad source, the AMCE for moving from the corporate baseline (Patagonia and Exxon) to a political candidate (Biden or Trump) is 9% ( $se = 0.02$
,
$se = 0.02$
, $p \lt 0.001$
). Moving from a corporate source to a political organization (Sierra Club or Power the Future) has a modest effect of 0.5% (
$p \lt 0.001$
). Moving from a corporate source to a political organization (Sierra Club or Power the Future) has a modest effect of 0.5% ( $se = 0.02$
,
$se = 0.02$
, $p = 0.83$
). Thus, the effects of the source are more modest but still support H1.
$p = 0.83$
). Thus, the effects of the source are more modest but still support H1.
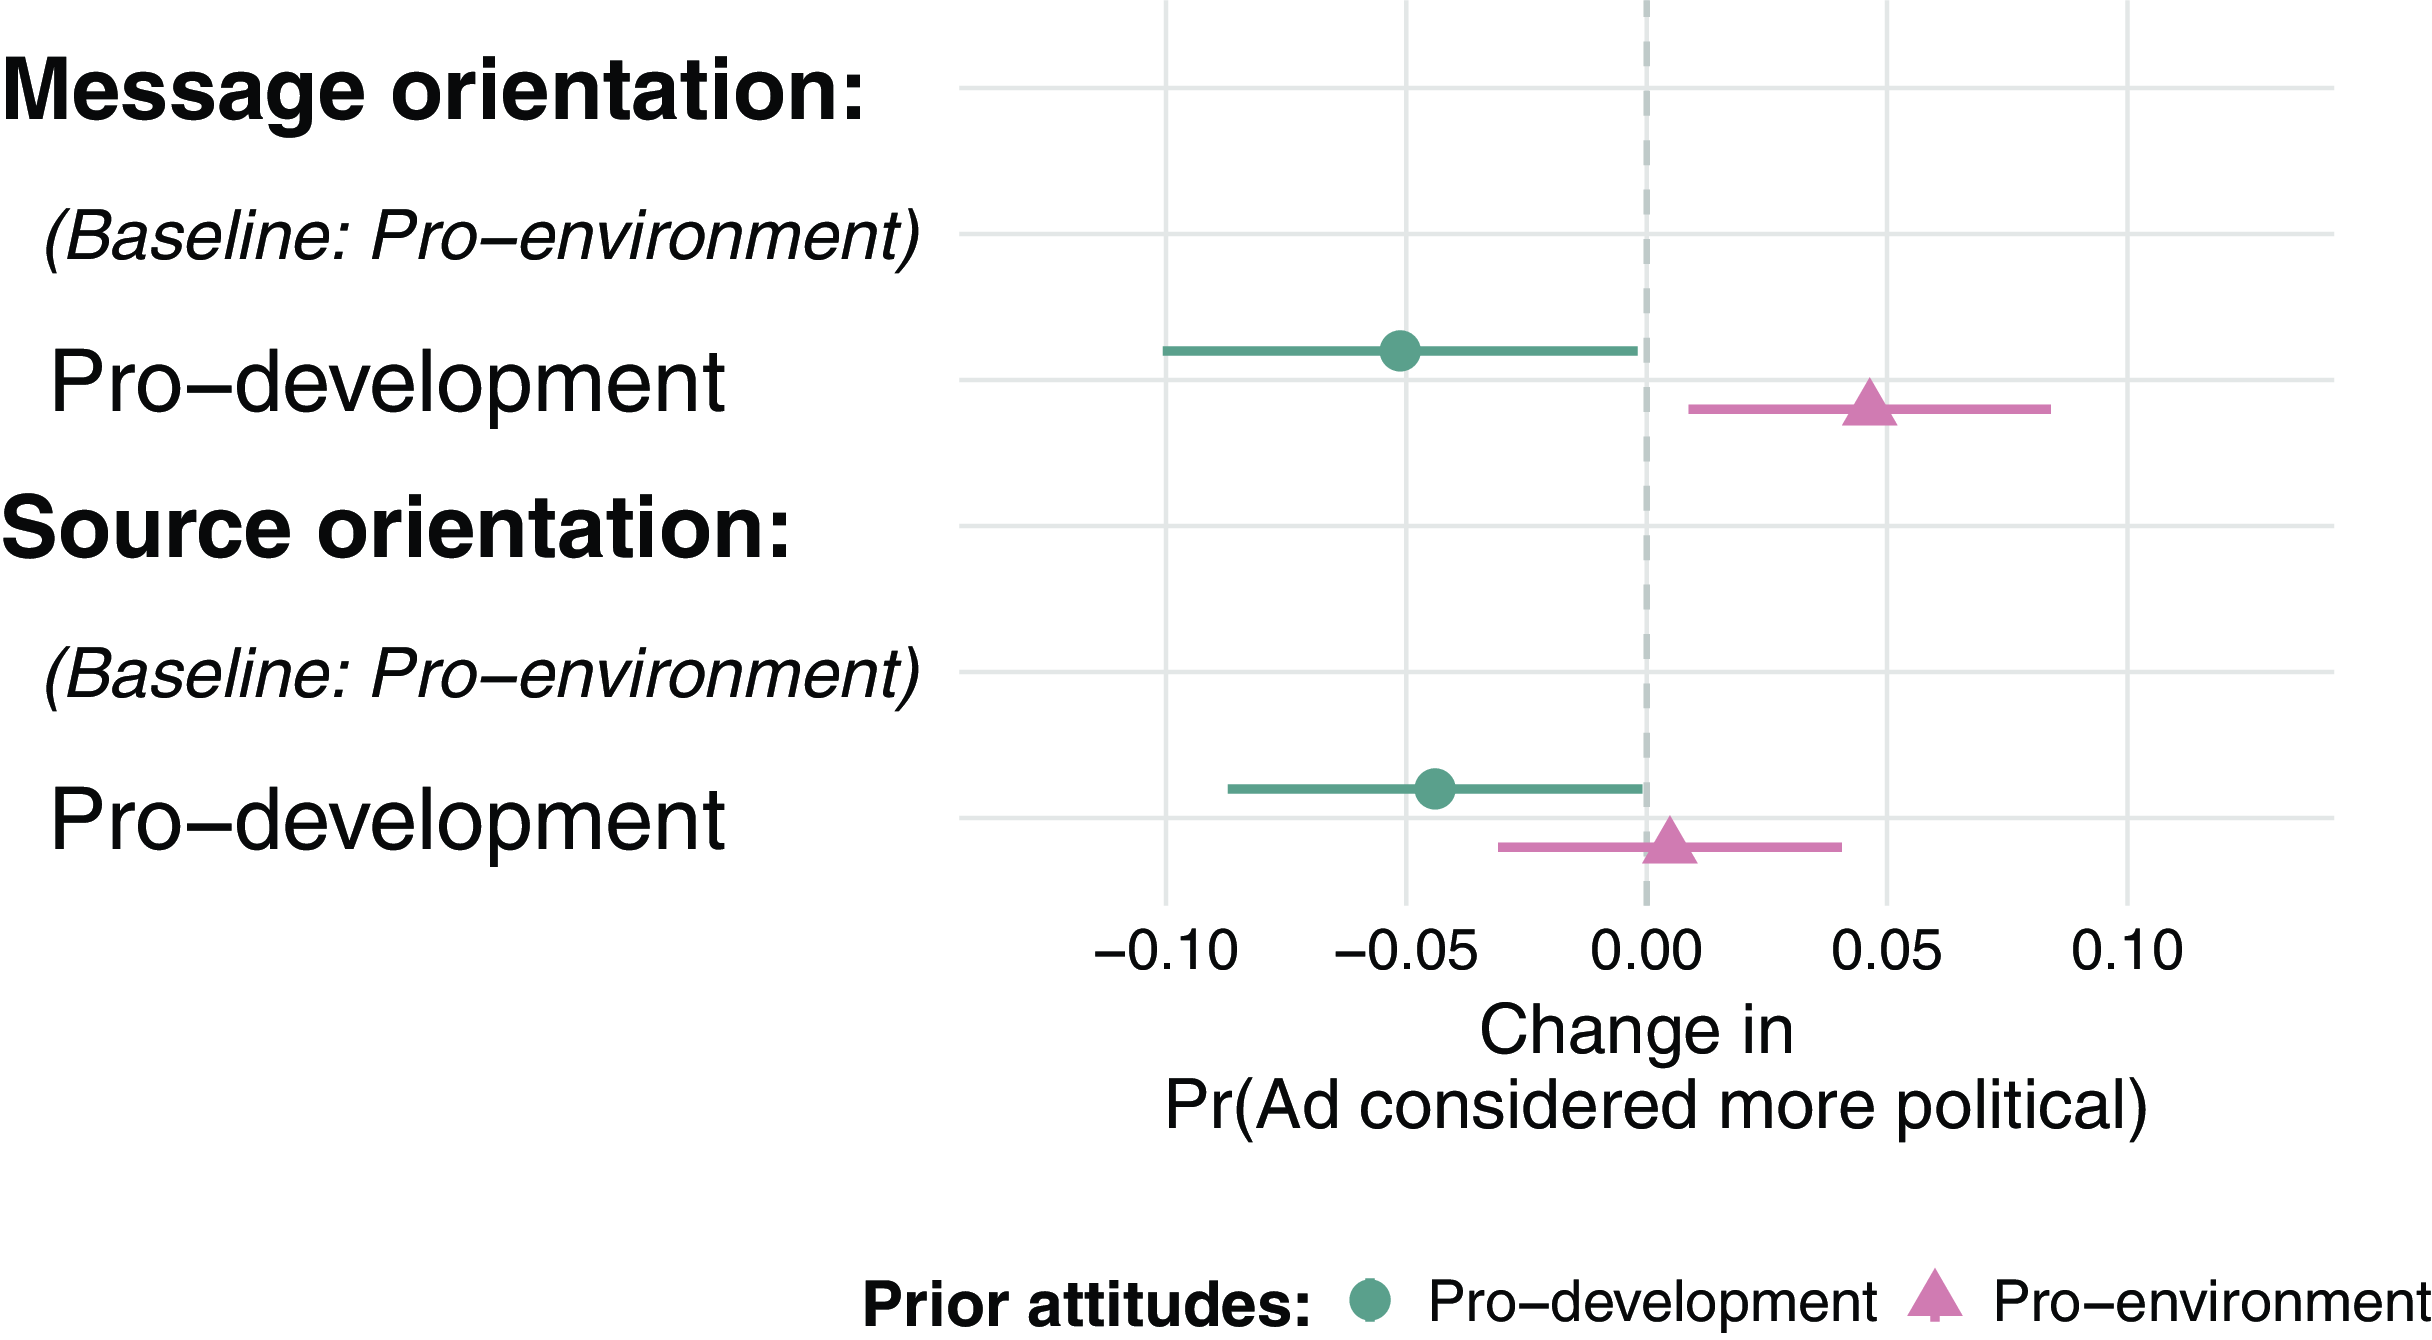
We next turn to analyzing the effects of ad components on perceived politicalness conditional on respondents’ prior beliefs. Consistent with our preregistered expectations, the results in Figure 3 show that among respondents with more pro-development attitudes, messages more in favor of oil development were perceived as less political than messages with more pro-environment messages ( $\beta = - 0.05$
,
$\beta = - 0.05$
, $se = 0.03$
,
$se = 0.03$
, $p = 0.04$
). Likewise, ads from pro-oil sources (e.g., Exxon) were viewed as being less political relative to ads from pro-environmental sources such as Patagonia (
$p = 0.04$
). Likewise, ads from pro-oil sources (e.g., Exxon) were viewed as being less political relative to ads from pro-environmental sources such as Patagonia ( $\beta = - 0.04$
,
$\beta = - 0.04$
, $se = 0.02$
,
$se = 0.02$
, $p = 0.05$
). Respondents with pro-environmental prior beliefs viewed pro-development ads as being more political (
$p = 0.05$
). Respondents with pro-environmental prior beliefs viewed pro-development ads as being more political ( $\beta = 0.05$
,
$\beta = 0.05$
, $se = 0.02$
,
$se = 0.02$
, $p = 0.02$
), although there was no measurable effect for source orientation for this group (
$p = 0.02$
), although there was no measurable effect for source orientation for this group ( $\beta = 0.005$
,
$\beta = 0.005$
, $se = 0.02$
,
$se = 0.02$
, $p = 0.79$
). This evidence largely supports H3, although these effect sizes are modest.
$p = 0.79$
). This evidence largely supports H3, although these effect sizes are modest.
Effect of pro-development message and source on the perception of ad’s politicalness, conditioned on pro-development prior orientation. Estimates are Average Component Interaction Effects in a paired conjoint experiment. The dependent variable is a dummy variable indicating whether an ad was selected as more political when presented with two ads. See Table F.2 for full results. (Source: Sample NORC2; $N = 1,013$
).
$N = 1,013$
).

Turning to the real ads experiment, we first analyze the effect of each treatment (strong versus weak ad) separately for all eight sources. The means are shown in Figure 4, and simple bivariate regressions are reported in Appendix G.1. Full results of summary statistics are reported in Appendix Table G.1. For each of the eight sources, the ad with the stronger message was rated as being more political with treatment effects in Table G.2 ranging from 0.60 ( $se = 0.07$
,
$se = 0.07$
, $p \lt 0.001$
) for Biden to a remarkable 1.93 on the five-point scale (
$p \lt 0.001$
) for Biden to a remarkable 1.93 on the five-point scale ( $se = 0.06$
,
$se = 0.06$
, $p \lt 0.001$
) for Patagonia.
$p \lt 0.001$
) for Patagonia.
Average perceived politicalness of political ads by source and message strength. For each of the eight ad sources, each participant saw an ad with either a weak or strong political message. Point estimates represent weighted means (with 95% confidence intervals). The variables are measured on a five-point scale ranging from not political (1) to extremely political (5). Confidence intervals are sufficiently small that they are not always visible behind the point estimates. See Table G.2 in Appendix G for full results. (Source: NORC1 and NORC2 $N = 1,963$
).
$N = 1,963$
).

As in the conjoint, the real ads experiment suggests that the public does appear to view ads from politicians as generally more political than ads from advocacy groups, which in turn are perceived as more political than those from politically active businesses. Indeed, Figure 4 illustrates that even ads from politicians with weak messages (e.g., selling t-shirts or coloring books) are on average viewed as political with mean scores of 3.62 for the weak/Biden ad and 3.38 for the weak/Trump ad, placing them somewhere between “somewhat political (3)” and “very political (4).” We confirm that these source-based cues are statistically distinguishable in our pooled analysis reported in Appendix G.3.Footnote 11
To understand how prior attitudes shape evaluations of politicalness, we ran an additional analysis of each study controlling for party affiliation (and excluding independents) and gender. The full results are shown in Table G.3 and Table G.4, respectively. The results show that Republican respondents (relative to Democrats) found ads from pro-development/Republican sources less political, while the pro-environment/Democratic ads were viewed as more political. The indicator for Republican respondents is positive and statistically significant for the Biden ( $\beta = 0.42$
,
$\beta = 0.42$
, $se = 0.07$
,
$se = 0.07$
, $p \lt 0.001$
), the Patagonia (
$p \lt 0.001$
), the Patagonia ( $\beta = 0.21$
,
$\beta = 0.21$
, $se = 0.07$
,
$se = 0.07$
, $p = 0.002$
), and the Sierra Club (
$p = 0.002$
), and the Sierra Club ( $\beta = 0.14$
,
$\beta = 0.14$
, $se = 0.07$
,
$se = 0.07$
, $p = 0.04991$
) experiments.Footnote
12
Consistent with expectations, the relevant coefficients are negative and significant for the Trump (
$p = 0.04991$
) experiments.Footnote
12
Consistent with expectations, the relevant coefficients are negative and significant for the Trump ( $\beta = - 0.53$
,
$\beta = - 0.53$
, $se = 0.07$
,
$se = 0.07$
, $p \lt 0.001$
), Power the Future (
$p \lt 0.001$
), Power the Future ( $\beta = - 0.32$
,
$\beta = - 0.32$
, $se = 0.07$
,
$se = 0.07$
, $p \lt 0.001$
), and Exxon ads (
$p \lt 0.001$
), and Exxon ads ( $\beta = - 0.15$
,
$\beta = - 0.15$
, $se = 0.07$
,
$se = 0.07$
, $p = 0.039$
). Here again, this effect is consistent with our results from the conjoint.Footnote
13
$p = 0.039$
). Here again, this effect is consistent with our results from the conjoint.Footnote
13
In summary, candidate ads are viewed as inherently political, in contrast to sources such as politically active companies and advocacy organizations, where message strength appears to matter far more in order for an ad to be considered political. This differs from our finding in the conjoint analysis, where ads from companies and advocacy organizations were viewed as equally political. This may reflect the artificial nature of ads in the conjoint experiment, the fact that we did not include nonpolitical companies in the conjoint experiment or the different nature of the ads available from different source types in the Ad Library in the real ads experiment. Despite these differences, however, these results largely confirm our findings in the conjoint experiment, and thereby, provide a positive answer to RQ1.
Conclusion
Our results suggest that the message, messenger, and the viewer’s prior beliefs all impact the public’s determination of what qualifies as a political ad. In particular, either an ad sponsor affiliated regularly with political advocacy or a strong message is enough to affect respondents’ perceptions. The effect of the prior beliefs of respondents, while significant, is much smaller.
Our work sheds light on citizen preferences around online political advertising and also highlights how these differ from both existing and proposed operationalizations. In particular, definitions that rely solely on whether the ad is sponsored by a candidate or advocacy group clearly do not meet public expectations. Further, definitions focused only on elections also fail to meet citizen expectations. Both our experiments tested public perceptions of non-electoral ad content and found that when these ads are backed by a strongly political figure or simply contain strong messages, respondents consider them political. When we compare our results to platform policies, Facebook’s definition of political advertising, which includes issue advertising, appears to be closer to the public’s definition.
These results may aid policymakers in defining political ads in ways that align with public perceptions. While regulation of political advertising online does not seem imminent in the United States, all major platforms have specific policies around digital political ads. As with other areas of social media policy, it is in platforms’ interest to align their policies with user preferences, and they frequently use user studies (Goodrow, Reference Goodrow2021; Horwitz, Reference Horwitz2021) (as we do) to understand user perceptions.
Although these findings represent the most comprehensive exploration of this question to date, future work could expand upon our findings in several ways. First, we based our coding of message strength on whether the ad advocated for a candidate or issue. However, there is surely a continuum of message strength that we cannot fully explore here. Other important factors may include whether the ad mentions a politician, whether it asks viewers to engage in a political act, or whether the issue at hand is viewed as partisan.
Relatedly, we tried to restrict our study to the single-issue area of energy/environmental policy. We did so to isolate the effects of other ad features (e.g., message strength, source, orientation), because this is an area of active political debate where many “non-traditional” organizations are active, and because environmental policy provided a middle ground between topics that are by their nature inherently political (e.g., voting rights) and topics that are largely absent from current political discourse (e.g., soap). This, of course, raises the question of which issue areas are considered more or less political in the first place and is an area for future investigation (but see Fitzgerald, Reference Fitzgerald2013; Settle, Reference Settle2018).
Finally, the questions we raise and our design strategy are focused on the U.S. setting. Platform rules and definitions already differ significantly across countries. Likewise, the very nature of the “political” may vary across contexts (Fitzgerald, Reference Fitzgerald2013). More work is needed to understand these issues from a cross-national perspective.
Supplementary material
The supplementary material for this article can be found at https://doi.org/10.1017/XPS.2025.4
Data availability
The data, code, and any additional materials required to replicate all analyses in this article are available at the Journal of Experimental Political Science Dataverse within the Harvard Dataverse Network, at doi: https://doi.org/10.7910/DVN/DW6ZGZ (Edelson et al., Reference Edelson, Dominique, Guillard, Lauinger, Li and Montgomery2025).
Acknowledgments
We are grateful for the helpful comments from Taylor Carlson and Erika Franklin Fowler.
Competing interests
None.
Funding
Funding for this study was provided by the Weidenbaum Center on the Economy, Government, and Public Policy. Cybersecurity for Democracy at NYU’s Center for Cybersecurity has been supported by Democracy Fund, Luminate, Media Democracy Fund, the National Science Foundation under grant 2151837, Reset, and Wellspring. This material is based upon work supported by the Google Cloud Research Credits program.
Ethics statement
Data collection was approved by our Institutional Review Boards (IRBs) at New York University (#IRB-FY2020-4335) and Washington University in St. Louis (IRB #201905178). The studies related to this publication adhere to APSA’s Principles and Guidance for Human Subjects Research.


 Open access