

Iron deficiency (ID) may affect as many as two billion people worldwide( Reference Umbreit 1 ). It is especially common in pregnant women and young children( Reference Siega-Riz, Hartzema and Turnbull 2 ). Although ID is easily treated with Fe supplementation, excess Fe is associated with homoeostatic dysregulation of other metals, including Mn( Reference Pathak, Kapil and Kapoor 3 – Reference Knovich, Il’yasova and Ivanova 5 ). The Fe-overload diet reduced the absorption of inorganic Mn, thereby lowering the Mn status in rats( Reference Thompson, Molina and Donaghey 6 , Reference Davis, Wolf and Greger 7 ) and pigs( Reference Hansen, Trakooljul and Liu 8 ). Recently, several commercial organic Mn sources including metal–amino acid complexes have been developed as supplements in livestock and poultry feed, and results from many studies demonstrated that organic Mn sources were more bioavailable than traditional Mn sulphate in pigs( Reference Jolliff and Mahan 9 , Reference Liu, Ma and Zhao 10 ) and using Caco-2 cells( Reference Li, Xie and Lu 11 ). However, there are no reports on the influence of dietary Fe concentration on the metabolism of Mn from an organic dietary Mn source.
Over the past decade, there have been several advances in our understanding of the molecular mechanisms involved in Fe absorption. In particular, two Fe transport proteins have been well characterised using in vitro and rodent models: the cellular Fe importer, divalent metal transporter-1 (DMT1), and cellular Fe exporter, ferroportin 1 (FPN1)( Reference Fleming, Romano and Su 12 , Reference Gunshin, Allerson and Polycarpou-Schwarz 13 ). Recent studies have documented a role for DMT1 in Mn uptake( Reference Thompson, Molina and Donaghey 14 – Reference Illing, Shawki and Cunningham 16 ) and the Fe exporter FPN1 in transporting Mn out of cells( Reference Yin, Jiang and Lee 17 , Reference Madejczyk and Ballatori 18 ). High dietary Fe (500 mg Fe/kg) decreased DMT1 expression in the intestine of pigs, which might have reduced Mn absorption( Reference Hansen, Trakooljul and Liu 8 ). Therefore, the aims of this study were (1) to compare the effects of dietary Fe concentration on Mn bioavailability in rats fed inorganic and organic Mn sources, and to (2) determine the effects of different Mn sources on potential Mn transporter expression in the duodenum and liver. We hypothesised that organic Mn would improve Mn bioavailability in rats, and that alterations in duodenal and hepatic DMT1 and FPN1 expression would be associated with differences in Mn bioavailability.
Methods
Animals, diets and experimental design
Care, handling and sampling procedures were approved by the Animal Care and Use Committee of Sichuan Agricultural University before initiation of the trial. A total of fifty-four 22-d-old weanling male Sprague–Dawley rats were used in a 21-d trial. The rats with mean 57·2 (sd 3·1) g average body weight were randomly assigned to one of six treatments (n 9/treatment) in a 3×2 factorial design with 3 concentrations of dietary Fe (no supplemental Fe (low Fe (L-Fe)), 35 mg of supplemental Fe (adequate Fe (A-Fe)) and 175 mg of supplemental Fe (high Fe (H-Fe))) and 2 dietary Mn sources (MnSO4 and Mn–lysine complex (MnLys)). Supplemental Fe was provided as FeSO4.H2O and Mn was supplemented at a dose of 10 mg Mn/kg diet. The MnLys is a compound with one atom of Mn chelated by two molecules of l-lysine, and it contains 13·8 % Mn (Chengdu Amino Acids Chelation Biotechnology Co. Ltd). In the MnLys molecules, the lysine binds in what is known as a glycinato manner, where a five-membered ring is formed with metal amino nitrogen and carboxylic oxygen( Reference Ashmead 19 ). The basal diet was formulated based on a modified AIN93G diet, according to recommendations( Reference Reeves, Rossow and Lindlauf 20 ) to meet the rat’s requirement for all nutrients except Fe (Table 1), and it was pelleted. The basal diet contained 2·63 mg Fe/kg diet and 1·31 mg Mn/kg diet by analysis. Rats were housed individually in an environmentally controlled room and consumed feed and water ad libitum. Rat weights were recorded on d 0 and 21. Feed consumption was recorded and feed:gain was calculated during the 21-d feeding period.
Ingredient and nutrient composition of the basal diet
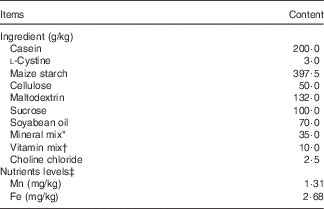
* Provided (per kg of diet): 5000 mg Ca (as calcium carbonate, anhydrous), 1600 mg P (as potassium dihydrogen phosphate), 3600 mg K (as potassium chloride), 1300 mg Na (as sodium chloride), 500 mg Mg (as magnesium oxide), 35 mg Zn (as zinc chloride), 6 mg Cu (as copper (II) chloride dehydrate), 0·21 mg I (as potassium iodate), 0·17 mg Se (as sodium selenite, anhydrous).
† Provided (per kg of diet): 0·1 mg cholecalciferol, 60 mg α-tocopherol acetate, 15 mg thiamin, 10 mg pyridoxine, 15 mg riboflavin, 10 mg folic acid, 10 mg biotin, 10 mg menadione, 4 mg retinol, 1 mg cyanocobalamin, 30 mg nicotinic acid, 50 mg pantothenic acid.
‡ Analysed values.
Sample collection
On d 21, all rats were diethyl ether anaesthetised after overnight food withdrawal, and blood was collected via cardiac puncture. Blood for Hb determination was collected in heparinised vacuum tubes and transferred to ice for analysis. Blood for serum parameter analysis was collected in vacuum tubes and allowed to clot at room temperature for 2 h before centrifugation. After blood collection, all rats were euthanised by cervical dislocation. A 4-cm segment of the duodenum (beginning from 2 cm distal to the pyloric sphincter) was removed, cut open longitudinally along the antimesenteric border and rinsed with ice-cold 0·9 % saline to remove digesta before tissue collection. The first 2 cm of exposed duodenal mucosa was scraped, and scrapings were immediately flash-frozen in liquid N2 for RNA and protein analysis. The mucosa of the remaining duodenal segment was scraped and stored at −20°C for mineral determination. One liver sample was rinsed thoroughly with PBS to remove hepatic blood contamination, wrapped in aluminium foil and flash-frozen in liquid N2, and another was stored at −20°C for mineral determination.
Blood and mineral analysis
Blood was analysed for Hb concentration using Drabkin’s reagent kits (Nanjing Jiancheng Bioengineering Institute). Serum total Fe-binding capacity (TIBC) was determined by colorimetric diagnostic kits (Nanjing Jiancheng Bioengineering Institute). Blood for serum analysis was centrifuged at 3500 g /15 min at 20°C, and serum was prepared for mineral analysis as previously described( Reference Bai, Lu and Luo 21 ). Feed, liver and mucosal scraping samples were prepared for Mn determination by the wet ashing method using microwave digestion (Mars 5; CEM Corporation), as previously described( Reference Bai, Lu and Wang 22 ). The Mn concentrations in serum, feed and tissues and serum Fe concentrations were determined by graphite furnace atomic absorption spectroscopy (PerkinElmer AA800; PerkinElmer Inc.). A bovine liver standard (NBS Standard Reference Material, USDC, Washington, DC, USA) was included in all analyses to verify the determination accuracy. The non-haeme Fe concentration in duodenal scrapings and liver was measured as described( Reference Brain, Heilig and Donaghey 23 ). Briefly, liver and duodenal scraping samples (approximately 100 μg) were digested in 2 ml of a mixture of equal volumes of 6 M-hydrochloric acid and 20 % TCA at 65°C for 20 h. After cooling to room temperature, the clear yellow solution was transferred to a test tube and a colour reagent (0·1 % sulphonated bathophenanthroline mixed with 1 % thioglycolic acid and distilled water at 1:25:25 ratio) was added. After 10-min incubation, the optical density was measured at 540 nm. A standard curve was prepared using an Fe standard solution (Nanjing Jiancheng Bioengineering Institute). The Fe concentration in tissue was expressed as μg/g wet tissue.
RNA isolation and real-time PCR
Total RNA was extracted from snap-frozen duodenum using Trizol reagent (Invitrogen) according to the manufacturer’s instructions. The RNA quality (intact ribosomal RNA 28s/18s) was evaluated by agarose gel electrophoresis, and RNA concentrations were quantified using a spectrophotometer (NanoDrop 2000; Thermo Fisher Scientific Inc.). First-strand complementary DNA (cDNA) was reverse-transcribed from 200 ng of total RNA using the PrimeScript™ RT Reagent Kit (Takara). Real-time PCR was performed in triplicate on an ABI 7500 Real-Time PCR detection system (Applied Biosystems). Real-time PCR was performed in 10-μl volume reactions that contained 3 μl of 10-fold diluted cDNA, 1 μl each of 5 μm forward and reverse primers and 5 μl of 1×SYBR Green Master Mix (Takara). The cycling program was 95°C/15 min, followed by forty cycles of 95°C/5 s and 60°C/30 s, and a final melting curve analysis. The primer sequences for DMT1, FPN1, transferrin receptor 1 (TFR1), hepcidin (HAMP) and β-actin are displayed in online Supplementary Table S1. Gene-specific amplification was determined by melting curve analysis and agarose gel electrophoresis. Relative quantities of mRNA were calculated using the $2^{{{\minus}\Delta \Delta C_{t} }} $
method with the quantity of the A-Fe with MnSO4 diet group scaled to 1(
Reference Livak and Schmittgen
24
). Three housekeeping genes (glyceraldehyde-3-phosphate dehydrogenase, ribosomal protein S9 and β-actin) were assessed for stability of expression using two separate cDNA from each treatment (data not shown). The β-actin was subsequently selected as the reference gene(
Reference Li, Xie and Lu
11
,
Reference Bai, Lu and Luo
21
).
$2^{{{\minus}\Delta \Delta C_{t} }} $
method with the quantity of the A-Fe with MnSO4 diet group scaled to 1(
Reference Livak and Schmittgen
24
). Three housekeeping genes (glyceraldehyde-3-phosphate dehydrogenase, ribosomal protein S9 and β-actin) were assessed for stability of expression using two separate cDNA from each treatment (data not shown). The β-actin was subsequently selected as the reference gene(
Reference Li, Xie and Lu
11
,
Reference Bai, Lu and Luo
21
).
Protein extraction and immunoblotting
The isolation of protein from duodenal scrapings and liver was performed as previously described( Reference Hansen, Trakooljul and Liu 8 ). Briefly, approximately 0·4 g of tissue sample was homogenised supersonically in 3 ml of lysis buffer (20 mm-Tris-HCl, 150 mm-NaCl, 2 mm-Na2EDTA, 1 % NP-40 (v/v), 0·5 % sodium deoxycholate (w/v), 0·1 % SDS (w/v) and a protease inhibitor cocktail). After centrifugation at 10 000 g for 30 min at 4°C, the supernatant was collected. Protein concentrations in the supernatant were determined using bicinchoninic acid protein assay kits (Thermo Fisher Scientific Inc.).
For Western blot analysis, all supplies and reagents were from Bio-Rad Laboratories Inc. and all antibodies and positive control proteins were from Santa Cruz Biotechnology Inc., unless otherwise stated. In total, 40 µg of protein was loaded into each well after heating for 5 min at 95°C. Proteins were separated by 10 % SDS-PAGE at 125 V for 90 min and transferred onto a polyvinylidene diflouride membrane at 20 V for 5 min (Trans Blot Turbo transfer system; Bio-Rad). Molecular weight standards (Takara) were loaded in parallel on each gel. Similar loading and transfer of proteins were verified by staining the blots with Ponceau S (Sigma-Aldrich) after transfer. Membranes were blocked using 5 % non-fat milk in a solution of Tris-buffered salt with Tween-20 (TBST; 137 mm-NaCl, 2·7 mm-KCl, 19 mm-Tris-HCl pH 7·5 and 0·1 % Tween-20) for 2 h at room temperature. The membranes were then probed with polyclonal goat anti-FPN1 (catalogue no. sc-49668; dilution 1:500) or rabbit anti-DMT1 (catalogue no. sc-30120; dilution 1:100) overnight at 4°C. After incubation with the primary antibody, and washing with TBST buffer (three times; 15 min each time), membranes were incubated with goat anti-rabbit (catalogue no. sc-2004; dilution 1:5000) or donkey anti-goat (catalogue no. sc-2020; dilution 1:5000) secondary antibody-conjugated horseradish peroxidase for 2 h at room temperature. After washing with TBST (three times; 15 min each time) and water (two times; 5 min each time), the signal of membranes was visualised by enhanced chemiluminescence (ECL) (PerkinElmer). The human neuroblastoma cell lysate (catalogue no. sc-2409) and human jejunum smooth muscle cells (catalogue no. sc-2229) were used as the positive controls for DMT1 and FPN1 protein determination, respectively. The blots were detected using the chemiluminescence imaging system (ChemiDoc MP System; Bio-Rad) and quantified by transmittance densitometry using volume integration with the ImageJ analysis software (National Institutes of Health). After ECL detection, the membranes were incubated at 50°C for 30 min in stripping solution (100 mmol/l β-mercaptoethanol, 2 % SDS, 62·5 mmol/l Tris-HCl, pH 6·8) and then re-probed with rabbit polyclonal anti-β-actin (catalogue no. sc-130657; dilution 1:2000) to assure equal loading of protein. The DMT1 and FPN1 protein concentrations in each specimen were normalised to β-actin abundance.
Statistical analysis
Data were analysed by two-way ANOVA using the Glimmix procedure of SAS 9.2 (SAS Institute). The statistical model included the main effects of dietary Fe level, Mn source and their interaction. The individual animal served as the experimental unit (n 9 or 6 per treatment). For all data, when the ANOVA was significant, post hoc comparisons of treatment means were carried out with Tukey’s test. All data are presented as mean values with their standard errors. Statistical significance was assigned at P<0·05.
Results
Performance
Final body weight and body weight gain were higher (P<0·03) in the MnLys-fed rats than in the MnSO4-fed rats (Table 2). The H-Fe diet decreased (P<0·03) the final body weight and body weight gain as compared with the A-Fe diet. Feed intake was lower (P=0·006) in H-Fe rats and tended to be lower (P<0·10) in L-Fe rats than in A-Fe rats. Feed efficiency was not significantly affected by Mn source, dietary Fe level or their interaction.
Effect of dietary iron concentration and manganese source on performance of rats from 22 to 42 d of age (Mean values with their standard errors; n 9)

MnLys, Mn–lysine complex; L-Fe, the basal diet (2·68 mg Fe/kg); A-Fe, the basal diet supplemented with 35 mg Fe/kg diet (adequate Fe level); H-Fe, the basal diet supplemented with 175 mg Fe/kg diet (high Fe level); IBW, initial body weight; FBW, final body weight; BWG, body weight gain; FI, feed intake.
* Mean values differ from the corresponding A-Fe group, P<0·05.
Blood or serum indices
Serum Fe increased, whereas serum TIBC decreased (P<0·05) with increasing dietary Fe concentration, irrespective of the Mn source (Table 3). Blood Hb also increased with increasing dietary Fe concentration, although blood Hb concentration in A-Fe rats did not differ in H-Fe rats when fed the MnLys diet. Consumption of the MnLys diet increased (P<0·05) blood Hb concentration as compared with the MnSO4 diet for A-Fe rats. Serum Mn was higher (P<0·05) in rats fed the MnLys diet than in those fed the MnSO4 diet. The Mn source and interaction between the Mn source and dietary Fe concentration did not influence (P>0·10) blood Hb, serum Fe and serum TIBC concentrations in rats.
Effect of dietary iron concentration and manganese source on the blood or serum parameters of 42-d-old rats after 21 d of feeding (Mean values with their standard errors; n 6)
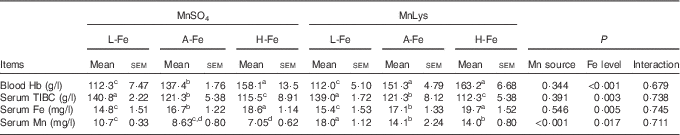
MnLys, Mn–lysine complex; L-Fe, the basal diet (2·68 mg Fe/kg); A-Fe, the basal diet supplemented with 35 mg Fe/kg diet (adequate Fe level); H-Fe, the basal diet supplemented with 175 mg Fe/kg diet (high Fe level); TIBC, total Fe-binding capacity.
a,b,c,d Mean values within a column with unlike superscript letters were significantly different (P<0·05).
Iron and manganese concentrations in duodenum and liver
Duodenal Mn concentrations were greater (P<0·001) in rats fed the MnLys diet than in those fed the MnSO4 diet (Table 4). The A-Fe and H-Fe rats had reduced (P<0·001) duodenal Mn concentrations as compared with L-Fe rats. Duodenal Mn concentrations in the A-Fe or H-Fe with MnLys groups were similar to the values in the L-Fe with MnSO4 group. Liver Mn concentration was not affected (P>0·13) by Mn source, dietary Fe level and their interaction. The non-haeme Fe concentrations in duodenum and liver increased (P<0·001) from L-Fe to A-Fe to H-Fe rats. Duodenal non-haeme Fe concentrations were lower (P=0·007) in the MnLys treatment group than in the MnSO4 treatment group for A-Fe rats, but it did not differ (P>0·15) between the two Mn sources for L-Fe or H-Fe rats. The Mn source did not influence (P>0·10) liver Fe concentrations.
Effect of dietary iron concentration and manganese source on manganese and iron concentrations in the tissues of 42-d-old rats after 21 d of feeding (Mean values with their standard errors; n 6)
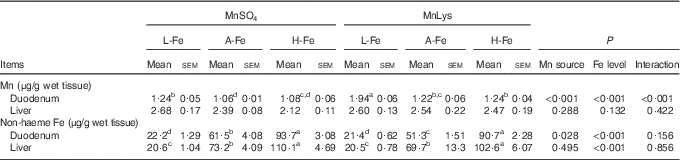
MnLys, Mn–lysine complex; L-Fe, the basal diet (2·68 mg Fe/kg); A-Fe, the basal diet supplemented with 35 mg Fe/kg diet (adequate Fe level); H-Fe, the basal diet supplemented with 175 mg Fe/kg diet (high Fe level).
a,b,c,d Mean values within a column with unlike superscript letters were significantly different (P<0·05).
Gene expression in the duodenum and liver
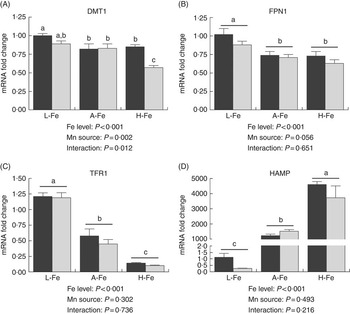
In the duodenum, the relative abundance of DMT1 mRNA was lower (P<0·001) in A-Fe or H-Fe rats compared with L-Fe rats. Duodenal DMT1 mRNA was greater (P<0·04) in the MnLys group than in the MnSO4 group for A-Fe rats, but no significant difference was observed (P>0·10) between the two Mn sources for L-Fe or H-Fe rats (Fig. 1(a)). Duodenal FPN1 mRNA was not influenced (P>0·20) by Mn source, dietary Fe level or their interaction (Fig. 1(a)).
Effect of dietary Fe concentration and Mn source on the mRNA abundance of divalent metal transporter-1 (DMT1) (A) and ferroportin 1 (FPN1) (B) in the duodenum of rats. The weanling rats (22-d-old) were fed the basal diet (L-Fe; containing 2·68 mg Fe/kg) or the basal diet supplemented with 35 mg/kg (A-Fe) or 175 mg/kg (H-Fe) Fe in combination with 10 mg/kg Mn (adequate level) from MnSO4 or Mn–lysine complex (MnLys) for 21 d. The mRNA abundance was determined by real-time quantitative PCR. Data are presented in arbitrary units as relative mRNA abundance normalised to β-actin transcript abundance, and the average expression of duodenal target gene mRNA relative to the average of the L-Fe with MnSO4 group as a calibrator. Data were analysed by two-way ANOVA, and the statistical model included the main effects of dietary Fe level, Mn source and their interaction. The post hoc comparisons of treatment means were carried out with Tukey’s test. Values are means with their standard errors represented by vertical bars. a,b,c Mean values (n 6) with unlike letters were significantly different (P<0·05). ![]() , L-Fe;
, L-Fe; ![]() , A-Fe;
, A-Fe; ![]() , H-Fe.
, H-Fe.

In the liver, the relative abundance of DMT1 mRNA was higher (P<0·001) in the MnLys group than in the MnSO4 group for H-Fe rats, whereas no significant difference was observed (P>0·10) between the two Mn sources for L-Fe or A-Fe-fed rats (Fig. 2(a)). The expression of FPN1 mRNA was lower (P<0·001) in A-Fe and H-Fe rats than in L-Fe rats (Fig. 2(a)). Consumption of the MnLys diet tended to decrease (P=0·056) hepatic FPN1 mRNA as compared with consumption of the MnSO4 diet. Liver TFR1 mRNA decreased (P<0·001), whereas HAMP mRNA increased (P<0·001) from L-Fe to A-Fe rats, to H-Fe rats, irrespective of the Mn source (Fig. 2(c) and (d)). The Mn source and interaction between the Mn source and dietary Fe did not affect (P>0·30) hepatic expression of TFR1 and HAMP mRNA.
Effect of dietary Fe concentration and Mn source on the mRNA abundance of divalent metal transporter-1 (DMT1) (A), ferroportin 1 (FPN1) (B), transferrin receptor 1 (TFR1) (C) and hepcidin (HAMP) (D) in the liver of rats. The weanling rats (22-d-old) were fed the basal diet (L-Fe; containing 2·68 mg Fe/kg) or the basal diet supplemented with 35 mg/kg (A-Fe) or 175 mg/kg (H-Fe) Fe in combination with 10 mg/kg Mn (adequate level) from MnSO4 or Mn–lysine complex (MnLys) for 21 d. The mRNA abundance was determined by real-time quantitative PCR. Data are presented in arbitrary units as relative mRNA abundance normalised to β-actin transcript abundance, and the average expression of duodenal target gene mRNA in the L-Fe with MnSO4 group was used as a calibrator. Data were analysed by two-way ANOVA, and the statistical model included the main effects of dietary Fe level, Mn source and their interaction. The post hoc comparisons of treatment means were carried out with Tukey’s test. Values are means with their standard errors represented by vertical bars. a,b,c Mean values (n 6) with unlike letters were significantly different (P<0·05). ![]() , MnSo4;
, MnSo4; ![]() , MnLys.
, MnLys.
Transporter protein abundance
Duodenal DMT1 and FPN1 protein decreased (P<0·001) in H-Fe rats as compared with L-Fe rats (Fig. 3). Duodenal DMT1 protein was lower (P<0·001) in the MnLys group than in the MnSO4 group for A-Fe rats, but it did not differ (P>0·10) between the two Mn sources for L-Fe or H-Fe rats (Fig. 3(a)). Duodenal FPN1 protein was lower (P<0·001) in rats that were fed the MnLys diet compared with the MnSO4 diet in combination with A-Fe or H-Fe treatment, but it did not differ (P>0·10) between the two Mn sources in rats that consumed the L-Fe diet (Fig. 3(b)). The apparent molecular mass of DMT1 and FPN1 as estimated by SDS-PAGE was approximately 53 and 64 kDa, respectively, similar to the predicted molecular weight based on the amino acid sequence of rat DMT1 (52 kDa) and FPN (62 kDa)( Reference Urrutia, Aguirre and Esparza 25 ).
Effect of dietary Fe concentration and Mn source on the protein expression of divalent metal transporter-1 (DMT1) (A) and ferroportin 1 (FPN1) (B) in the duodenum of rats. The weanling rats (22-d-old) were fed the basal diet (L-Fe; containing 2·68 mg Fe/kg) or the basal diet supplemented with 35 (A-Fe) or 175 (H-Fe) mg/kg Fe in combination with 10 mg/kg Mn (adequate level) from MnSO4 or Mn–lysine complex (MnLys) for 21 d. The DMT1 and FPN1 protein quantities were determined by western blotting. Data are presented in arbitrary units relative to β-actin protein. Data were analysed by two-way ANOVA, and the statistical model included the main effects of dietary Fe level, Mn source and their interaction. The post hoc comparisons of treatment means were carried out with Tukey’s test. Values are means with their standard errors represented by vertical bars. a,b,c Means (n 6) with unlike letters were significantly different (P<0·05). Representative blots of DMT1, FPN1 and β-actin are shown. ![]() , L-Fe;
, L-Fe; ![]() , A-Fe;
, A-Fe; ![]() , H-Fe.
, H-Fe.

Liver DMT1 protein was lower (P<0·001) in A-Fe or H-Fe rats than in L-Fe rats (Fig. 4(a)). Consumption of the MnLys diet decreased (P=0·004) hepatic DMT1 protein compared with the MnSO4 diet at all dietary Fe concentrations. The FPN1 protein decreased (P<0·05) with increasing dietary Fe concentration in rats that consumed the MnSO4 diet, whereas no difference (P>0·10) was observed in rats fed the MnLys diet with different Fe concentrations (Fig. 4(b)). Consumption of the MnLys diet decreased (P<0·05) liver FPN1 protein as compared with the MnSO4 diet for L-Fe, whereas there was no difference (P>0·12) between the Mn sources for A-Fe or H-Fe rats.
Effect of dietary Fe concentration and Mn source on the protein abundance of divalent metal transporter-1 (DMT1) (A) and ferroportin 1 (FPN1) (B) in the liver of rats. The weanling rats (22-d-old) were fed the basal diet (L-Fe; containing 2·68 mg Fe/kg) or the basal diet supplemented with 35 mg/kg (A-Fe) or 175 mg/kg (H-Fe) Fe in combination with 10 mg/kg Mn (adequate level) from MnSO4 or Mn–lysine complex (MnLys) for 21 d. The DMT1 and FPN1 proteins were determined by western blotting. Data are presented in arbitrary units relative to β-actin protein. Data were analysed by two-way ANOVA, and the statistical model included the main effects of dietary Fe level, Mn source and their interaction. The post hoc comparisons of treatment means were carried out with Tukey’s test. Values are means with their standard errors represented by vertical bars. a,b,c Means (n 6) with unlike letters were significantly different (P<0·05). Representative blots of DMT1, FPN1 and β-actin are shown. ![]() , L-Fe;
, L-Fe; ![]() , A-Fe;
, A-Fe; ![]() , H-Fe.
, H-Fe.

Discussion
The weanling rats display rapid growth and thus have a high demand for Fe; therefore, the practical diets often contain concentrations exceeding Fe requirements. In this study, we fed the rats with the L-Fe diet (2·68 mg Fe/kg diet) for 21 d to achieve an Fe deficiency as evaluated by traditional measures of Fe status (Hb and serum Fe), consistent with a previous report that feeding an Fe-deficient diet to rats for 17 d led to anaemia( Reference Kamei, Watanabe and Ishijima 26 ). The H-Fe diet increased the Fe status in rats, whereas increased Hb concentrations were still within the normal physiological range (137–176 g/l) in the present study( Reference Azebedo, Willis and Turcotte 27 , Reference Klempa, Willis and Chengson 28 ). However, the H-Fe diet decreased the growth performance of rats during the 21-d experimental period relative to the A-Fe diet.
The DMT1 appears to be the predominate protein involved in non-transferrin bound Fe2+ uptake by the cell( Reference Zoller, Theurl and Koch 29 , Reference Foot, Dalton and Shearwin-Whyatt 30 ). In this study, the increase in intestinal DMT1 mRNA and protein expression in L-Fe rats was likely reflective of the rat’s L-Fe status and increased need for dietary Fe to meet their requirements. We also found a strong negative correlation between liver Fe concentration and duodenal DMT1 expression in H-Fe rats, suggesting that the high body Fe stores were signalling reductions in intestinal Fe transport( Reference Hansen, Trakooljul and Liu 8 ). In recent years, the liver-derived hormone HAMP has emerged as the link between Fe stores and regulation of intestinal Fe transport( Reference Nemeth, Tuttle and Powelson 31 ). Marked increases in HAMP mRNA expression in the liver of H-Fe rats reflect H-Fe stores, resulting in the reduction of intestinal Fe transport into circulation. HAMP binds to FPN1 on the basolateral membrane of enterocytes, causing FPN1 to be internalised and degraded to decrease export of Fe into plasma( Reference De Domenico, Ward and Langelier 32 ). Concurrent with the rise in hepatic HAMP expression, the decrease in intestinal FPN1 protein in H-Fe rats in the present study also suggested that the hepcidn-FPN1 axis has an important role in Fe haemostasis regulation( Reference Nemeth and Ganz 33 ). However, consumption of the H-Fe diet for 21 d was not associated with decreased duodenal FPN1 mRNA in this study, inconsistent with the previous reports that short-term (4–10 d) Fe loading reduced intestinal FPN1 mRNA in mice( Reference Abboud and Haile 34 , Reference McKie, Marciani and Rolfs 35 ). This discrepancy was likely because of the difference in Fe loading term, as McKie et al. ( Reference McKie, Marciani and Rolfs 35 ) reported that intestinal FPN1 mRNA expression was not regulated in mice by chronic dietary Fe loading (4 weeks). The results presented herein show that the major mechanism of regulating intestinal FPN1 expression is translational regulation. Body HAMP secreted by the liver in response to high serum Fe down-regulated FPN1 at the protein level( Reference Nemeth and Ganz 33 ) and thereby limited Fe absorption from the diet in H-Fe rats.
Dietary Fe concentration may interfere with tissue metabolism of other trace elements including Mn( Reference Hansen, Trakooljul and Liu 8 , Reference Roth and Garrick 36 , Reference Hansen, Ashwell and Moeser 37 ). In this study, consumption of the L-Fe diet increased Mn status as indicated by the biomarker of Mn availability (serum Mn)( Reference Roth and Garrick 36 , Reference Ji, Luo and Lu 38 ), as compared with the A-Fe and H-Fe diets. The decrease in serum Mn suggests that the H-Fe diet decreased intestinal Mn absorption, consistent with what has been reported for pigs and calves( Reference Hansen, Trakooljul and Liu 8 , Reference Hansen, Ashwell and Moeser 37 ). However, as compared with the L-Fe diet, consumption of the H-Fe diet did not alter liver Mn concentrations in the present study. The liver has a vital role in regulating Mn levels because in vivo studies showed that the liver is the major route for Mn elimination( Reference Davis, Zech and Greger 39 – Reference Roth 41 ). Increased serum Mn was associated with greater biliary Mn excretion in rats( Reference Davis, Zech and Greger 39 , Reference Malecki, Radzanowski and Radzanowski 40 ). In the present study, no difference in liver Mn retention could be because of the difference in Mn excretion in rats with a different Fe status.
In addition to transporting Fe, DMT1( Reference Gunshin, Allerson and Polycarpou-Schwarz 13 , Reference Roth and Garrick 36 ) and FPN1( Reference Kim, Li and Buckett 15 , Reference Madejczyk and Ballatori 18 ) can transport several other divalent metals, including Mn. In this study, the H-Fe diet decreased Mn concentrations in the serum and duodenum, and down-regulated duodenal DMT1 and FPN1 protein expression as compared with the L-Fe diet, suggesting a possible role for DMT1 and FPN1 in the antagonism between Fe and Mn in the intestine of rats. It is possible that the reduction in serum Mn concentrations resulted from a combination of reduced intestinal DMT1 and FPN1 expression and increased competition between Fe and Mn for uptake in H-Fe rats. The decrease in duodenal Mn concentration in rats that consumed the H-Fe diet was partially because of decreased duodenal DMT1 expression.
Neither the Association of Official Analytical Chemists( Reference Patricia 42 ) nor the Association of American Feed Control Officials( 43 ) has approved specific methods to test the complex bonding of a mineral element to an organic ligand. No direct evidence about the mechanism of Mn absorption from a Mn–amino acid chelate is reported. Therefore, we indirectly studied the absorption of Mn from different Mn sources under different Fe status. The results presented herein showed that the H-Fe diet decreased the availability of Mn from MnSO4 and MnLys, which suggests that the Mn from MnLys was at least partly absorbed as ionised Mn2+ through intestinal Fe transporters. However, the MnLys was more bioavailable than MnSO4 for the weaning rats, as demonstrated by the biomarker of Mn availability (serum Mn). This result is consistent with previous studies in broiler chickens( Reference Bai, Lu and Luo 21 , Reference Bai, Lu and Wang 22 ). The MnLys could resist interference from dietary and nutritional factors such as phosphate, phytate and other compounds to bind ionised Mn in the digestive tract and directly reach the intestinal brush border, where it is hydrolysed and is more likely to bind transporters( Reference Ji, Luo and Lu 44 ), which might partially explain the increased availability of Mn from a MnLys complex. However, our data showed that the MnLys diet reduced duodenal DMT1 and FPN1 protein expression in rats as compared with the MnSO4 diet. A decrease in DMT1 expression was observed in ligated duodenal loops of chickens( Reference Bai, Lu and Wang 22 ) and Caco-2 cells( Reference Li, Xie and Lu 11 ) after treatment with relatively high concentrations of Mn. It is possible that the higher serum Mn induced the down-regulation of intestinal DMT1 and FPN1 expression, as described by Bai et al.( Reference Bai, Huang and Luo 45 ), who reported that greater plasma Mn was associated with decreased DMT1 and FPN1 transcription in hens. The decrease in duodenal DMT1 and FPN1 may decrease intestinal Mn export to the serum in MnLys rats, which suggests that DMT1 and FPN1 were not responsible for the greater bioavailability of Mn from MnLys. Ashmead et al.( Reference Ashmead 46 ) reported that the complexed or chelated minerals can be absorbed intact, and that the metal atoms remain safely bound or protected within the organic molecular structure or ligands during absorption. The amino acid carriers are involved in the transport of Cu in the Cu–amino acid complex, as shown using the Caco-2 cell line model( Reference Gao, Yin and Xu 47 ). It is possible that there are other transporters or transport systems involved in the uptake of MnLys, which then contributes to the relatively higher serum Mn concentration in MnLys rats.
In conclusion, dietary Fe concentration affected the availability of Mn regardless of the Mn source, and MnLys was more bioavailable than MnSO4 in the small intestine of rats. However, consumption of the MnLys diet, as compared with MnSO4, was associated with decreased expression of DMT1 and FPN1 protein in the duodenum, which might decrease Mn transport from the MnLys complex. These results suggest that there are other transporters or transport pathways for the MnLys complex in the small intestine of rats.
Acknowledgements
The present study was supported by the Program of the National Natural Science Foundation of China (grant number 31001018), and Specific Research Team Supporting Program of Sichuan Agricultural University (grant number SAU2012SRTSP12).
H. Z. and S. B. designed the research. H. Z., J. W. and Q. Z. conducted the research. E. R. G., K. Z, X. D and S. B. collected and analysed data. H. Z., E. R. G. and S. B. wrote the paper. All authors read and approved the final manuscript.
The authors declare that they have no conflicts of interest.
Supplementary Material
For supplementary material/s referred to in this article, please visit http://dx.doi.org/doi:10.1017/S0007114515004900


