


1. Introduction
Customer needs analysis is essential for successful product design and improvement (Sikhwal and Childs, Reference Sikhwal and Childs2021). In recent years, importance-performance analysis (IPA) has been widely used for needs analysis, product positioning, and strategic planning (Matzler et al., Reference Matzler, Bailom, Hinterhuber, Renzl and Pichler2004; Feng et al., Reference Feng, Mangan, Wong, Xu and Lalwani2014). This method divides product attributes into four categories with different priorities for improvement so that designers can take tailored actions when design improvements are needed. For those product attributes that matter greatly to customers but have poor performance or satisfaction levels in the market, designers are suggested to prioritize optimizing them.
Previous research with IPA usually uses customer surveys as the main data source (Oh, Reference Oh2001; Feng et al., Reference Feng, Mangan, Wong, Xu and Lalwani2014). Surveys can provide detailed information about customers’ opinions toward products, but their collection usually costs a certain amount of time, money, and human resources. Online reviews are becoming more popular in recent studies as they can be collected at a lower cost (Thakur, Reference Thakur2018). Besides, the amount of online reviews is growing rapidly, and they can reflect customers’ thoughts and preferences longitudinally and support better design decisions (Jin et al., Reference Jin, Liu, Ji and Kwong2019). Nevertheless, both customer surveys and online reviews carry unavoidable subjective bias (Guo et al., Reference Guo, Xue, Yu and Shen2019). In addition, customers with complaints about products are more likely to express their opinions online, while most of those satisfied with products may be reluctant to voice their opinions in public, which may weaken the representativeness of online reviews (Dellarocas, Reference Dellarocas2003). In contrast, product maintenance records provide information on product quality and failure patterns, which can reveal the performance and durability of a product more objectively. These insights can be cross-validated with customers’ personal experiences from online reviews, which will contribute to a more comprehensive analysis of product attributes.
However, few studies have explored analyzing and combining the results from these two sources of data (i.e., subjective online reviews and objective maintenance records) for a more comprehensive IPA. In addition, previous studies seldom consider validating the IPA results, and a quantitative measure of the validity of IPA results is lacking. To fill these gaps, in this paper, we propose an integrated framework to conduct the IPA of product attributes from online reviews and maintenance records jointly. The textual information from these two data sources is processed and analyzed in a unified and systematic way. The obtained IPA results are then validated by comparing with the actual improvement of products on the market, or with the analysis of customer reviews from a different time period.
In our framework, keywords on product attributes are first identified from online reviews using a keyword extraction method based on the term frequency-inverse document frequency (TF-IDF) algorithm after sentence segmentation and part-of-speech tagging. Then, these keywords are embedded and classified into product attributes by the X-means clustering method. A similar procedure is applied to the product maintenance records, and the identified product attributes are corrected by fusing the results of these two data sources. After that, semantic groups consisting of product attributes with associated descriptions are established by dependency parsing analysis. The sentiment scores of identified attributes are calculated by a voting mechanism using two pre-trained models, enhanced representation through knowledge integration (ERNIE) and bi-directional long short-term memory (BiLSTM). The importance of the product attributes is estimated from the impact of sentiments of each product attribute on the product rating, in which the XGBoost classifier is applied to fit the model. The performance of product attributes can be the sentiment scores calculated from online reviews or the quality statistics of product maintenance records. Then, the resulting IPA plots can provide suggestions for product improvement.
A case study of passenger vehicles in China’s auto market is presented to demonstrate the proposed framework. A novel rule-based semantic group generation method is developed to support the opinion-term extraction from text. These rules are defined based on fundamentals from linguistics and semantics as well as our preliminary studies. Moreover, the practicability of our IPA results is validated. The validated IPA results from online reviews and maintenance records are then integrated, leading to a more comprehensive understanding of product attributes and customer needs. The proposed framework enables automatic data processing and can support companies in making efficient and more accurate design decisions from multisource data.
The remaining parts of this paper are organized as follows. Section 2 reviews previous work in IPA with associated key techniques such as performance and importance calculation and sentiment analysis. Section 3 introduces the proposed framework and explains related key approaches in data preprocessing, attribute identification, semantic group generation, sentiment analysis, IPA analysis, and results validation. Section 4 introduces the case study, and Section 5 presents the identified product attributes and the IPA results obtained from online reviews and product maintenance records. Section 6 provides the validation of the case study results and discusses their potential implications for vehicle designers. Section 7 presents the integration of obtained IPA results from different data sources. Section 8 discusses the results of the case study and potential applications of the framework. Section 9 concludes the study and provides suggestions for future work.
2. Related work
In this section, previous research in IPA and associated key techniques, including performance and importance calculation and sentiment analysis, are reviewed.
2.1. Importance-performance analysis
IPA is a classical method in marketing and strategic decision-making for product or service design. It was first proposed by Martilla and James in 1977 (Martilla and James, Reference Martilla and James1977). They developed this method to evaluate customers’ satisfaction with products by balancing the performance and importance of product attributes. They demonstrated the application of this method in the design improvement of automobiles with data collected from customer questionnaires. Nowadays, IPA has been applied successfully in many fields, including healthcare, education, tourism, etc. (Oh, Reference Oh2001; Nazari-Shirkouhi et al., Reference Nazari-Shirkouhi, Mousakhani, Tavakoli, Dalvand, Šaparauskas and Antuchevičienė2020; Wang et al., Reference Wang, Zhang, Zhao, Lu and Peng2020).
Traditional IPA studies usually use customer surveys as the main data source. For example, O’Neill and Palmer (Reference O’Neill and Palmer2004) applied IPA to improve the service quality of higher education with survey data collected from students. Yavas and Shemwell (Reference Yavas and Shemwell2001) utilized IPA to investigate the competition between hospitals in the healthcare market with survey data. The main advantage of using survey data is that surveys are predesigned, and researchers can get their expected information in a controlled means. In addition, the data processing for survey data is convenient for researchers since many questions in surveys are structured, such as multichoice or binary-choice questions. However, survey data can be expensive as it costs a certain amount of time, money, and human labor in the collection process.
To remedy this, recent IPA studies employ online reviews as the main data source. Online reviews contain a massive amount of information about customers’ use experience, opinions, and thoughts on products, and they can be quickly collected at a large scale at a low cost. Bi et al. (Reference Bi, Liu, Fan and Zhang2019) performed IPA for accommodation services and discussed service attributes with an urgent need for improvement using online reviews from travelers. Joung and Kim (Reference Joung and Kim2021) conducted IPA for the design improvement of smartphones with review data collected from an online shopping platform. Chen et al. (Reference Chen, Becken and Stantic2022) applied IPA to evaluate tourists’ satisfaction with several aspects of travel, such as environment, transportation, and accommodation, by mining social media text. However, online reviews are often unstructured, and their contents are not controlled. In addition, online reviews are subjective, and their representativity is limited since many customers are not likely to post their opinions on products online after purchase. Therefore, it is necessary to develop a new IPA framework to integrate subjective reviews and objective data, such as maintenance records to better understand customer needs.
2.2. Performance and importance calculation
The key step in IPA is the calculation of performance and importance. In most cases, performances are evaluated directly from surveys or online reviews. For the surveys, performances can be measured by asking respondents to rate the product in various aspects with a Likert scale (Abalo et al., Reference Abalo, Varela and Manzano2007). For online reviews, the performances can be evaluated by the average sentiment scores extracted from the reviews corresponding to each product attribute.
Compared to performance, the calculation methods for importance are more diverse. These methods can be divided into two types: direct and indirect. The direct method often asks respondents to rate or score the importance of product attributes in surveys (Azzopardi and Nash, Reference Azzopardi and Nash2013). Obviously, this method is convenient for data processing, and it can also collect respondents’ demographics or other influencing characteristics to support the in-depth analysis of the heterogeneity of customer preferences. However, customers may not always provide their true thoughts in the surveys, especially under social influence or pressure. Also, importance rating problems can make questionnaires too long, which may cause the tiredness of respondents.
Indirect methods for importance calculation are mostly based on statistical modeling, such as regression analysis, correlation analysis, and conjoint analysis (Azzopardi and Nash, Reference Azzopardi and Nash2013). For online reviews, since customers’ preferences are inferred from the textual data, indirect calculation methods are utilized. For example, Joung and Kim (Reference Joung and Kim2021) proposed to define the importance of a product attribute as the influence of the sentiments of this product attribute on customers’ overall product rating. They applied an explainable deep neural network to predict the final rating using sentiment scores and evaluate the attribute importance (Joung and Kim, Reference Joung and Kim2021). In our study, the XGBoost model is selected in this modeling process due to its better prediction accuracy and interpretability.
2.3. Sentiment analysis
As mentioned above, in the performance evaluation using data from online reviews, sentiment analysis is a critical technique. We expect to extract customers’ sentiment on each product attribute with corresponding sentiment polarities. This fine-grained sentiment analysis is called aspect-based sentiment analysis (ABSA). In ABSA, those frequently mentioned keywords by customers are aspect terms, and the clusters of related keywords (i.e., product attributes) are aspect categories. Term opinion and sentiment polarities are analyzed at the aspect level. With different inputs and outputs, ABSA can be divided into various tasks, such as opinion term extraction (OTE), aspect sentiment classification (ASC), and aspect–opinion pair extraction (Zhang et al., Reference Zhang, Li, Deng, Bing and Lam2022).
With the rapid development of machine learning and pre-trained language models in recent years, more advanced models have been developed for ABSA tasks. These models often use multilayer neural networks trained with labeled datasets. For example, Li et al. (Reference Li, Chen, Feng, Ma, Wang and Hovy2021) propose dual graph convolutional neural networks to learn both the syntax and the semantic correlations in the sentences. Their accuracy of aspect sentiment classification can achieve about 85% in the restaurant dataset and 80% in the laptop dataset. Both datasets are famous in the area of sentiment analysis on customer reviews, provided by SemEval (Pontiki et al., Reference Pontiki, Galanis, Papageorgiou, Androutsopoulos, Manandhar and AL-Smadi2016; Zhang et al., Reference Zhang, Li, Deng, Bing and Lam2022). Devlin et al. (Reference Devlin, Chang, Lee and Toutanova2018) introduced the Bidirectional Encoder Representations from Transformers (BERT) for sentence pair classification. The application of BERT greatly improved the generalization capability and the robustness of ABSA models (Zhang et al., Reference Zhang, Li, Deng, Bing and Lam2022).
These supervised learning models often perform better in the classification and identification of sentiments compared to unsupervised ones. However, achieving this performance requires professionally and objectively annotated datasets, and preparing such datasets is expensive in time and labor. Also, models trained with datasets from one domain may not simply apply to other domains. Therefore, many customer studies with online reviews choose to use unsupervised sentiment analysis methods, such as sentiment dictionaries, to match sentiment-related words in sentences with final sentiment intensities (Wang et al., Reference Wang, Wang and Song2017; Zheng et al., Reference Zheng, Wang and Gao2018; Kwon et al., Reference Kwon, Ban, Jun and Kim2021; Siddharth et al., Reference Siddharth, Blessing and Luo2022). However, using sentiment dictionaries can result in the same sentiment intensity for a keyword in different contexts, while the semantic relations of keywords in sentences are not considered. To reduce such bias, we propose a rule-based semantic group generation method to support the opinion-term extraction without requiring pre-labeled data. Then, existing sentiment analysis models can be applied to the generated semantic groups to evaluate customers’ sentiment polarities on product attributes.
3. An integrated framework for IPA of product attributes and validation
We propose an integrated framework for IPA of product attributes from online reviews and product maintenance records as shown in Figure 1. The theoretical foundation of our framework comes from previous studies on customer need analysis using online reviews, such as Joung and Kim (Reference Joung and Kim2021) and Chen et al.’s (Reference Chen, Becken and Stantic2022) work. Our framework shares a similar general structure to their analysis frameworks (e.g., data collection and filtering, attribute identification, and performance and importance estimation). However, previous studies only utilize online reviews and their analysis results are not validated for the application, while our framework is an integrated framework that can process multisource data with a validation process. The framework includes four main stages: data collection and preprocessing, key information extraction, importance and performance analysis, and results validation and integration. We first collect customer reviews and product maintenance records from online shopping platforms and data service companies, respectively. Then, key information is extracted from the preprocessed data, including the product attributes mentioned and customers’ attitudes toward these attributes. Methods of product attribute identification, semantic group generation, and sentiment analysis are developed or leveraged to support this process. After that, we perform the IPA based on sentiment scores and the quality statistics of the identified attributes from online reviews and maintenance records. These IPA results can support the improvement of product design. The IPA results are validated by comparing them with the actual product improvements on the market or with the analysis of customer reviews from different time periods. The validated IPA results from two data sources are then assigned different weights and integrated into the final IPA results. The detailed procedures and key approaches in each stage are provided in the following subsections.
An integrated framework for IPA of product attributes from online reviews and product maintenance records. The four main stages are denoted by colored boxes. Red arrows highlight the steps only applicable to online reviews.

3.1. Data collection and preprocessing
Customer reviews of targeted products can be collected from online shopping websites and product forums using web crawling techniques. Usually, these reviews include posting time, customers’ opinions and thoughts, product ratings, and customer locations. Product maintenance records can be collected from data service companies, which include basic specifications of products, fault descriptions, and maintenance procedures. Both online reviews and product maintenance records contain a large amount of unstructured textual data, which needs to be preprocessed for further analysis. Common preprocessing operations include data cleaning (e.g., eliminating the redundant, erroneous, missing, duplicate data, and unnecessary symbols from the raw data), sentence segmentation, and word tokenization. These operations enable a smooth extraction of key information from the raw data.
3.2. Key information extraction
After preprocessing the online reviews and maintenance records, we need to extract the key information from these data sources, including the major product attributes and customers’ attitudes toward these attributes. The related techniques are explained in the following subsections.
3.2.1. Product attribute identification
We first filter out the most significant words from the preprocessed online reviews and maintenance records with the common TF-IDF algorithm (Salton and Buckley, Reference Salton and Buckley1988). Then, the Skip-Gram model (Guthrie et al., Reference Guthrie, Allison, Liu, Guthrie and Wilks2006) is leveraged to embed these words into a low-dimension vector space, and the obtained word vectors are clustered with the X-means clustering technique (Pelleg and Moore, Reference Pelleg and Moore2000). These clusters can be considered as the main product attributes identified. Based on the functional structure of the product (e.g., a motor vehicle usually consists of systems in power, chassis, body, and electronics), those attributes sharing the same product function will be merged (e.g., horsepower and acceleration both belong to the power attribute). In addition, those attributes with too low occurrence frequencies will also be merged into attributes with comparable occurrence frequencies and similar functional structures. Finally, the name of each cluster (i.e., identified product attribute) and the significant words in each cluster form an attribute-keyword dictionary. Note that the one significant word can only be found in one cluster (i.e., one product attribute). Thus, once a significant word from the attribute-keyword dictionary is detected from a text of either an online review or product maintenance record, the mentioned product attribute can be identified.
3.2.2. Semantic group generation
After obtaining the identified product attributes, the next step is to get customers’ attitudes toward these attributes. A tricky issue here is that customers occasionally express their opinions toward one product attribute in multiple sentences, and sometimes they mention multiple product attributes in one sentence. For example, power and fuel consumption may be mentioned simultaneously in a sentence from a customer’s review of vehicle performance. Thus, we cannot simply perform sentiment analysis on customer reviews by separating sentences with periods or commas, which will bring inevitable bias. To overcome this issue, we develop a semantic group generation method for customer opinion term extraction. Then, sentiment analysis can be applied to the generated semantic groups and extracted opinions to realize the aspect sentiment classification.
A semantic group is defined as a collection of descriptions of a single product attribute from one customer’s product review. Here, the descriptions can include one or multiple phrases and sentences. In other words, a semantic group is an attribute-description pair. One customer review can include one or more semantic groups. Then, when counting the identified product attributes and calculating sentiment scores, semantic groups can be considered as the most fundamental textual units, and customers’ attitudes and thoughts on products can be more accurately captured. The general process for semantic group generation is shown in Figure 2.
The general process for semantic group generation. The description separation approach in the orange box will be explained in Section 3.2.3.

Specifically, customer reviews are first split into short sentences consisting of words and phrases by segmentation, and part-of-speech (POS) tagging is applied to get the corresponding lexicality tags (e.g., nouns, verbs, etc.) of the words and phrases. Then, the nouns or noun phrases in each short sentence are searched in the attribute-keyword dictionary built in the previous step to find the corresponding product attributes mentioned by customers. Based on the number of attributes identified in each short sentence, semantic groups are generated in three ways.
-
1. If no attribute is identified in the current short sentence, the last-mentioned attribute in the previous sentence of the review will be assigned as the attribute of the current sentence. This assigned attribute and the current sentence are combined as a semantic group. For example, in one review “This phone has a small battery capacity. It makes my user experience particularly poor,” there is no product attribute mentioned in the second sentence. Then, the second sentence will be added to the semantic group of the Power attribute, which is the last-mentioned attribute. If there is no last-mentioned attribute, the current sentence will not be considered.
-
2. If there is only one attribute in the current short sentence, the semantic group is automatically generated by pairing the identified attribute and the current sentence.
-
3. If multiple attributes are identified in one short sentence, dependency parsing is applied to separate the corresponding descriptions of each identified attribute. Then, each pair of the identified attributes and corresponding descriptions form a semantic group. The detailed procedures of this treatment are explained in Section 3.2.3.
After all semantic groups are generated from a customer’s review, those semantic groups describing the same product attribute will be merged.
3.2.3. Description separation for sentences with multiple identified attributes based on dependency parsing analysis
To accurately capture customers’ opinions and attitudes in their reviews where multiple attributes are identified in one sentence, we develop a dependency parsing-based method to separate the corresponding descriptions with respect to each identified attribute. Dependency parsing can provide the syntactic structure of sentences in terms of dependency relations. An open natural language processing platform, Language Technology Platform Cloud (LTP-Cloud) (Che et al., Reference Che, Feng, Qin and Liu2020, Reference Che, Li and Liu2010), is utilized in this operation, and 14 dependency relations can be identified. Their descriptions and tags are listed in Table 1. For example, ATT (Attribute) refers to the syntactic relationship between a noun and an attributive adjective or modifier. In the phrase “the vehicle’s engine,” “vehicle’s” is the attributive modifier that modifies the noun “engine.” Thus, an ATT relation can be identified between “vehicle’s” and “engine.” Verb-object (VOBs) refers to the syntactic relationship between a verb and its object in a sentence. For the sentence “the driver started the engine,” the VOB relation between “started” and “engine” can be identified. More detailed explanations of these relations can be found in (Che et al., Reference Che, Li and Liu2010).
Dependency relations identified from dependency parsing analysis

Figure 3 shows an example of dependency parsing. The sentence is segmented as “[image]”, which means “This /phone /’s / battery /is very /durable”.Footnote 1 Usually, subject–verb (SBV) relation is the most common relation between keywords (e.g., “battery”) and descriptions (e.g., “durable”), which are often adjectives. Also, the adverbial (ADV) relation modifies or qualifies the descriptions (e.g., “very durable”) and is quite useful in the sentiment analysis of sentences. Based on our preliminary study, the five most important dependency relations (SBV, VOB, ATT, ADV, and COO) are selected for further analysis.
An example of dependency parsing (the original sentence is in Chinese). One sentence can include multiple dependency relations.

Figure 4 illustrates the overall workflow of description separation for sentences with multiple identified attributes, which corresponds to the orange box in Figure 2. After dependency parsing, the obtained various dependency relations need to be analyzed one by one until all key product attributes with associated descriptors from the sentence are extracted, from which the semantic groups can be sequentially generated.
The overall workflow of description separation for a sentence with multiple identified attributes. The yellow blocks indicate the input and output of this process.

In this process, we first examine if two or more keywords of identified product attributes appear in an ATT relation, i.e., Case 1. In this case, the keyword at a lower functional level is retained as it usually provides more specific information. For instance, as shown in Figure 3, both “phone” and “battery” appear in the ATT relation, and we choose to keep “battery” as the keyword since it is more specific. After this treatment, if there is only one attribute in the sentence, a semantic group can be generated by pairing the attribute with this sentence. Otherwise, the sentence is passed to the examination of case 2.
In case 2, we check if there are multiple keywords of attributes in a COO relation of the sentence. For example, the keywords “fuel consumption” and “power” are in a COO relation in the sentence “The fuel consumption and power are surprisingly good for this vehicle.” We first count the number of adjectives in this relation. If only one or no adjective is mentioned in the relation, we treat this whole sentence as the description for all keywords. If the number of adjectives is two or above, for each keyword, the adjective closer to the first identified keyword is treated as its corresponding descriptor. Then, a semantic group can be generated by pairing the attribute with its corresponding descriptor. After that, this adjective will be deleted from the sentence to ensure the correct search and pairing of the remaining keywords and descriptors. If no COO relations are found, the sentence is then passed to the examination of case 3.
In case 3, there are no ATT or COO dependency relations between the keywords of attributes in a sentence. Thus, the descriptors can be obtained by searching the dependency relations for each keyword of the attribute separately. Before the search, keywords are first checked and updated to ensure they are complete. If the dependency relation between the keyword and the non-keyword is ATT, and the keyword is the modifier of the non-keyword, we consider updating the keyword by combining it with the non-keyword. For example, in the phrase “battery capacity,” “battery” is included in our keyword dictionary, while “capacity” is not. There is an ATT relation between “battery” and “capacity,” and “battery” is the modifier of “capacity.” Then, the keyword “battery” should be updated to “battery capacity” as the new keyword for the attribute “Power.” After the updating, the new keywords are used in the subsequent searches of relations such as SBV, VOB, and ADV to find the descriptors. The semantic groups are generated by combining the attribute with the corresponding descriptors.
In a word, the proposed workflow in Figure 4 aims to extract the corresponding descriptions on each mentioned attribute in a sentence of customer review as thoroughly as possible by checking various dependency relations of the keywords of attributes. The obtained descriptors are then paired with the product attributes to form semantic groups for further analysis.
3.2.4. Sentiment analysis
In this study, we use two sentiment analysis models to ensure the classification accuracy. The first one is ERNIE (Sun et al., Reference Sun, Wang, Li, Feng, Tian, Wu and Wang2020), which can learn semantic knowledge by modeling the words and entity relationships from massive data. The second one is the BiLSTM model, a combination of forward LSTM and backward LSTM (Xu et al., Reference Xu, Meng, Qiu, Yu and Wu2019). It is often used to model contextual information in natural language processing, which can better capture bi-directional semantic dependencies for accurate sentiment analysis. Both two models have been pre-trained using public datasets with high classification accuracy. ERNIE and BiLSTM can generate sentiment classification probability for each semantic group within a range of [0, 1]. To reduce potential biases and improve the model performance, we propose a voting mechanism to classify the final sentiment score of a semantic group into three categories (i.e., “positive,” “neutral,” or “negative”) based on the following rules:
-
1. If $ {Pos}_1\ge 0.8 $
and
$ {Pos}_2\ge 0.8 $
, the sentiment polarity of the semantic group is labeled as positive.
$ {Pos}_1\ge 0.8 $
and
$ {Pos}_2\ge 0.8 $
, the sentiment polarity of the semantic group is labeled as positive. -
2. If
$ {Neg}_1\ge 0.8 $
and
$ {Neg}_2\ge 0.8 $
, the sentiment polarity of the semantic group is labeled as positive. -
3. In other cases, the semantic group is not deterministically evaluated as positive or negative, and we mark it as neutral.


3.3. Importance-performance analysis
After obtaining the identified product attributes and associated sentiment polarities from previous stages, we can then perform the IPA for the product attributes. The detailed procedures are provided as follows.
3.3.1. Estimation of performance
In this paper, the performance of a product attribute is estimated by two methods: calculating the sentiment scores of the attributes from online reviews or counting the occurrence frequencies of the attributes in product maintenance records. In the first method, for a dataset with $ R $
customer reviews, a review
$ R $
customer reviews, a review $ r $
(
$ r $
( $ r\in 1,2,\dots, R $
) includes semantic groups for each identified product attribute
$ r\in 1,2,\dots, R $
) includes semantic groups for each identified product attribute $ i $
, where
$ i $
, where $ i $
is the index of the product attribute. After sentiment analysis, the semantic group will be assigned a sentiment polarity
$ i $
is the index of the product attribute. After sentiment analysis, the semantic group will be assigned a sentiment polarity $ {S}_{ir} $
. We set “positive” as 1, “neutral” as 0, and “negative” as −1. Let
$ {S}_{ir} $
. We set “positive” as 1, “neutral” as 0, and “negative” as −1. Let $ {R}_i $
be the number of reviews that mention the attribute
$ {R}_i $
be the number of reviews that mention the attribute $ i $
. Then, the average sentiment intensity
$ i $
. Then, the average sentiment intensity $ {S}_i $
of product attribute
$ {S}_i $
of product attribute $ i $
can be calculated using Equation (1).
$ i $
can be calculated using Equation (1).
 $$ {S}_i=\frac{1}{R_i}\sum \limits_{r=1}^{R_i}\;{S}_{ir} $$
We propose to use $ \overline{S_i} $
as the metric of a product attribute’s performance as shown in Equation (2):
$ \overline{S_i} $
as the metric of a product attribute’s performance as shown in Equation (2):
 $$ \overline{S_i}=\frac{S_i-\underset{i\in I}{\min}\;{S}_i}{\underset{i\in I}{\max}\;{S}_i-\underset{i\in I}{\min}\;{S}_i} $$ $ \overline{\;{S}_i} $
is a normalization result, and
$ \overline{\;{S}_i} $
is a normalization result, and $ I $
is the set of indexes of all attributes.
$ I $
is the set of indexes of all attributes. $ \underset{i\in I}{\max }{S}_i $
and
$ \underset{i\in I}{\max }{S}_i $
and $ \underset{i\in I}{\min }{S}_i $
represent the largest and smallest values of the
$ \underset{i\in I}{\min }{S}_i $
represent the largest and smallest values of the $ {S}_i $
(i.e., the overall sentiment intensity of product attribute
$ {S}_i $
(i.e., the overall sentiment intensity of product attribute $ i $
) among all attributes.
$ i $
) among all attributes.
In the second method, the performance of a product attribute can also be measured by the occurrence frequency of its corresponding maintenance items (e.g., a fix job on a vehicle engine). More maintenance items associated with a product attribute imply a lower performance of this attribute from the customers’ real user experience. Equation (3) shows how to calculate the performance of a product attribute based on the occurrence frequency of its corresponding maintenance items. Equation (4) normalizes the result.
 $$ {P}_i=\frac{1}{M}\sum \limits_{m=1}^M{P}_{im} $$
 $$ \overline{P_i}=\frac{\underset{i\in I}{\max }{P}_i-{P}_i}{\underset{i\in I}{\max }{P}_i-\underset{i\in I}{\min }{P}_i} $$
Here $ {P}_i $
represents the average number of the maintenance items of attribute
$ {P}_i $
represents the average number of the maintenance items of attribute $ i $
in
$ i $
in $ M $
maintenance records.
$ M $
maintenance records. $ {P}_{im} $
is the number of related maintenance items regarding product attribute
$ {P}_{im} $
is the number of related maintenance items regarding product attribute $ i $
in maintenance record
$ i $
in maintenance record $ m $
.
$ m $
. $ \overline{P_i} $
is the normalized result. Attributes with a smaller number of maintenance items will have lower
$ \overline{P_i} $
is the normalized result. Attributes with a smaller number of maintenance items will have lower $ {P}_i $
. After applying the conversion in Equation (4), an attribute with larger
$ {P}_i $
. After applying the conversion in Equation (4), an attribute with larger $ \overline{P_i} $
(i.e., closer to 1) has better performance.
$ \overline{P_i} $
(i.e., closer to 1) has better performance.
3.3.2. Estimation of importance
In this study, the importance of a product attribute is estimated by the influence of the sentiments of this product attribute on customers’ overall product rating from online reviews. The extreme gradient boosting (XGBoost) model is leveraged to measure this influence due to its superior performance in modeling efficiency and prediction accuracy (Chen and Guestrin, Reference Chen and Guestrin2016). In the XGBoost model, a batch of trees is constructed with different features to estimate the final output. To construct the XGBoost model, customer sentiment scores for each attribute are used as the input, and the output is the overall rating of the product. To better fit this model, customers’ overall ratings on products are classified into two categories, “positive” or “negative.” After the training, the importance score for each feature is calculated using the gain-based feature importance estimation algorithm, and a 10-fold cross-validation is used to obtain better modeling results.
For a single leaf of the tree (i.e., a set of reviews grouped with the same classified label), gain measures the loss reduction after splitting this leaf into left and right leaves (i.e., splitting these reviews to two sets with different labels) using a feature (i.e., one of the product attributes). Define $ {D}_n=\left\{d|q\left({x}_d\right)=n\right\} $
as the indices of data assigned to leaf
$ {D}_n=\left\{d|q\left({x}_d\right)=n\right\} $
as the indices of data assigned to leaf $ n $
. Gain for leaf
$ n $
. Gain for leaf $ n $
to be split using attribute
$ n $
to be split using attribute $ i $
is calculated as
$ i $
is calculated as
 $$ {\displaystyle \begin{array}{c} Gain=\frac{1}{2}\left[\frac{{\left({\sum}_{d\in {D}_L}{u}_d\right)}^2}{\sum_{d\in {D}_L}{h}_d+\lambda }+\frac{{\left({\sum}_{d\in {D}_R}{u}_d\right)}^2}{\sum_{d\in {D}_R}{h}_d+\lambda }-\frac{{\left({\sum}_{d\in D}{u}_d\right)}^2}{\sum_{d\in D}{h}_d+\lambda}\right]-\gamma \\ {}{u}_d={\partial}_{{\hat{y}}_d^{\left(t-1\right)}}l\left({y}_d,{\hat{y}}_d^{\left(t-1\right)}\right)\hskip1em and\hskip1em {h}_d={\partial}_{{\hat{y}}_d^{\left(t-1\right)}}^2l\left({y}_d,{\hat{y}}_d^{\left(t-1\right)}\right)\end{array}} $$
where $ {u}_d $
and
$ {u}_d $
and $ {h}_d $
are first computed to simplify the calculation.
$ {h}_d $
are first computed to simplify the calculation. $ l $
is the loss function, and
$ l $
is the loss function, and $ t $
stands for the iteration steps.
$ t $
stands for the iteration steps. $ {D}_L $
and
$ {D}_L $
and $ {D}_R $
are the data sets in the left and right leaves.
$ {D}_R $
are the data sets in the left and right leaves. $ \lambda $
and
$ \lambda $
and $ \gamma $
are the controlling factors to avoid overfitting (Chen and Guestrin, Reference Chen and Guestrin2016). The feature importance
$ \gamma $
are the controlling factors to avoid overfitting (Chen and Guestrin, Reference Chen and Guestrin2016). The feature importance $ {Imp}_i $
for attribute
$ {Imp}_i $
for attribute $ i $
is then defined as the average gain over all trees and leaves with attribute
$ i $
is then defined as the average gain over all trees and leaves with attribute $ i $
as the splitting feature (Loh, Reference Loh2011). Let
$ i $
as the splitting feature (Loh, Reference Loh2011). Let $ K $
be the number of constructed trees. For a single tree
$ K $
be the number of constructed trees. For a single tree $ k $
, there are
$ k $
, there are $ {N}_k-1 $
internal nodes. Then, the importance is calculated as
$ {N}_k-1 $
internal nodes. Then, the importance is calculated as
 $$ {Imp}_i=\frac{1}{K}\sum \limits_{k=1}^K\sum \limits_{n=1}^{N_k-1}{Gain}_{kni} $$
where $ n $
is the index of the node. The attribute
$ n $
is the index of the node. The attribute $ i $
will have higher feature importance if it contributes more to the prediction performance of the model (Zheng et al., Reference Zheng, Yuan and Chen2017). The final importance
$ i $
will have higher feature importance if it contributes more to the prediction performance of the model (Zheng et al., Reference Zheng, Yuan and Chen2017). The final importance $ \overline{Imp_i} $
of attribute
$ \overline{Imp_i} $
of attribute $ i $
is calculated with the normalized value of
$ i $
is calculated with the normalized value of $ {Imp}_i $
as shown in Equation (7).
$ {Imp}_i $
as shown in Equation (7).
 $$ \overline{Imp_i}=\frac{Imp_i-\underset{i\in I}{\max}\;{Imp}_i}{\underset{i\in I}{\max}\;{Imp}_i-\underset{i\in I}{\min}\;{Imp}_i}. $$
Attribute occurrence frequencies from online reviews can also be calculated to reflect their importance. These results are then compared with the importance results obtained by the XGBoost classification model to present a more comprehensive understanding of attribute importance.
3.3.3. Importance-performance plot
After getting the importance and performance of each product attribute, the IPA plot can be generated by marking the performance and importance of product attributes in a plane rectangular coordinate system. Then, the mean values of the performance and importance over all attributes are calculated to divide the plot into four quadrants, which are labeled as “Keep up the good work,” “Concentrate here,” “Low priority,” and “Possible overkill” from quadrant I to quadrant IV in a counterclockwise manner. Designers can then take tailored actions for the product attributes falling in different quadrants. For example, attributes in quadrant II (“Concentrate here”) have low performance but high importance, which means a high priority for design improvement. However, evaluating the improvement priorities only by quadrants may bring difficulties for designers to evaluate those attributes quite close to the intersection boundary of different quadrants (Azzopardi and Nash, Reference Azzopardi and Nash2013). For those attributes close to the quadrant II in an IPA plot or attributes with extremely low performance (i.e., the attribute with the lowest performance value among all attributes), we also highly recommend designers pay more attention to them. In this research, an attribute in other quadrants is suggested to be close to quadrant II if it has a performance value smaller than 1.05 times the average performance and an importance value larger than 0.95 times the average importance. These two coefficients are obtained from our pilot tests as they allow most important attributes around quadrant II to be covered. In practice, designers can adopt more lenient criteria if they intend to make more aggressive design improvement strategies.
3.4. Results validation
To examine the validity of the obtained IPA results, we propose two methods, whose details are provided as follows.
3.4.1. Validation by comparing IPA results with actual product improvements on the market
The first validation method is to check whether the actual product improvements on the market agree with the suggestions from the IPA results. Since a major product attribute usually contains various components (e.g., the multimedia system of a vehicle includes screen, audio, and other subsystems), the upgrading status of each major product attribute should not be simply determined as 0 or 1 (i.e., not improved or improved). A more precise improvement score is needed based on the improvement of the components under this attribute.
We first select related semantic groups with negative customer sentiment scores for each major product attribute $ j $
. Then, in these semantic groups, attributes’ related keywords (i.e., components) are extracted, and their mentioned frequencies are calculated. The same keywords mentioned in one semantic group are only counted once. The
$ j $
. Then, in these semantic groups, attributes’ related keywords (i.e., components) are extracted, and their mentioned frequencies are calculated. The same keywords mentioned in one semantic group are only counted once. The $ W $
most frequently mentioned keywords for each attribute are chosen for further analysis. Let
$ W $
most frequently mentioned keywords for each attribute are chosen for further analysis. Let $ {F}_{wj} $
(
$ {F}_{wj} $
( $ w=1,2,\dots W $
) represents the mentioned frequency of the keyword
$ w=1,2,\dots W $
) represents the mentioned frequency of the keyword $ w $
of attribute
$ w $
of attribute $ j $
. Then, the weight of keyword
$ j $
. Then, the weight of keyword $ w $
is calculated as shown in Equation (8):
$ w $
is calculated as shown in Equation (8):
 $$ {a}_{wj}=\frac{F_{wj}}{\sum_{w=1}^W{F}_{wj}} $$ $ {a}_{wj} $
represents the contribution of keyword
$ {a}_{wj} $
represents the contribution of keyword $ w $
to customers’ negative reviews on attribute
$ w $
to customers’ negative reviews on attribute $ j $
. Keywords with higher occurrence frequencies in negative semantic groups have larger weights, which indicates that these keywords/components are likely to be the more urgent design improvements from customers’ point of view. After that, by examining the real improvements of the product on the market, the flag of component improvement
$ j $
. Keywords with higher occurrence frequencies in negative semantic groups have larger weights, which indicates that these keywords/components are likely to be the more urgent design improvements from customers’ point of view. After that, by examining the real improvements of the product on the market, the flag of component improvement $ {g}_{wj} $
can be determined, in which
$ {g}_{wj} $
can be determined, in which $ {g}_{wj}=1 $
represents the component
$ {g}_{wj}=1 $
represents the component $ w $
of attribute
$ w $
of attribute $ j $
has been improved on the market, otherwise,
$ j $
has been improved on the market, otherwise, $ {g}_{wj}=0 $
. Therefore, the total improvement score of attribute
$ {g}_{wj}=0 $
. Therefore, the total improvement score of attribute $ j $
is calculated as shown in Equation (9).
$ j $
is calculated as shown in Equation (9).
 $$ {p}_j=\sum \limits_{w=1}^W\;{a}_{wj}{g}_{wj} $$
Here $ {p}_j=1 $
means all of the main components of the product attribute
$ {p}_j=1 $
means all of the main components of the product attribute $ j $
have been improved in the real market, while
$ j $
have been improved in the real market, while $ {p}_j=0 $
means none of its components are improved.
$ {p}_j=0 $
means none of its components are improved.
3.4.2. Validation by comparing the analysis results of online reviews and maintenance records before and after product improvements
In the second validation method, IPA results based on online reviews and maintenance records for products in different model years are analyzed and compared.Footnote
2 We first perform IPA using customers’ online reviews for the same product in two model years (i.e., before and after improvements). Then, we calculate $ \Delta {S}_i $
, the change of the average sentiment scores for attribute
$ \Delta {S}_i $
, the change of the average sentiment scores for attribute $ i $
as shown in Equation (10):
$ i $
as shown in Equation (10):
 $$ \Delta {S}_i={S}_i^{\prime }-{S}_i $$
Here $ {S}_i $
and
$ {S}_i $
and $ {S}_i^{\prime } $
represent the average sentiment scores for attribute
$ {S}_i^{\prime } $
represent the average sentiment scores for attribute $ i $
before and after the improvements with a range of
$ i $
before and after the improvements with a range of $ \left[-1,1\right] $
.
$ \left[-1,1\right] $
. $ \Delta {S}_i $
can be used to measure the change in customers’ satisfaction, and larger
$ \Delta {S}_i $
can be used to measure the change in customers’ satisfaction, and larger $ \Delta {S}_i $
shows greater improvement in attribute
$ \Delta {S}_i $
shows greater improvement in attribute $ i $
from customers’ experience.
$ i $
from customers’ experience.
To measure the change in customers’ satisfaction with product attributes in a more accurate way, we adopt the same calculation method as described in Section 3.4.1. First, the frequency $ {F}_{wj} $
for the keyword
$ {F}_{wj} $
for the keyword $ w $
of the attribute
$ w $
of the attribute $ j $
in negative semantic groups is counted. Then, the proportion of occurrence frequency of keyword
$ j $
in negative semantic groups is counted. Then, the proportion of occurrence frequency of keyword $ w $
before the improvement can be calculated as shown in Equation (11):
$ w $
before the improvement can be calculated as shown in Equation (11):
 $$ {c}_{wj}=\frac{F_{wj}}{\sum_{j=1}^J{\sum}_{w=1}^W{F}_{wj}} $$ $ J $
is the total number of product attributes. Therefore,
$ J $
is the total number of product attributes. Therefore, $ {c}_{wj} $
represents the contribution of keyword
$ {c}_{wj} $
represents the contribution of keyword $ w $
to all negative reviews about the product from customers. Similarly, the occurrence proportion
$ w $
to all negative reviews about the product from customers. Similarly, the occurrence proportion $ {c}_{wj}^{\prime } $
for keyword
$ {c}_{wj}^{\prime } $
for keyword $ w $
in the negative semantic groups from the online reviews of the improved product can also be evaluated.
$ w $
in the negative semantic groups from the online reviews of the improved product can also be evaluated. $ {c}_{wj} $
and
$ {c}_{wj} $
and $ {c}_{wj}^{\prime } $
range from 0 to 1. Then, the improvement scores of keywords and the attribute are evaluated using the percentage of change for occurrence proportions in two model years as shown in Equations (12) and (13).
$ {c}_{wj}^{\prime } $
range from 0 to 1. Then, the improvement scores of keywords and the attribute are evaluated using the percentage of change for occurrence proportions in two model years as shown in Equations (12) and (13).
 $$ {p}_{wj}=\frac{c_{wj}-{c}_{wj}^{\prime }}{c_{wj}}\times 100\% $$
 $$ {p}_j=\sum \limits_{w=1}^W\;{a}_{wj}{p}_{wj} $$
Here $ {p}_{wj} $
is the improvement score of the keyword
$ {p}_{wj} $
is the improvement score of the keyword $ w $
within product attribute
$ w $
within product attribute $ j $
, and
$ j $
, and $ {a}_{wj} $
is the weight of the keyword
$ {a}_{wj} $
is the weight of the keyword $ w $
calculated by Equation (8). Also,
$ w $
calculated by Equation (8). Also, $ W $
most frequently mentioned keywords for each attribute before improvements are selected. Then,
$ W $
most frequently mentioned keywords for each attribute before improvements are selected. Then, $ {p}_j $
, the improvement score for attribute
$ {p}_j $
, the improvement score for attribute $ j $
is calculated by using the weighted sum of the improvement scores for these keywords. Positive improvement scores indicate improvements in customers’ satisfaction, while negatives mean worse experiences. The closer the improvement score to 1, the fewer complaints from customers about the product attributes. The validation using product maintenance records is similar to the above procedure, and the only difference is that the attribute frequency
$ j $
is calculated by using the weighted sum of the improvement scores for these keywords. Positive improvement scores indicate improvements in customers’ satisfaction, while negatives mean worse experiences. The closer the improvement score to 1, the fewer complaints from customers about the product attributes. The validation using product maintenance records is similar to the above procedure, and the only difference is that the attribute frequency $ {c}_{wj} $
and
$ {c}_{wj} $
and $ {c}_{wj}^{\prime } $
is counted within all maintenance records when using Equation (11).
$ {c}_{wj}^{\prime } $
is counted within all maintenance records when using Equation (11).
3.5. The combination of IPA results from two data sources
The IPA results from two data sources reflect different aspects of the product performance. Usually, online reviews are subjective and contain customers’ opinions, thoughts and use experience with products, while maintenance records contain objective information about the repair and maintenance services. On the other hand, most online reviews are posted when the product is purchased or a short time after the purchase, while maintenance records are generated for a long duration after the purchase that can reflect the product’s long-term performance. The combination of these results covers both subjective and objective information as well as short-term and long-term information on product performance. To obtain more comprehensive insights into customers’ needs, the IPA results from two data sources can be combined into an integrated result.
Since maintenance records solely contain objective information, the importance of attributes for maintenance records shares the same values obtained from online reviews. We apply the weighted average to merge the two performance values. The integrated performance is evaluated as shown in Equation (14)
 $$ \overline{Per_i}={\alpha}_i\overline{S_i}+{\beta}_i\overline{P_i} $$
Here, $ \overline{Per_i} $
is the integrated performance for attribute
$ \overline{Per_i} $
is the integrated performance for attribute $ {A}_i $
.
$ {A}_i $
. $ \overline{S_i} $
and
$ \overline{S_i} $
and $ \overline{P_i} $
are the performance values calculated from online reviews and maintenance records, respectively.
$ \overline{P_i} $
are the performance values calculated from online reviews and maintenance records, respectively. $ {\alpha}_i $
and
$ {\alpha}_i $
and $ {\beta}_i $
are the assigned weights and
$ {\beta}_i $
are the assigned weights and $ {\alpha}_i+{\beta}_i=1 $
. Manufacturers can assign different weights to meet their own needs and preferences. For example, one can assign more weights to the data source with more convincing IPA results based on the improvement score
$ {\alpha}_i+{\beta}_i=1 $
. Manufacturers can assign different weights to meet their own needs and preferences. For example, one can assign more weights to the data source with more convincing IPA results based on the improvement score $ {p}_i $
. Higher improvement scores indicate the IPA results are more consistent with the actual market changes. In this case,
$ {p}_i $
. Higher improvement scores indicate the IPA results are more consistent with the actual market changes. In this case, $ {\alpha}_i $
and
$ {\alpha}_i $
and $ {\beta}_i $
can be calculated as shown in Equations (15) and (16):
$ {\beta}_i $
can be calculated as shown in Equations (15) and (16):
 $$ {\alpha}_i=\frac{p_{i, reviews}}{p_{i, reviews}+{p}_{i, records}} $$
 $$ {\beta}_i=1-{\alpha}_i $$
Here $ {p}_{i, reviews} $
and
$ {p}_{i, reviews} $
and $ {p}_{i, records} $
are the improvement scores of attribute
$ {p}_{i, records} $
are the improvement scores of attribute $ i $
obtained from online reviews and maintenance records, respectively.
$ i $
obtained from online reviews and maintenance records, respectively.
4. A case study of passenger vehicles
To demonstrate the proposed framework, a case study of passenger vehicles is presented. We collect online reviews for a typical sport utility vehicle (Toyota Highlander in two model years, 2018 and 2022), denoted as SUV A, from a popular auto forum in China (Autohome, 2022). These reviews include customers’ ratings on eight dimensions of the vehicle (space, power, fuel consumption, comfort, appearance, interior design, value for money, maneuverability), and their opinions and thoughts on the vehicle. For an impartial comparison and analysis, we randomly sampled 587 online reviews for SUV A in the 2018 and 2022 model years. In addition, we obtain 23153 maintenance records of SUV A in and after 2018 from a data service company. Each maintenance record contains vehicle information (e.g., fuel type, mileage) and specific maintenance items (e.g., filter change, engine check). Based on the operations contained, these records are further classified into repair-type (e.g., repairing engine or electrical system issues) and maintenance-type (e.g., changing engine oil, replacing worn-out tires) records. The maintenance-type records only contain routine maintenance operations, while the repair-type records contain repair operations and may also contain some associated maintenance operations. Only the repair-type records are considered in this study as they better reflect the quality performance of vehicles (we still use maintenance records as the name of these records in the paper for convenience). These selected maintenance records are also randomly sampled to ensure comparable numbers of records in two time periods. In the following sections, the results of attribute identification, sentiment analysis, IPA analysis, and results validation are presented and discussed in detail.
5. Results of the case study
Following the procedures in Section 3.3, online reviews and maintenance records for SUV A in the model year 2018 are first analyzed. The results of attribute identification, sentiment analysis, and IPA from these two data sources are calculated and discussed, respectively.
5.1. Attribute identification and sentiment analysis
After preprocessing the online reviews and maintenance records, word embeddings of keywords from these two data sources are created by the Skip-Gram model and clustered into product attributes.
In this study, we choose X-means to cluster keywords in constructing the attribute-keyword dictionary. One popular method, the latent Dirichlet allocation (LDA) model, is also tested but its performance is poor. LDA treats documents as a mixture of topics, and topics as a distribution over keywords (Jelodar et al., Reference Jelodar, Wang, Yuan, Feng, Jiang, Li and Zhao2019; Ferguson et al., Reference Ferguson, Cheng, Adolphe, Van de Zande, Wallace and Olechowski2022). In our context, reviews are the documents, and attributes are the topics. The automobile forum usually requires reviewers to describe their user experience in certain aspects such as space, fuel consumption, control, and so forth. Thus, almost every online reviewer mentioned these topics in their reviews. As most of the online reviews contain similar topics, LDA cannot distinguish these topics (or attributes) well. When LDA is applied, we find one keyword can be assigned to multiple topics, which is not acceptable since we hope to map the keywords into different clusters or attributes in constructing the attribute-keyword dictionary. In contrast, X-means mainly considers the closeness of the keywords’ word vectors, which can better cluster keywords and ensure one keyword only appears in one cluster.
After the clustering, based on the functional structure of the motor vehicle system (Stone and Ball, Reference Stone and Ball2004; Duffy, Reference Duffy2009), these attributes are further corrected. For each cluster, the keywords that do not belong to the corresponding product attribute of that cluster will be moved to the correct clusters. Also, similar clusters are manually merged. Note that this correction process is only needed once in the early stage of building the proposed framework. After constructing a comprehensive attribute-keyword dictionary for one type of product (e.g., automobile), if there are no major changes to the product, the dictionary will not need to be updated in later use. Also, similar clusters are manually merged. Finally, 16 vehicle attributes mostly concerned by customers are identified.
Table 2 shows the identified vehicle attributes with sample keywords and the number of keywords. Some product attributes reflect the performance of the automotive mechanical system. For example, Power ( $ i=1 $
) and Fuel (
$ i=1 $
) and Fuel ( $ i=2 $
) are more related to engine performance. Control (
$ i=2 $
) are more related to engine performance. Control ( $ i=3 $
) and Operation (
$ i=3 $
) and Operation ( $ i=6 $
) are related to the braking and shock absorption of the vehicle chassis. In addition, customers’ perceived attributes are also included. For example, Comfort (
$ i=6 $
) are related to the braking and shock absorption of the vehicle chassis. In addition, customers’ perceived attributes are also included. For example, Comfort ( $ i=9 $
) contains keywords such as noise level, smell, and so forth. Exterior (
$ i=9 $
) contains keywords such as noise level, smell, and so forth. Exterior ( $ i=13 $
) refers to the shape design of the vehicle, such as esthetics and fashion style.
$ i=13 $
) refers to the shape design of the vehicle, such as esthetics and fashion style.
Product attributes identified from online reviews and maintenance records

After obtaining the identified attributes and generating corresponding semantic groups as described in Section 2.2, we utilize the ERNIE and BiLSTM models to analyze the sentiment polarity of all semantic groups. To evaluate the performance of our model, we manually labeled the sentiment polarities for each attribute from 5870 online reviews as the ground truth. When compared to the ground truth, our unsupervised rule-based approach shows a classification accuracy of 83.46%, while the supervised BERT for sentence pair classification (BERT-SPC) model obtains a classification accuracy of 71.78%. This result indicates the superior performance of our approach in semantic analysis. More importantly, our approach is unsupervised without requiring pre-labeled data and can be applied to texts from multiple domains.
Table 3 shows sample results of the sentiment analysis on 587 sampled customer reviews of SUV A in 2018. $ {S}_{ir} $
represent the sentiment polarity of product attribute
$ {S}_{ir} $
represent the sentiment polarity of product attribute $ i $
in review
$ i $
in review $ r $
. Customers usually do not express their opinions about all product attributes in one review, then the sentiment polarity for attributes not mentioned by customers is set to 0 (i.e., assumed to be neutral).
$ r $
. Customers usually do not express their opinions about all product attributes in one review, then the sentiment polarity for attributes not mentioned by customers is set to 0 (i.e., assumed to be neutral). $ {y}_r $
is the classified rating,
$ {y}_r $
is the classified rating, $ {y}_r=0 $
represents the customer’s rating is lower than the average rating, while
$ {y}_r=0 $
represents the customer’s rating is lower than the average rating, while $ {y}_r=1 $
represents the opposite situation.
$ {y}_r=1 $
represents the opposite situation.
Sample results of the sentiment analysis on customers’ reviews of SUV A in 2018. $ {S}_{ir} $
is the sentiment intensity of product attribute
$ {S}_{ir} $
is the sentiment intensity of product attribute $ i $
(
$ i $
( $ i=1,2,\dots, 16 $
) in review
$ i=1,2,\dots, 16 $
) in review $ r $
$ r $

5.2. Importance-performance analysis using customer online reviews
For online reviews, the performance of attributes is first evaluated using $ {S}_i $
and
$ {S}_i $
and $ \overline{S_i} $
(see Equations (1) and (2)). The results are shown in Table 4.
$ \overline{S_i} $
(see Equations (1) and (2)). The results are shown in Table 4. $ {S}_i $
reflects customers’ average satisfaction with the attribute
$ {S}_i $
reflects customers’ average satisfaction with the attribute $ i $
.
$ i $
. $ \overline{S_i} $
is the normalized result of
$ \overline{S_i} $
is the normalized result of $ {S}_i $
with a range of [0, 1]. Table 4 shows that all vehicle attributes have positive average sentiment scores, which implies that customers tend to provide positive evaluations of their purchased vehicles, and this may bring subjective bias to the analysis results using online reviews. For SUV A in 2018, Structure is the attribute that customers are most satisfied with, while Light is the least. Many customers complained about the outdated halogen lamp of SUV A in their reviews.
$ {S}_i $
with a range of [0, 1]. Table 4 shows that all vehicle attributes have positive average sentiment scores, which implies that customers tend to provide positive evaluations of their purchased vehicles, and this may bring subjective bias to the analysis results using online reviews. For SUV A in 2018, Structure is the attribute that customers are most satisfied with, while Light is the least. Many customers complained about the outdated halogen lamp of SUV A in their reviews.
Attribute performance for the 2018 model of SUV A. $ {S}_i $
is the average customer sentiment scores to attribute
$ {S}_i $
is the average customer sentiment scores to attribute $ i $
, and
$ i $
, and $ \overline{S_i} $
is the attribute performance
$ \overline{S_i} $
is the attribute performance

XGBoost model, linear regression, and two- and three-layer neural networks are tested in the importance modeling, and they achieve a prediction accuracy of 88.59%, 85.59%, 86.44%, and 83.05%, respectively. The accuracy is the percentage of the number of correct predictions over the total number of predictions. Here, we use the 10-fold cross-validation to train the models 10 times and evaluate the average accuracy. It divides the dataset into 10 equal subsets. For each time, one of the subsets is selected as the testing dataset, and the remaining nine subsets are used as the training dataset. Therefore, in this study, we choose the XGBoost model for its higher accuracy and better interpretability. Then, the importance of vehicle attributes is evaluated using the normalized feature importance values as mentioned in Section 2.3.2. The results are shown in Table 5 together with the occurrence frequencies (i.e., how often an attribute is mentioned in customers’ reviews) for comparison. Table 5 shows that Multimedia owns the highest importance score, but its occurrence frequency is medium. Structure, the vehicle attribute with the highest customer satisfaction level, is also the most frequently mentioned attribute. Intelligence shows consistently low importance and low occurrence frequency. One possible explanation is that in the model year 2018, not too many intelligence functions for automobiles were equipped, and the lack of relative reviews and customers’ unfamiliarity with new technologies may lead to its low importance.
Attribute importance and occurrence frequency for the 2018 model of SUV A

Figure 5 shows the resulting importance-performance plot in which the dividing lines in blue color are obtained based on the average value of importance and performance. We can observe that multimedia and electronics are classified into the second quadrant with high importance but low performance. Light has relatively low importance, but its customer satisfaction is the lowest. Therefore, from the IPA results using online reviews, multimedia, electronics, and light need to be improved urgently.
The importance-performance plot for SUV A in 2018 obtained from online reviews.
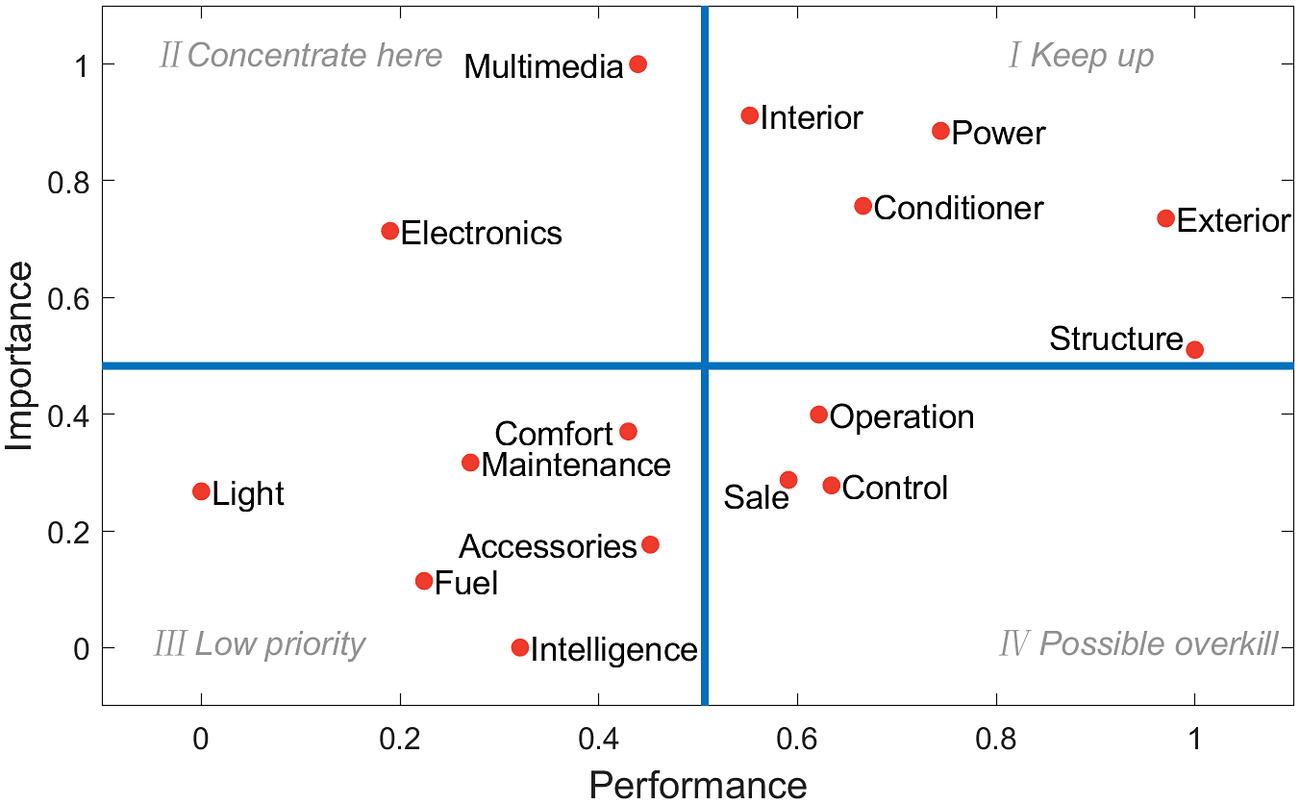
Figure 6 plots the 16 vehicle attributes by replacing the importance in Figure 5 with occurrence frequencies. When compared to Figure 5, attributes such as Power, Exterior, Interior, and Intelligence have similar importance, showing that the occurrence frequency has also been counted in the calculation of feature importance from the XGBoost model. However, the calculated importance for attributes like Fuel, Comfort, Sale, and Control differs a lot from their occurrence frequencies. Compared with estimating importance using occurrence frequencies, the XGBoost model also considers the influence of customers’ sentiments for different attributes on the final product ratings. The generation of classification trees during the XGBoost modeling is similar to customers’ rating processes. For example, although Fuel has a high occurrence frequency, it has little effect on the final rating. On the contrary, the low performance of Multimedia leads to low ratings and has higher priority in the improvements. This indicates that the attribute importance calculated from the XGBoost model is more comprehensive compared to the importance derived from the occurrence frequency only.
The occurrence frequency-performance plot for SUV A in 2018 obtained from online reviews.

5.3. Importance-performance analysis using maintenance records
As mentioned in previous sections, customer online reviews may carry unavoidable subjective bias. In contrast, product maintenance records can provide more objective information on vehicle performance. Table 6 and Figure 8 show the calculated performance and importance in which the importance of attributes is the same as the importance results using online reviews since maintenance records contain no sentiment information, while the performance is obtained from the analysis of maintenance records.Footnote 3 Figure 8 reveals that the attributes that most urgently need to be improved are electronics, structure, and control. Here, exterior, intelligence, and sale are not shown since they are not included in the maintenance records.
Attribute performance and importance for maintenance records of SUV A in 2018. $ \overline{P_i} $
is the attribute performance calculated from maintenance records
$ \overline{P_i} $
is the attribute performance calculated from maintenance records

When comparing the importance-performance plots from two data sources (i.e., Figures 7 and 8), the performance of vehicle attributes shows inconsistencies. For example, as the most frequently mentioned attribute in online reviews, Structure has been well received by customers, especially the large room space of the vehicle. Whereas in the maintenance records, the broken fender aprons may cause the low-performance evaluation of structure. In addition, online reviews are usually posted shortly after the purchase and reflect more about the performance at the early stage of product use. However, maintenance records can provide more information about the durability of specific vehicle parts. Therefore, online reviews and maintenance records show different focuses for the evaluation of product attributes, and the analysis integrating multiple-source data can contribute to a more comprehensive view of the design improvements.
The importance-performance plot for SUV A in 2018 obtained from online reviews.

The importance-performance plot for SUV A in 2018 obtained from maintenance records.

6. Validation of importance-performance analysis results
6.1. Validation with actual product improvements on the market
In this section, the obtained IPA results are validated by comparing them with the actual product improvements on the market between 2018 and 2022 using the data from the official website of SUV A (GAC-Toyota, 2022). Our IPA results indicate that attributes such as Electronics, Multimedia, and Light should be improved most urgently. Following the procedures introduced in Section 3.4.1., the improvement scores of these three attributes are calculated, and the weights of the five most frequently mentioned keywords ( $ W=5 $
) for each attribute are reported in Table 7. We find that all attributes recommended from IPA results have a large score of improvement, which demonstrates the suggestions obtained by our framework conform to the actual improvements on the market. Exemplary improvements include the addition of EPB (Electrical Park Brake), improvement of the central control screen, and upgrading of light groups. Table 7 also shows that Light has the largest improvement score, and all components related to the five important keywords under this attribute (e.g., headlamp and halogen) have been upgraded from the actual market information. For example, the improvement strategies of the vehicle from 2018 to 2022 include changing the headlamp from halogen to LED. This is an interesting finding considering light has the worst performance score as shown in Figure 7.
$ W=5 $
) for each attribute are reported in Table 7. We find that all attributes recommended from IPA results have a large score of improvement, which demonstrates the suggestions obtained by our framework conform to the actual improvements on the market. Exemplary improvements include the addition of EPB (Electrical Park Brake), improvement of the central control screen, and upgrading of light groups. Table 7 also shows that Light has the largest improvement score, and all components related to the five important keywords under this attribute (e.g., headlamp and halogen) have been upgraded from the actual market information. For example, the improvement strategies of the vehicle from 2018 to 2022 include changing the headlamp from halogen to LED. This is an interesting finding considering light has the worst performance score as shown in Figure 7.
Improvement scores $ {p}_j $
for three vehicle attributes obtained from actual market data. For keyword
$ {p}_j $
for three vehicle attributes obtained from actual market data. For keyword $ w $
of attribute
$ w $
of attribute $ j $
,
$ j $
, $ {a}_{wj} $
is the weight, and
$ {a}_{wj} $
is the weight, and $ {g}_{wj} $
is the flag of improvement (1 means the keyword-related function or component has been improved and 0 means there is no mentioned improvement)
$ {g}_{wj} $
is the flag of improvement (1 means the keyword-related function or component has been improved and 0 means there is no mentioned improvement)

In the real market, other attributes of SUV A (e.g., interior, exterior, structure, control, and intelligence) have also been improved from 2018 to keep up with its competitors. According to the vehicle’s official website (GAC-Toyota, 2022), the energy form of SUV A has been extended from gas to hybrid, and its fuel consumption has been greatly reduced. Most of these improved attributes have large occurrence frequencies in customer online reviews, which implies that motor companies may need to focus more on customers’ concerns and make corresponding product improvement strategies.
6.2. Validation with the analysis of online reviews and maintenance records before and after product improvements
6.2.1. Validation using online reviews before and after product improvements
In this validation method, customers’ online reviews on SUV A of 2018 and 2022 are analyzed and compared. Following the procedures introduced in Section 3.4.2., the vehicle attributes are sorted by the change in performance $ \Delta {S}_i $
(refer to Equation (10)) from 2018 to 2022. Table 8 shows the sorted results and the change in customer satisfaction, and the rankings of these changes are labeled in the importance-performance plot of Figure 9. We find that for most of the vehicle attributes, customers tend to have a higher evaluation of the model in 2022. Attributes with low performance but high importance have been improved most (e.g., electronics and multimedia are in quadrant II, and their customer sentiment score changes are 0.358 and 0.263 with a rank 2 and 3, respectively). The improvements of attributes with low performance are usually larger than those with high performance (e.g., most top-ranking attributes are in quadrants II and III). The three most improved attributes are light, electronics, and multimedia, which is consistent with the suggestion from our IPA results in Section 5.2. Light performs worst with a normalized performance of 0, but has the largest change with the value of 0.719. The fourth most improved attribute is intelligence, which conforms to the rapid development of smart technologies for automobiles in recent years (Hu et al., Reference Hu, Lou, Xing, Wang, Cao and Lv2022).
$ \Delta {S}_i $
(refer to Equation (10)) from 2018 to 2022. Table 8 shows the sorted results and the change in customer satisfaction, and the rankings of these changes are labeled in the importance-performance plot of Figure 9. We find that for most of the vehicle attributes, customers tend to have a higher evaluation of the model in 2022. Attributes with low performance but high importance have been improved most (e.g., electronics and multimedia are in quadrant II, and their customer sentiment score changes are 0.358 and 0.263 with a rank 2 and 3, respectively). The improvements of attributes with low performance are usually larger than those with high performance (e.g., most top-ranking attributes are in quadrants II and III). The three most improved attributes are light, electronics, and multimedia, which is consistent with the suggestion from our IPA results in Section 5.2. Light performs worst with a normalized performance of 0, but has the largest change with the value of 0.719. The fourth most improved attribute is intelligence, which conforms to the rapid development of smart technologies for automobiles in recent years (Hu et al., Reference Hu, Lou, Xing, Wang, Cao and Lv2022).
Changes in customer sentiment scores for SUV A from 2018 to 2022 based on online reviews. $ \Delta {S}_i $
is the customers’ average sentiment change of attribute
$ \Delta {S}_i $
is the customers’ average sentiment change of attribute $ i $
(see Equation (10))
$ i $
(see Equation (10))

The importance-performance plot for SUV A in 2018 obtained from online reviews with rankings of changes in customer sentiment scores for these attributes.

Then, the improvement scores for three vehicle attributes with urgent need of improvements and their five most frequently mentioned keywords are reported in Table 9. Similar to the results obtained in Sec. 5.1, Light still has the largest improvement score close to 1. Both electronics and multimedia receive good scores for improvements, which implies customers make fewer complaints on these attributes in 2022.
Improvement scores for three vehicle attributes obtained from online reviews within two model years. $ {p}_{wj} $
is the improvement score of keyword
$ {p}_{wj} $
is the improvement score of keyword $ w $
from attribute
$ w $
from attribute $ j $
.
$ j $
. $ {p}_j $
is the total improvement score of attribute
$ {p}_j $
is the total improvement score of attribute $ j $
$ j $

Figure 11 presents the importance-performance plot obtained from online reviews in 2022, and the IPA plot using online reviews in 2018 is overplayed in Figure 10 for easier comparison. We find that attributes that mostly need to be improved change to interior, intelligence, comfort and maintenance. The performance of light and multimedia increases above the average. The performance of the electronics also increases but its importance becomes very low. The importance of intelligence increases a lot, which implies that customers are paying more attention to the Intelligence functions such as parking assistance and car networking. These results indicate that the proposed IPA framework is applicable to actual product improvement planning.
The importance-performance plot for SUV A in 2018 obtained from online reviews.

The importance-performance plot for SUV A in 2022 obtained from online reviews.

6.2.2. Validation using maintenance records before and after product improvements
According to the IPA results using maintenance records in Section 5.3, attributes that mostly need to be improved are Electronics, Structure, and Control. Table 10 shows the changes in occurrence frequencies for these attributes. We find that the proportion changes for most attributes are relatively small. In Figure 13, the IPA plot obtained from maintenance records with rankings of occurrence frequency proportion changes is presented. Compared to the labeled plot obtained from online reviews in Figure 12, the results from maintenance records are more irregular. Except for Electronics, Structure, and Operation, the changes in occurrence frequencies of other attributes are more likely to fluctuate. One possible explanation is that most of the maintenance records for improved products come from 2019 due to the limited data source, then the attribute performance is very close to the original product (i.e., SUV A in 2018). Thus, the improvement scores may not be as obvious as those obtained from online reviews.
Occurrence frequency proportion change for vehicle attributes obtained from maintenance records from 2018 to 2019. $ \Delta {P}_i $
is the occurrence frequency change for attribute
$ \Delta {P}_i $
is the occurrence frequency change for attribute $ i $
(refer to equations (10) and (13))
$ i $
(refer to equations (10) and (13))

The importance-performance plot for SUV A in 2018 obtained from online reviews with rankings of changes of customer sentiment scores for these attributes.

The importance-performance plot obtained from maintenance records in 2018 with rankings of occurrence frequency proportion changes of attributes.

The combined importance-performance plots with $ \alpha =0.5 $
(upper) and
$ \alpha =0.5 $
(upper) and $ \alpha =0.7 $
(lower).
$ \alpha =0.7 $
(lower).

7. Integration of IPA results obtained from online reviews and maintenance records
Using the integration method proposed in Section 3.5, the integrated IPA results are obtained. Figure 14 shows the plots of two combined IPA results with $ {\alpha}_i=0.5 $
and
$ {\alpha}_i=0.5 $
and $ {\alpha}_i=0.7 $
for all attributes, respectively.
$ {\alpha}_i=0.7 $
for all attributes, respectively.
In both two cases, the attribute “Electronics” falls into the second quadrant. Therefore, “Electronics” shows the highest priority for improvement. When $ {\alpha}_i=0.5 $
, the IPA results from online reviews and maintenance records are equally valuable. In this case, besides “Electronics,” “Control” has the lowest performance, and it can be considered for design improvement. When
$ {\alpha}_i=0.5 $
, the IPA results from online reviews and maintenance records are equally valuable. In this case, besides “Electronics,” “Control” has the lowest performance, and it can be considered for design improvement. When $ {\alpha}_i=0.7 $
, the weight of reviews is higher than the records. In this case, customers’ subjective opinions are more important than the objective performance extracted from maintenance records, and more attention is paid to the short-term experience of the vehicle. The results show that “Electronics” and “Light” are the focused attributes for improvement.
$ {\alpha}_i=0.7 $
, the weight of reviews is higher than the records. In this case, customers’ subjective opinions are more important than the objective performance extracted from maintenance records, and more attention is paid to the short-term experience of the vehicle. The results show that “Electronics” and “Light” are the focused attributes for improvement.
8. Discussion
In this research, a case study of a typical sport utility vehicle in China’s auto market is presented to demonstrate the proposed framework. Our IPA results show that from online reviews, Multimedia, Electronics, and Light are the attributes that most urgently need to be improved in the year of 2018. From maintenance records, electronics, structure, and control have a higher priority for improvement. These insights can help manufacturers with product improvement from the aspects of both customer satisfaction and product durability. Also, these improvements have already been implemented in new vehicles.
In addition, we find that the IPA results obtained from online reviews and maintenance records are inconsistent, which indicates that customers’ reviews do not always match the real performance of a vehicle model. Customer reviews are usually concerned about the general performance of vehicles shortly after purchase, while maintenance records can reflect more detailed information for vehicle durability and performance in long-term use. Thus, manufacturers should not solely rely on online reviews, and integrated data can provide a more comprehensive understanding of the product’s performance and guide design improvement. The improvements suggested by the analysis of maintenance records can contribute to the design of more durable products and may reduce the warranty cost for manufacturers from a long-term view.
In our study, the validity of these IPA results is examined by comparing the obtained results with the actual product improvements on the market and the analysis of online reviews for the improved product. We find that the suggested attributes are all improved for both online reviews and maintenance records, and “light” has the largest improvement scores. Besides, the improvements claimed by auto companies seem to be more consistent with the analysis results from online reviews. This may be because companies are more concerned with the subjective opinions of customer requirements. Also, the short-term vehicle performance may be more noticeable to customers, and they are more likely to post these experiences online.
In order to get a more comprehensive view of multisource data analysis, we propose an integration method by assigning different weights to the results obtained from online reviews and maintenance records. When the weights vary, the locations of most attributes change in the IPA plots. Auto companies can define their own weights to different data sources according to the quality or reliability of collected data, and implement targeted improvement strategies. An interesting observation is that we find “Electronics” is always in quadrant II regardless of what weights have been assigned. One possible reason is that “Electronics” has high priorities for the improvement of both online reviews and maintenance records. Auto companies are highly recommended to take the improvement of such product attributes seriously.
The potential theoretical implications of our framework are concentrated in three aspects. First, the integration of online reviews and maintenance records for product attributes analysis can be extended to other data sources (e.g., customer surveys, social media) following the same workflow within our proposed framework, as long as product and usage-related information can be extracted from these sources. Multisource data can cross-validate each other and provide more comprehensive insights on product design performance. Second, the proposed validation process in our framework cannot just be applied to IPA, but also to the results obtained from other methods for product improvement, such as the Kano model analysis. Validated analysis results are more informative for product designers to make design decisions. Finally, our framework has the potential to include the design trend analysis using data from different time scales. For example, online reviews can be collected from multiple time periods to evaluate and compare the change in product design and customer satisfaction longitudinally, which allows product designers to better capture the market dynamics in their design processes.
In summary, our research contributes to a general framework that can process and integrate IPA results from multisource data. It can also be extended to the attribute analysis of other products, such as consumer electronics and engineering machinery. With our framework, designers and manufacturers can analyze customer needs and improve their products more efficiently and wisely. For example, after adding new features to products (e.g., driver assistant system for vehicles, foldable screen for phones), manufacturers can apply our framework to evaluate customers’ degree of acceptance on these innovative features by examining the IPA results for the updated product attributes (e.g., Intelligence for vehicles and Screen for phones). These results can support manufacturers to make more reasonable strategies for product improvement.
9. Conclusion
In this paper, we propose an integrated framework for the IPA of product attributes from online reviews and maintenance records. Compared with previous research using single-source data, our study establishes a unified and systematic framework of complementing subjective online reviews with objective product maintenance data in IPA. The combined results from multisource data include both subjective and objective as well as short-term and long-term information on product performance, which can provide more comprehensive insights into customers’ needs. To smooth the sentiment analysis of customer reviews, we propose a semantic group generation method to more accurately capture customers’ attitudes toward products. Specifically, to overcome the issue of processing sentences with multiple identified product attributes, we develop a dependency parsing-based method to facilitate the separation of descriptions in such sentences, which can further improve the accuracy of sentiment analysis. This method considers both contextual information and semantic relations in opinion-term extraction without requiring extensive pre-labeled data. Our framework also incorporates a validation process for the obtained IPA results. The validity of the improvement suggestions from IPA can be examined by comparing the IPA results with the actual product improvements on the market or the analysis of customer online reviews after a period of time. A new metric, improvement score, is developed to quantify the validity of the obtained IPA results. Designers and manufacturers can utilize our method to extract and evaluate customer needs more effectively.
One limitation of this study is that the IPA is performed with data in one or two fixed time periods, the temporal change is not dynamically modeled, and the latest trends in the auto market may not be fully reflected. In the future, we will explore how to efficiently process online reviews and product maintenance records in time series and get design insights from their dynamic changes. Other novel techniques, such as graph neural networks, can be used to model and predict the relations between customers and products and further improve the quality of IPA.
Acknowledgements
The authors would like to acknowledge the financial support from the Shanghai Science and Technology Commission “Yangfan” Program (20YF1419300) and the National Natural Science Foundation of China (52005328). The authors would also like to acknowledge the technical support from Yilin Zhang, Zidong Huang, and Xinyi Yang.
Abbreviations
Indexes
-
$ i $
-
index of product attribute
-
$ j $
-
index of major product attribute for improvement
-
$ k $
-
index of tree
-
$ m $
-
index of maintenance record
-
$ n $
-
index of leaf
-
$ r $
-
index of customer review
-
$ t $
-
index of iteration step
-
$ w $
-
index of keyword


Symbols
-
$ \overline{Imp_i} $
-
normalized importance of attribute
$ i $
-
$ \overline{P_i} $
-
performance for attribute
$ i $
from maintenance records -
$ \overline{S_i} $
-
performance for attribute
$ i $
from customer reviews -
$ {a}_{wj} $
-
weight of keyword
$ w $
for attribute
$ j $
-
$ {c}_{wj} $
-
proportion of occurrence frequency of keyword
$ w $
in negative semantic groups -
$ {D}_n $
-
indices of data assigned to leaf
$ n $
-
$ {F}_{wj} $
-
mentioned frequency of keyword
$ w $
for attribute
$ j $
in negative semantic groups -
$ {g}_{wj} $
-
flag of improvement of component
$ w $
for attribute
$ j $
-
$ {Gain}_{kni} $
-
gain for leaf
$ n $
in tree
$ k $
to be split using attribute
$ i $
-
$ I $
-
set of indexes of all attributes
-
$ {Imp}_i $
-
importance of attribute
$ i $
from XGBoost model -
$ J $
-
total number of product attributes
-
$ K $
-
number of constructed trees
-
$ M $
-
total number of maintenance records
-
$ {p}_j $
-
improvement score of attribute
$ j $
-
$ {P}_{im} $
-
number of related maintenance items regarding product attribute
$ i $
in maintenance record
$ m $
-
$ {P}_i $
-
average number of maintenance items of attribute
$ i $
-
$ R $
-
total number of customer reviews
-
$ {R}_i $
-
number of reviews containing attribute
$ i $
-
$ {S}_{ir} $
-
sentiment polarity for attribute
$ i $
in review
$ r $
-
$ {S}_i $
-
average sentiment polarity for attribute
$ i $
-
$ W $
-
number of most frequently mentioned keywords


 Open access