


Political science has long emphasized voting and protest as the methods through which racial minority communities engage the American political system. This focus has yielded many insights into political behavior, mobilization, and representation (Dawson Reference Dawson1994; Fraga Reference Fraga2018; García Bedolla and Michelson Reference García Bedolla and Michelson2012; Gause Reference Gause2022). Yet, by focusing so heavily on mass political participation, scholars have overlooked the role of lobbying. Lobbying is a strong, institutionalized mechanism through which interest groups seek to shape public policy. This oversight is particularly consequential for scholars. Lobbying often is viewed as an elite, exclusionary arena dominated by well-resourced organizations (Gilens and Page Reference Gilens and Page2014; Strolovitch and Forrest Reference Strolovitch, Forrest, Maisel, Berry and Edwards2010). More recently, scholars have shifted to explore the potential of lobbying as a viable method for improving racial and ethnic minority representation at the national level and within specific institutional venues, such as the courts and the bureaucracy (Dwidar Reference Dwidar2025; Hero, Preuhs, and Meeks Reference Hero, Preuhs and Meeks2019; Minta Reference Minta2021).
To contribute to this growing literature, this study introduces a new dataset of more than 250,000 California bill analyses produced by legislative staff between 1997 and 2018 (Do Reference Do2026). These analyses provide an official breakdown of proposed state legislation by committee staffers and include a list of interest-groups’ positions on a bill. I used this dataset to examine a crucial question in the study of racial minority representation: Under what coalition conditions can racial minority interest groups (RMIGs) influence policy making in a system widely perceived as dominated by business interests and elite actors? From a resource-based perspective, RMIGs are expected to have a limited impact in lobbying arenas. However, I argue that RMIGs are uniquely positioned to join large and diverse coalitions that may enable them to achieve greater success. These coalitions serve as powerful signals to legislators that reduce uncertainty and demonstrate broad support for specific bills. With these data, I assessed the extent to which RMIGs are found in larger and more diverse coalitions relative to other interest groups and tested whether coalition size and diversity are associated with increased legislative success for RMIGs. Systematically identifying RMIGs among these lists allowed me to examine lobbying activity on an unprecedented scale. It enabled new inquiries into how policy makers acknowledge groups, the frequency of RMIGs in bill deliberations, the types of legislative coalitions they join, and the conditions under which they are present during policy debate.
This article also introduces a novel dataset and data-collection approach that enables analysis of RMIG dynamics in the legislative process. My goal is to expand the empirical scope of race, ethnicity, and politics scholarship and challenge conventional assumptions about how and where marginalized groups gain political representation by applying these data to questions of RMIG coalition efficacy. I found that RMIGs are more likely than other interest groups to be in large and diverse coalitions. Although coalition size and diversity generally increase the probability of legislative success, RMIGs do not automatically benefit from these factors. Benefits emerge only when these coalitions are embedded in durable coordination networks or in coalitions with other groups with whom they have prior cooperation. The implications of these findings suggest that RMIGs should strategically focus on entering either large or diverse coalitions but only simultaneously pursue large and diverse coalitions with groups with which they have previously cooperated.
A RACIAL AND ETHNIC TUNE IN THE PLURALIST HEAVEN?
The formation and emergence of new interest groups representing racial minorities significantly impacted the role of lobbying as a means of voicing the demands of marginalized racial minority communities (Strolovitch Reference Strolovitch2007). Since the 1960s, groups previously excluded from the political system have largely become integrated as participants in policy making through interest groups. Organizations advocating for marginalized communities—including the poor, women, racial minorities, and other disadvantaged segments of society—have become more prevalent over time because they have found firmer footing in lobbying (Strolovitch Reference Strolovitch2007; Wilson Reference Wilson1974). Groups that represent the interests of specifically racial minority communities, which I refer to as RMIGs, play a crucial role in advocating for their respective racial groups by raising concerns within their communities and working to pass policies that benefit them. If anything, the “Pluralist Heaven” criticized by Schattschneider (Reference Schattschneider1960), in which groups represent all interests of society, should be much closer today than it was in the past.
Groups representing the interests of specifically racial minority communities play a crucial role in advocating for their respective racial groups by raising concerns within their communities and working to pass policies that benefit them.
However, we can sense intuitively that equal representation in lobbying may not be the reality. Although thousands of voices are heard in Congress and state capitols across the country, it is evident that the majority and the loudest are primarily from elite, wealthy areas of our country, such as those associated with major corporations, industries, and powerful professional groups. Are RMIGs, which represent politically marginalized racial minority groups, excluded from the legislature, and under what conditions can they compete on a par with other groups? The answer to this question requires reliable data on the official lobbying efforts of RMIGs over a long period, along with their positions on specific bills. Current lobbying data, however, may not meet every aspect of these requirements.
THE ROLE OF LARGE AND DIVERSE LOBBYING COALITIONS FOR RMIGS
RMIGs face steep structural disadvantages in the American lobbying system. They represent communities with limited financial resources that face institutional racial bias (Strolovitch and Forrest Reference Strolovitch, Forrest, Maisel, Berry and Edwards2010). In these ways, RMIGs often are assumed to be marginal players in lobbying. Despite these constraints, they have a historical and strategic advantage in building large and diverse coalitions that can amplify their influence in the policy-making process.
This study provides a theoretical framework for reconceptualizing RMIGs as distinct from our traditional understanding of interest groups. The main distinction between RMIGs and conventional interest groups is that RMIGs advocate primarily for the interests of a racial group. This racial distinction cannot be taken lightly because it shapes the obstacles and resources available to RMIGs (Hutchings and Valentino Reference Hutchings and Valentino2004). The actions of RMIGs are evaluated through racialized views and stereotypes. For example, they often must overcome racist views of whether specific policies are deserving, as in the case of welfare reform (Gause Reference Gause2022).
Conversely, racial identity can be a source of strength. Linked fate, a phenomenon described by Dawson (Reference Dawson2003) in which racial minorities feel connected through their racial identity, is much stronger and more prevalent than other identities. A shared sense of linked fate allows RMIGs to mobilize and cooperate more easily and more often than other groups. These resources and barriers are distinct to RMIGs, and they navigate a lobbying environment that is wholly different from that of classic interest groups. Finally, the RMIGs’ road into political incorporation as participants in lobbying was shaped by their experiences in social movements, which helped these groups to develop strategies based on cooperation and coalition building. These experiences and their trajectory from social movements shaped their behavior as lobbying groups in legislatures. It is an approach that is at the heart of RMIG lobbying such that rather than engaging in the typical resource-intensive strategies of hiring professional lobbyists, buying access, and providing legislative subsidies, RMIGs lean into coalition building and informational signaling. Joining coalitions is not incidental or occasional but rather a constitutive part of RMIG lobbying.
RMIGs can compete in lobbying when they participate in broad coalitions that span racial, sectoral, and ideological lines. This coalition-building capacity comes from their origins in civil rights and other outsider social movements. These origins honed their ability to cooperate across organizations and constituencies. Unlike many traditional interest groups that rely on financial contributions and insider access, RMIGs often rely on informational signals. Coalitions are a powerful means for sending these signals to legislators. My theoretical framework posits that RMIGs are especially adept at and more likely to engage in large and diverse coalition building. It also would follow that participation in large and diverse coalitions increases RMIGs’ chances of policy success. This study contributes to our understanding of racial minority representation by recasting RMIGs as coalition entrepreneurs who engage in broad, diverse coalitions because this helps them to overcome their material resource disadvantages.
By drawing on theories of diverse signaling in policy making (Dwidar Reference Dwidar2022a, Reference Dwidar2025; Lorenz Reference Lorenz2020; Phinney Reference Phinney2017), this article argues that coalitional size and diversity reduce legislators’ uncertainty about unfamiliar and complex policies. Both Phinney (Reference Phinney2017) and Lorenz (Reference Lorenz2020) showed that coalition diversity is associated with lobbying success. The diversity of coalitions serves as a proxy for legislators, who rely on interest-group signals to indicate the political benefits or drawbacks of a bill and its viability (Lorenz Reference Lorenz2020). Drawn by the goal of reelection, legislators seek to align their legislative work with the issues and policy priorities of their constituencies (Fenno Reference Fenno1978; Mayhew Reference Mayhew1974), but they often operate with imperfect information about what they might be. They must rely on cues and signals that helps them to navigate the complexities of the many bills on which they must act. Lobbying signals from interest groups provide these cues. Bills with support from a diverse coalition, as discussed by Phinney (Reference Phinney2017), are more credible to legislators because they (1) combine a wider range of advocacy tactics and networks; (2) signal that a proposal has broad rather than narrow appeal; and (3) are more difficult to sustain, making their support costlier. As a result, when diverse coalitions converge on a bill, legislators interpret that signal as stronger evidence that the proposal is both substantively worthy and politically more viable than when support is from a more homogeneous set of groups. This study builds on these findings, particularly on whether this theory is true for RMIGs and at the state level.
The idea that diversity in political arenas is conducive to racial minority representation also is evident in scholarship related to descriptive representation. Minta (Reference Minta2021) found that the influence of Black and Latino civil rights organizations increased when there were more legislators of color in Congress and represented in important committees. Racial and ethnic minority interests are more likely to be championed when Congress is more diverse. According to Minta (Reference Minta2021), the importance of diversity begins at the institutional level: “The inclusion of more advocates in Congress, and the presence of strong ties to these advocates, enhances the lobbying effectiveness of civil rights organizations by creating a cadre of legislators who are willing to actively champion the policies and legislation of these groups and of minority constituents.” What happens at the subnational level in contexts in which legislatures remain homogeneous or lack diversity in their legislature? I argue that the power of diversity can be used by the groups themselves, especially for RMIGs. Coalitional diversity at the group rather than the institutional level can be effective in expanding the reach of marginalized interests. The expectation is that in more-diverse legislatures, RMIGs can be more successful in the pursuit of their interests, and this effect may be magnified if they can join diverse coalitions.
The size of a coalition also should impact its ability to influence. As discussed previously, other studies have shown that the diversity of coalitions leads to more influence at the national and bureaucratic levels (Dwidar Reference Dwidar2025; Lorenz Reference Lorenz2020; Phinney Reference Phinney2017). However, most previous scholarship indicates that there is little association between the sizes of lobbying coalitions. For example, Lorenz (Reference Lorenz2020) stated that “At the same time, I find little association between committee consideration and lobbying coalitions’ size or their interests’ PAC contributions.” Based on my theory of RMIG lobbying, I expect RMIGs to be more effective not only in bringing in disparate partners with different areas of interest but also in joining burgeoning coalitions. If they are likely to be in larger coalitions, does this increase their influence? I argue that the size of the coalition operates in similar ways to its diversity. It communicates to legislators in their “fog of uncertainty” that there are many potential interests in a policy consideration with a greater chance of electoral reward or punishment. At the same time, the size of the coalition may not be as strong a cue as its diversity. Large coalitions imply broad support and diverse coalitions composed of interest groups from different sectors (e.g., racial justice, labor, faith, and environmental) signal cross-cutting legitimacy. Legislators may interpret the benefit of supporting a bill differently if 100 groups from the same sector of interests signal their support for it, compared to whether a smaller number of 25 groups from 10 different sectors signal support. Building large coalitions can be costly because it requires time and effort to forge these relationships (Dwidar Reference Dwidar2025; Hula Reference Hula1999). Interest groups must determine whether it is strategically preferable to focus their efforts on maximizing coalition size or diversifying it. These cues become even more consequential for issues in which legislators may lack expertise or have other external pressures. For these reasons, I expected that the composition of lobbying coalitions would serve as a credible heuristic, thereby increasing the likelihood that legislators would support the policy position. This theoretical framework led to the following hypotheses:
-
• H1: The participation of RMIGs is associated with coalitions that are larger and more diverse than non-RMIG coalitions.
-
• H2: RMIG bills secure legislative passage when they are supported by large and diverse coalitions.
I reconceptualized RMIGs not as structurally doomed actors but instead as participants operating within a distinct signaling model of lobbying influence. Because they lack the financial and political power of elite interests, RMIGs primarily rely on coalition-based lobbying that leverages their ability to more easily join large and diverse coalitions. Theoretically, it is in their interest to be in these types of coalitions because they communicate electoral and political information to legislators that could transcend the fog of uncertainty. These approaches to lobbying are drawn from their historical roots in collective action, protests, and organizing in previous social movements. Coalitions serve as observable signals to legislators about the legitimacy and level of support for a policy ask. I could not directly observe the strategic work and planning that may have preceded coalition formation, but the data allowed me to examine how these realized coalitions structure the effectiveness of lobbying for RMIGs. Working backward, we can infer that the coalition characteristics of RMIG lobbying that we observed are likely part of broader strategic considerations, especially if these patterns persist over time. In other words, if RMIGs are consistently in large or diverse coalitions, then it might be more than a simple coincidence. It also is more impactful when these types of coalitions enable RMIGs to prevail.
NEW DATA IN LOBBYING
Most studies about lobbying in American politics rely primarily on data made available by the Lobbying Disclosure Act (LDA) of 1995 (Baumgartner and Leech Reference Baumgartner and Leech2001; Bertrand, Bombardini, and Trebbi Reference Bertrand, Bombardini and Trebbi2014; Furnas, Heaney, and LaPira Reference Furnas, Heaney and LaPira2019; LaPira and Thomas Reference LaPira and Thomas2017). The LDA data begin with lobbying reports filed in 1998 and continually accrue. Although these reports are a clear and valuable source of data, they often are incomplete. They rarely contain clear information on the lobbying activities of these organizations. More important, they do not record organizations’ positions on a bill, limiting the ability of researchers to assess the influence of interest groups over legislative outcomes (Kim and Kunisky Reference Kim and Kunisky2021; Lorenz Reference Lorenz2020). These limitations of available data often stymie empirical studies of interest-group participation.
Other scholars developed new methods of capturing lobbying activity by leveraging unique features of the data-generation process. Thieme (Reference Thieme2024) used a unique feature of Wisconsin’s state legislature to capture reported lobbying expenditures and time to measure the level of effort devoted to policy proposals. These measures could serve as proxies for how important an issue is to an interest group and shed light on how lobbying can influence policy outcomes. Lorenz (Reference Lorenz2020) introduced lobbying data compiled by a nonprofit organization called MapLight. This dataset is unique in that it records instances of organizations taking a clear position on congressional bills from 2005 to 2018 for approximately 16,000 organizations. Most of these positions are from public statements made by the organizations through their website, open letters, press releases, and other publicly available sources. However, there are concerns related to selection bias in this dataset. MapLight does not fully capture every instance of interest-group activity, but only approximately 20% of bills were introduced during this period (Lorenz Reference Lorenz2020). Additionally, the MapLight data fail to randomly sample or select bills for research, instead relying on the salience of a bill. As Lorenz (Reference Lorenz2020) stated, “Either issue could introduce sample-selection problems into MapLight’s data-collection process, hampering the data’s potential for generating descriptive or causal inferences.”
I addressed these concerns by compiling an original dataset of California bill analyses from 1997 to 2018. The data contain analyses for 33,176 legislative bills proposed to the California Assembly and Senate. The data record every instance of a proposed bill. The data-generating process relies on the formal rules of proposing legislation. Every bill proposed is assigned a number, keyed to a committee, and sent to be analyzed by committee staffers. From a bill’s introduction to its final vote, staffers must create and update an analysis of it at every substantive stage of the legislative process. Committee staffers are partisan only in that they work for the committee chair, who is from the majority party in the legislature. The bill analyses that they produce, however, are generally as neutral as possible. Bill analyses present both sides of a policy issue as communicated to them by interested parties, legislative history, and existing law. Committee staffers tend to be long-serving, policy-area experts who rarely are replaced when a new committee chair is appointed. Although they are similar to legislative agencies such as the Congressional Budget Office and the Congressional Research Service, committee staffers who write the analyses report back to a partisan committee chair. Nevertheless, the data drawn from the analyses essentially comprise an objective and comprehensive survey of all policies considered and how they have evolved through the legislative process.
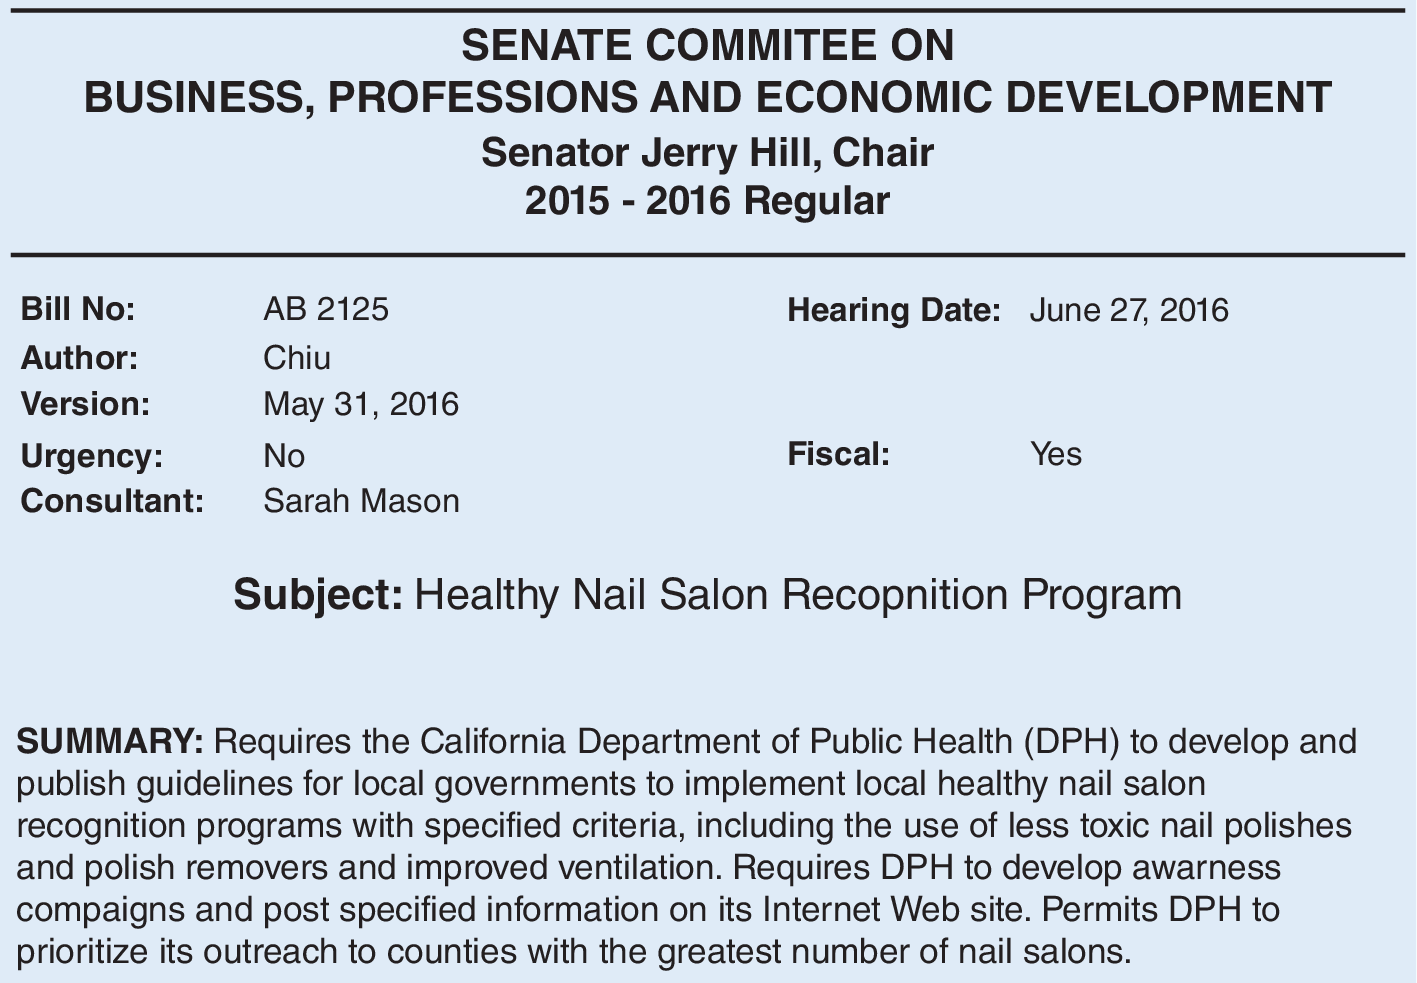
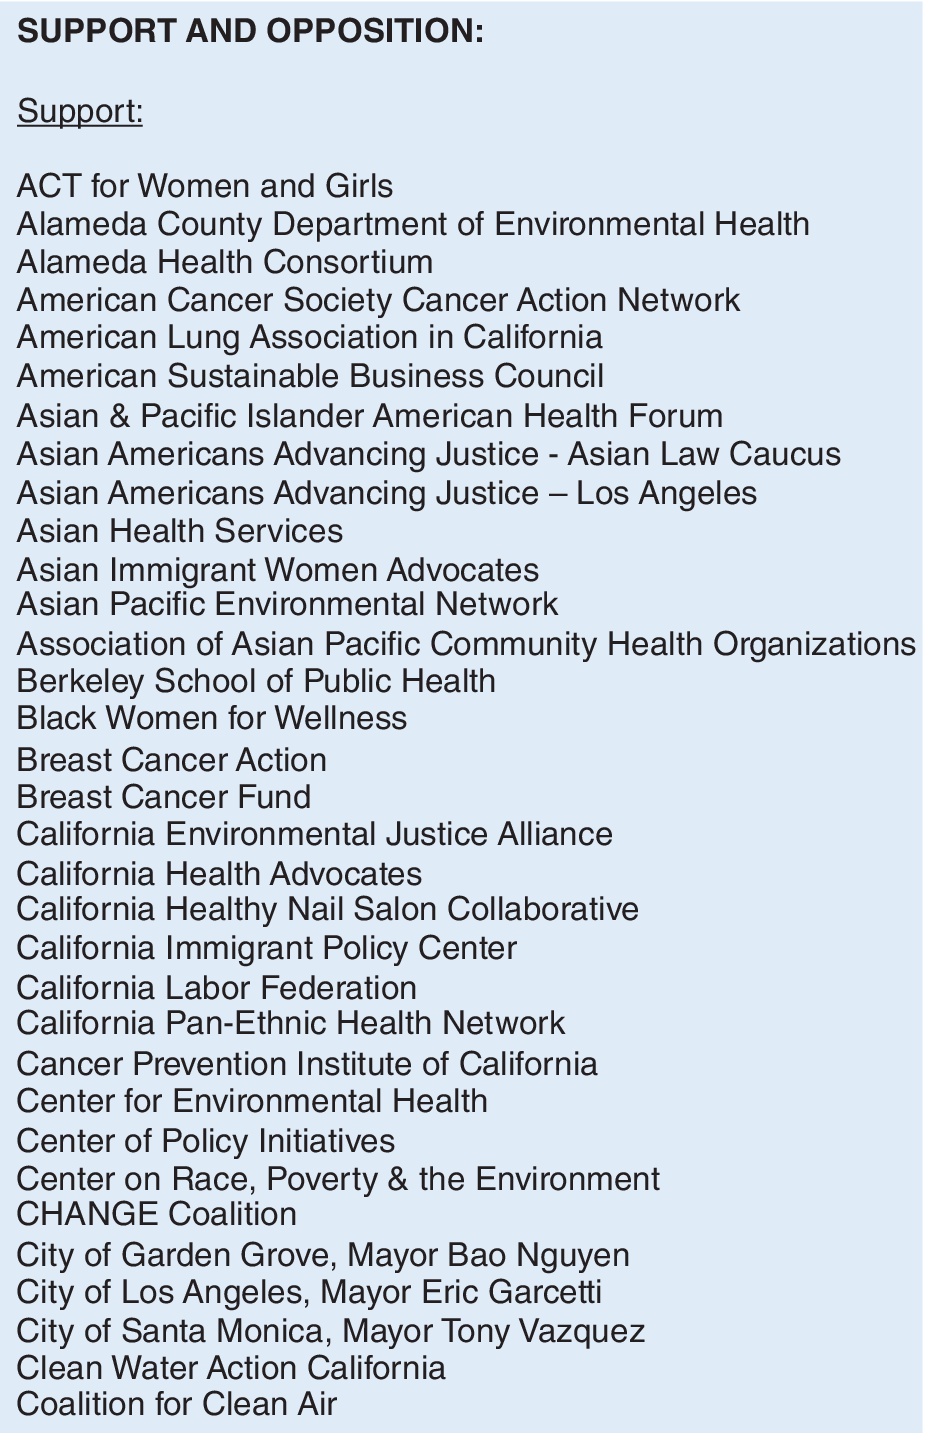
As shown in figure 1, the bill analyses provide information about the bill’s topic, author, proposed change, and submission date; a summary of its proposal; and whether it is fiscal in nature. The analyses also list organizations that have sent formal letters in support of or in opposition to the bill (figure 2). When an organization sends a letter, it signals its approval or disapproval of a policy idea to the legislator. The letters often are sent to a central address, collected from an online submission, and sent directly to committees or relayed by the bill authors. The listing of the support and opposition to bills is not affected by the drafting of the bill analysis. The committee staffers merely report the names of groups and their positions gleaned from letters that arrive in their committee office. Legislators and their staff view these signals throughout the legislative process. For purposes of this study, this clearly indicates an official attempt to lobby or sway the legislators.
Example of a California Bill Analysis

Figure 1 Long description
The document is structured into four distinct horizontal sections.
1. Header Section: Centered text at the top reads SENATE COMMITTEE ON BUSINESS, PROFESSIONS AND ECONOMIC DEVELOPMENT, followed by Senator Jerry Hill, Chair, and 2015 - 2016 Regular.
2. Metadata Section: A two-column layout below a horizontal line.
• Left Column: Bill No. is A B 2125. Author is Chiu. Version is May 31, 2016. Urgency is No. Consultant is Sarah Mason.
• Right Column: Hearing Date is June 27, 2016. Fiscal is Yes.
3. Subject Line: Centered bold text reads Subject: Healthy Nail Salon Recognition Program.
4. Summary Block: A paragraph of text starting with the bold word SUMMARY. It states that the bill requires the California Department of Public Health D P H to develop and publish guidelines for local governments to implement healthy nail salon recognition programs. Criteria include less toxic nail polishes, polish removers, and improved ventilation. It also mandates D P H to develop awareness campaigns and post information on its website, prioritizing outreach to counties with the highest number of nail salons.
Example of California Bill Analysis Support Listing

Figure 2 Long description
The document begins with the bold header SUPPORT AND OPPOSITION followed by the underlined sub-header Support. Below this is an alphabetical list of 32 supporting entities:
* A C T for Women and Girls
* Alameda County Department of Environmental Health
* Alameda Health Consortium
* American Cancer Society Cancer Action Network
* American Lung Association in California
* American Sustainable Business Council
* Asian & Pacific Islander American Health Forum
* Asian Americans Advancing Justice - Asian Law Caucus
* Asian Americans Advancing Justice – Los Angeles
* Asian Health Services
* Asian Immigrant Women Advocates
* Asian Pacific Environmental Network
* Association of Asian Pacific Community Health Organizations
* Berkeley School of Public Health
* Black Women for Wellness
* Breast Cancer Action
* Breast Cancer Fund
* California Environmental Justice Alliance
* California Health Advocates
* California Healthy Nail Salon Collaborative
* California Immigrant Policy Center
* California Labor Federation
* California Pan-Ethnic Health Network
* Cancer Prevention Institute of California
* Center for Environmental Health
* Center of Policy Initiatives
* Center on Race, Poverty & the Environment
* C H A N G E Coalition
* City of Garden Grove, Mayor Bao Nguyen
* City of Los Angeles, Mayor Eric Garcetti
* City of Santa Monica, Mayor Tony Vazquez
* Clean Water Action California
* Coalition for Clean Air
These listings enable researchers to map and track the policies that concern civic and private groups, providing insight into their policy agendas. Using information from these bill analyses, I generated a dataset that recorded the support and opposition listings for every bill. I then meticulously coded each organization regarding their group type, coded the bill topic based on its title and summary, and counted the number of groups that signaled on each support or opposition side of a bill. (See online appendices A and B for the coding scheme and procedure.) This allowed me to create measures for each bill position’s composition. I then combined it with data on each bill’s outcome.
I recognize the limits to generalizability given my data’s focus on California. Nevertheless, the findings can apply beyond this case and offer insights for other states. California foreshadows demographic and issue trends nationally. The 2020 US Census reveals racial minority growth across suburban and rural counties. As states diversify, the coalition and lobbying environments observed in California are likely to emerge elsewhere. The state also consistently addresses policy issues that cross state lines, such as policing reform and environmental protection. These issues are not unique to California. More important, the barriers that RMIGs face in resource asymmetries, status, and racialized political constraints also cross state lines, rooted in broader patterns of American politics (Hutchings and Valentino Reference Hutchings and Valentino2004; Lee Reference Lee2008). The mechanisms that link race to lobbying influence also should operate similarly in other states. California is a valuable case because of its transparent legislative record that publicly lists interest-group positions. This transparency makes researching RMIG lobbying easier and more accessible.
Recent scholarship has turned increasingly to subnational contexts to explore the mechanisms and effectiveness of interest-group lobbying using similar data. Butler and Miller (Reference Butler and Miller2022), for example, examined whether lobbying affects bill movement through the legislature across three states using self-reported registrations of lobbyist positions. By contrast, my data captured coalition activity at the organizational level involve the submission of official letters by the interest groups themselves. This approach provides a more direct observation of lobbying and enables an assessment of how coalition dynamics—rather than only individual access—affects legislative success.
DESIGN
To test hypotheses H1 and H2, which predict that RMIGs will be found in larger and more diverse lobbying coalitions and that such coalitions are associated with higher rates of bill passage, I drew on the lobbying data discussed previously. For each bill, I identified all interest groups that submitted letters of support or opposition. Coalition size is operationalized as the number of groups supporting or opposing each bill. I defined a “coalition” as a group aligned on the same side of a policy issue. For the purposes of this study, a coalition refers to the set of interest groups that signal support or opposition to the same piece of legislation, thereby aligning their advocacy. At the onset, my definition aligns with traditional views of interest-group coalitions in which it is an instance of concerted efforts around shared interests. Other scholars view coalitions in different ways. Ture and Hamilton (Reference Ture and Hamilton1992) presented a viable coalition as resting on mutual self-interest; drawn from clear, individual power bases; and enduring over time—although they made exceptions for short-term coalitions with specific aims. Browning, Marshall, and Tabb (Reference Browning, Marshall and Tabb1986) viewed coalitions as a form of political incorporation—a long-term strategic alliance that pools resources to secure concessions. Dwidar (Reference Dwidar2025) drew a distinction between formal and ad hoc coalitions along similar lines. Formal coalitions have fixed membership, a coalition name, clear coordination, and dedicated staff members. These scholars highlight an important aspect of coalition building among interest groups because, over time, they tend to establish deeper levels of cooperation that is strengthened over repeated interactions. As Ture and Hamilton (Reference Ture and Hamilton1992) pointed out, the more successful coalitions are those with shared interests that persist and have some form of beneficial cooperation. Durable routine interactions (e.g., through shared advocacy and lobbying) are key markers of a more incorporated or coordinated coalition, although it may not be fully formalized (Browning, Marshall, and Tabb Reference Browning, Marshall and Tabb1986). Scholars suggest that these more-coordinated coalitions would lead to more policy success than episodic, strictly short-term coalitions. This is an important factor in determining the influence of lobbying coalitions on policy outcomes.
My approach to coalition is similar but differs in that my data do not permit me to distinguish concisely between formal coalitions and those that form simply on the basis of shared interests. To account for the possibility that some coalitions can be more coordinated or durable than others, I attempted to measure coordination among the interest groups in my data. This coordination measure captured the extent to which the same sets of groups repeatedly aligned across multiple bills in their past lobbying. Essentially, I could approximate whether groups on the same side of a bill—according to my operationalization of a coalition—were strictly ad hoc or a more stable, quasi-formal coalition in which the same groups repeatedly are on the same side. (Online appendix D describes how this measure was computed.) The underlying assumption was that coalitions with extensive shared histories are more likely to be perceived by legislators as coordinated and credible. I did not treat coordination merely as an additional control variable; rather, coalition coordination can condition the effectiveness of coalition success. Therefore, I incorporated the measure through a two-stage design. First, I estimated models on the full sample to assess baseline relationships. Second, I re-estimated the models only on observations in the top quartile of my coordination measure or bills that have coalitions with the most history of prior alignment on bills. This design allowed the analysis to control for coordination and also determined how lobbying signals operate under a higher level of coalition types.
Coalitional diversity was measured using a Herfindahl-Hirschman Index (HHI), which is used commonly in economics to assess market concentration. I adapted this index to reflect the distribution of distinct group types within each coalition. For each bill side (i.e., coalition), the proportion of groups in each category (e.g., business, labor, RMIG, and government) was calculated, and the HHI was defined as follows:

where
$ {s}_i $
 is the proportion of coalition members belonging to group type
$ i $
is the proportion of coalition members belonging to group type
$ i $
 . Coalitions dominated by a single group type tended to have high HHI values, whereas more balanced coalitions had lower HHI values. Because my theoretical expectation was that greater diversity increases lobbying effectiveness, I transformed this measure so that higher values represented more diversity, as follows:

This transformation produced a diversity score that ranged from 0, indicating no diversity (i.e., all groups are of a single type), to values approaching 1, representing higher diversity with groups evenly distributed across all group types. In cases in which no groups signaled support or opposition on a bill side, no coalition existed, and the HHI was undefined, I set the diversity score to 0 to retain the observation in the dataset. I included a separate binary indicator for whether any support was represented to ensure that “no coalition” was not conflated with a truly homogeneous coalition. Thus, bills with no coalition had diversity=0 and any support=0, whereas bills with a homogeneous coalition had diversity=0 but any support=1. This coding scheme enabled the models to distinguish between the absence of and low-diversity coalition activity.
To test hypothesis H1, which predicts that RMIGs are more likely than non-RMIGs to participate in large and diverse coalitions, I compared the average coalition size and coalition diversity (measured as 1-HHI) of coalitions that included RMIGs versus those that did not, using two sample t-tests. Because there was a possibility that the diversity calculation for RMIGs could be a mechanical result of the RMIG category, I recalculated coalition diversity after entirely removing RMIGs from the HHI calculation. If RMIGs constituted a distinct group type, their presence automatically would increase the HHI measure for diversity even if the underlying coalition composition otherwise were unchanged. Excluding the RMIG category allowed this measure to capture the diversity of non-RMIG groups alone and therefore could not be inflated simply because an RMIG was in the coalition.
I estimated logistic-regression models to predict whether a bill passed both chambers of the California state legislature, which tested H2. H2 assessed coalitional composition and predicted that RMIG-supported bills with large and diverse coalitions would be more likely to pass. The baseline model specification for H2 was as follows:

where
$ {Y}_{bt} $
 indicates passage of bill b in year t;
$ NetSuppor{t}_{bt} $
indicates passage of bill b in year t;
$ NetSuppor{t}_{bt} $
 is the number of groups supporting minus those opposing, mean-centered for interpretability; and
$ {Diversity}_{bt} $
is the number of groups supporting minus those opposing, mean-centered for interpretability; and
$ {Diversity}_{bt} $
 captures coalition diversity, which also is mean-centered so that its effect can be interpreted at an “average” level of diversity rather than at the unrealistic case of zero. Centering coalition size and diversity reduced collinearity with their interaction terms, allowing coefficients to be interpreted at substantively meaningful baselines (e.g., the mean level of coalition characteristics).
$ {X}_{bt} $
captures coalition diversity, which also is mean-centered so that its effect can be interpreted at an “average” level of diversity rather than at the unrealistic case of zero. Centering coalition size and diversity reduced collinearity with their interaction terms, allowing coefficients to be interpreted at substantively meaningful baselines (e.g., the mean level of coalition characteristics).
$ {X}_{bt} $
 includes year-, topic-, and bill-author–level controls. The variable
$ {HasSupport}_{bt} $
includes year-, topic-, and bill-author–level controls. The variable
$ {HasSupport}_{bt} $
 distinguishes between bills with and without registered support.
To examine whether the presence of an RMIG adds to these effects, I interacted RMIG presence with both coalition size and diversity. The final model included a three-way interaction of RMIG Presence x Coalition Size x Coalition Diversity, as follows:

The three-way interaction tested whether the combined influence of coalition size and diversity had differential effects for RMIG-supported bills compared to those without RMIG support. Together, these models evaluated how coalition structure and RMIG involvement shaped legislative outcomes. The expectation was that bills with high coalitional diversity and large coalitional size would pass through the legislature more often. I also examined the marginal effects implied by the three-way interaction using approaches recommended by Brambor, Clark, and Golder (Reference Brambor, Clark and Golder2006) and Hainmueller, Mummolo, and Xu (Reference Hainmueller, Mummolo and Xu2019). Specifically, I plotted the marginal effect of coalition diversity on the probability of bill passage, conditional on coalition size and RMIG presence, along with 95% confidence intervals. Online appendix G includes the robustness tests—as advised by Hainmueller, Mummolo, and Xu (Reference Hainmueller, Mummolo and Xu2019)—to evaluate my interpretation of the triple interaction.
As discussed previously, I accounted for coordination within the coalition in two steps. First, I estimated baseline models using the specifications presented previously. Second, I restricted the sample to bills with a coordination score in the top quartile and re-estimated the full set of models in this subsample. Conditioning on coordination allowed me to assess whether RMIGs gain an advantage from large and diverse coalitions when they are in more coordinated and durable coalitions.
LOBBYING DYNAMICS IN CALIFORNIA
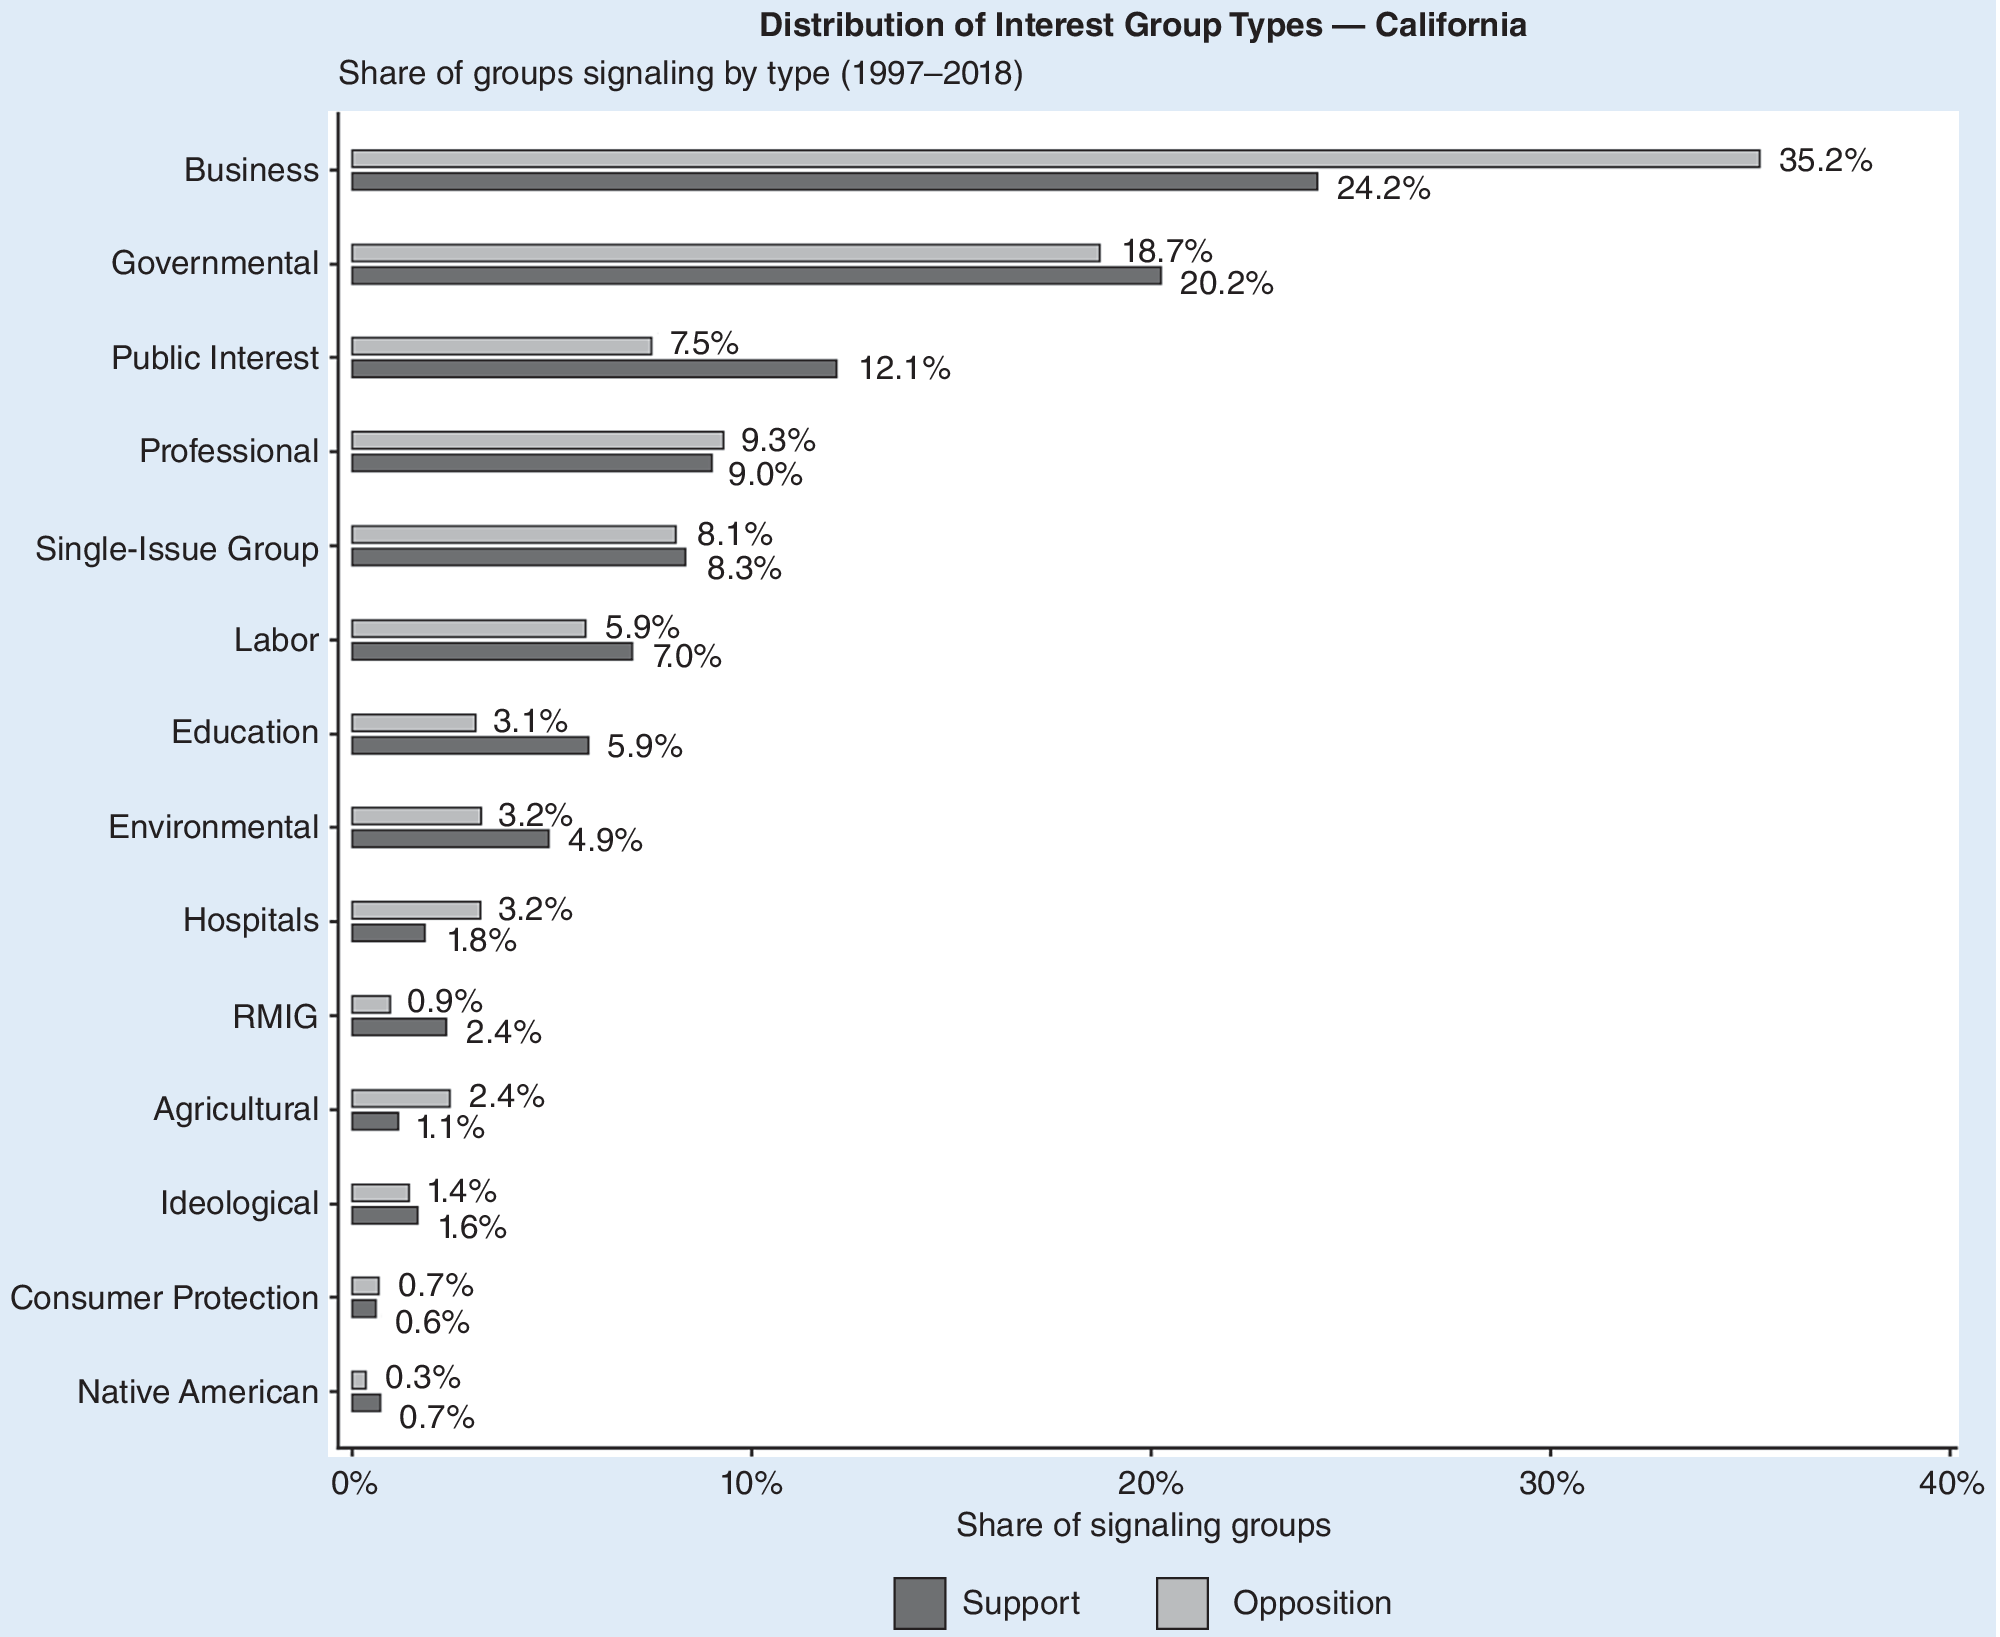
Most of the letters sent in support of or opposition to legislative proposals are primarily from business interest groups, governmental organizations, public interest groups, and professional groups. Unsurprisingly, these are the typical actors in lobbying who have the resources to monitor and signal their positions. Figure 3 illustrates the distribution of interest-group types in California, categorizing the types of signals they sent.
Distribution of Interest Group Types in California That Signaled Support or Opposition, 1997–2018

Figure 3 Long description
The horizontal bar chart displays the share of signaling groups by type on the Y-axis against a percentage scale from 0 to 40 percent on the X-axis. A legend at the bottom indicates that light gray bars represent Opposition and dark gray bars represent Support.
* Business: Opposition 35.2 percent, Support 24.2 percent.
* Governmental: Opposition 18.7 percent, Support 20.2 percent.
* Public Interest: Opposition 7.5 percent, Support 12.1 percent.
* Professional: Opposition 9.3 percent, Support 9.0 percent.
* Single-Issue Group: Opposition 8.1 percent, Support 8.3 percent.
* Labor: Opposition 5.9 percent, Support 7.0 percent.
* Education: Opposition 3.1 percent, Support 5.9 percent.
* Environmental: Opposition 3.2 percent, Support 4.9 percent.
* Hospitals: Opposition 3.2 percent, Support 1.8 percent.
* R M I G: Opposition 0.9 percent, Support 2.4 percent.
* Agricultural: Opposition 2.4 percent, Support 1.1 percent.
* Ideological: Opposition 1.4 percent, Support 1.6 percent.
* Consumer Protection: Opposition 0.7 percent, Support 0.6 percent.
* Native American: Opposition 0.3 percent, Support 0.7 percent.
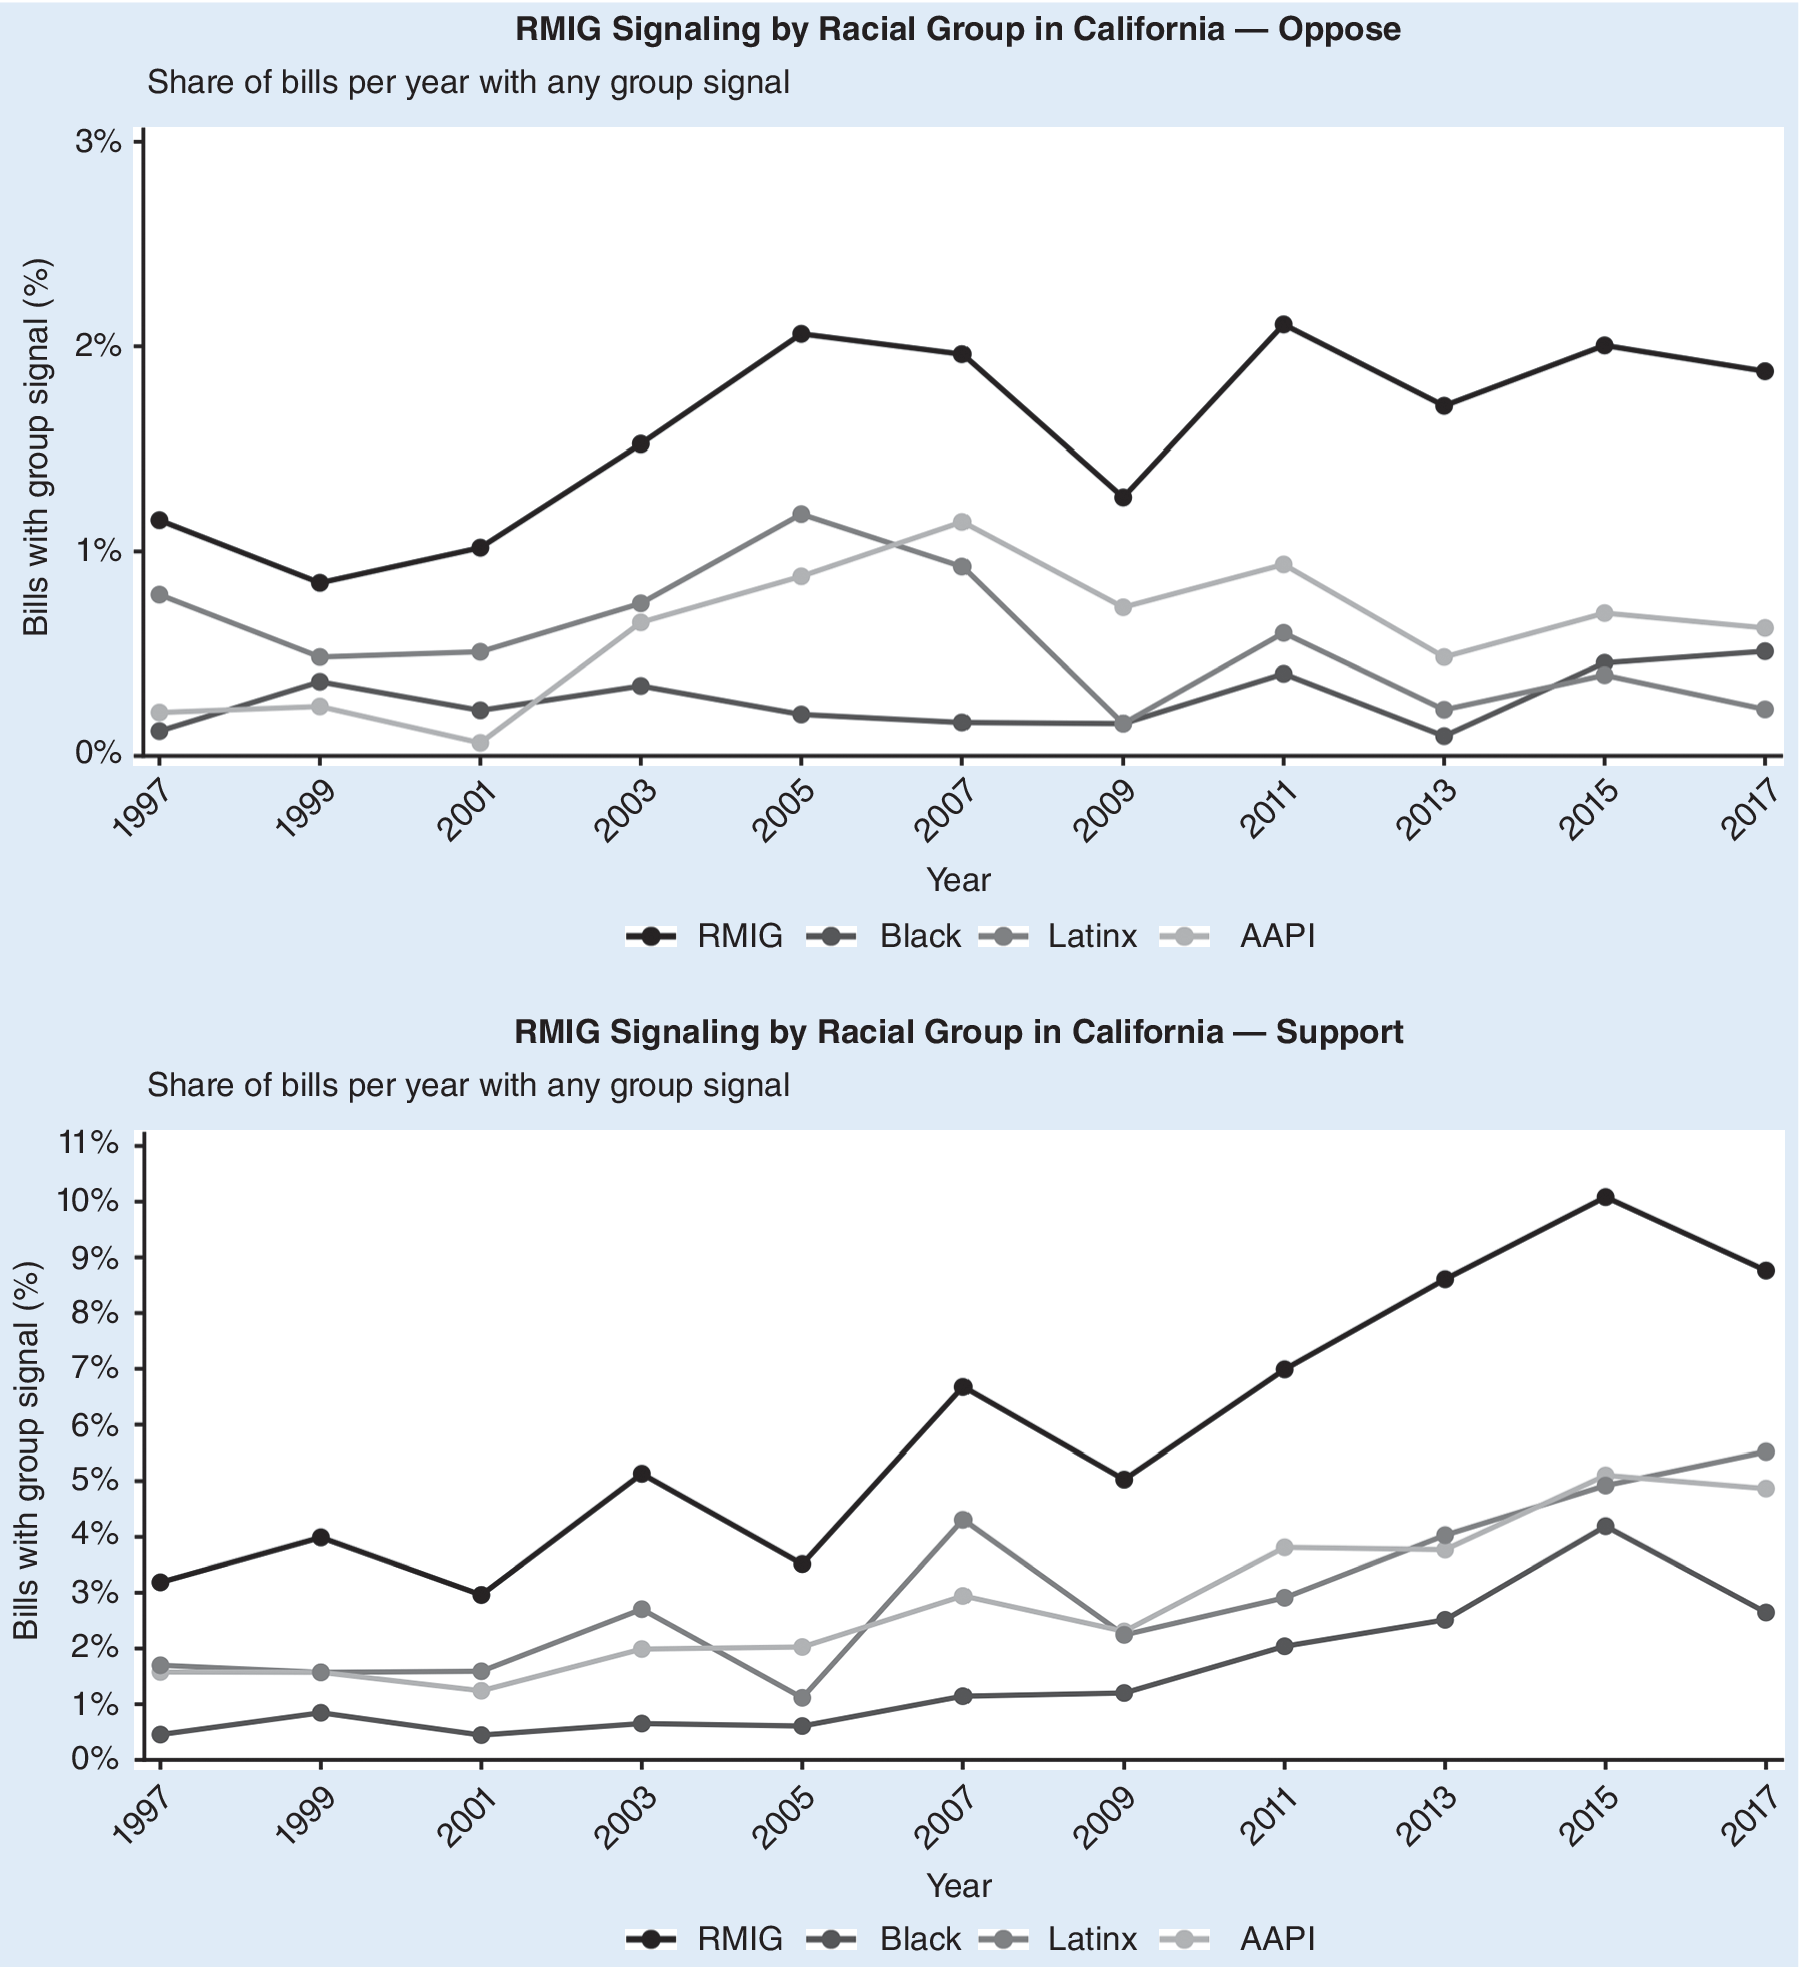
RMIG signals comprise approximately 1% to 2% of the overall observed signals during this period of 1997–2018. Most of their activity was aimed at supporting bills compared to opposing them. Although the overall lobbying of RMIGs was minimal, there is evidence that RMIG activity has grown substantially during the past two decades (figure 4). In the late 1990s, only about 3% to 4% of California bills had any RMIG signal of support, whereas by the mid-2010s, that percentage increased to almost 10%. Opposition signals remained less common overall, but they also revealed a modest increase from 1% of bills in the late 1990s to approximately 2% by the 2010s. Subgroup patterns suggest that Asian American and Latinx RMIGs in particular have expanded their lobbying presence with their support signals appearing in 4% to 6% of bills in more recent years compared to less than 2% at the beginning of the period. Taken together, these trends indicate that RMIGs not only engage in lobbying but also have steadily increased their participation in the legislative process.
RMIG Signaling by Racial Group in California, 1997–2018

Figure 4 Long description
The figure consists of two panels. Both panels share an X axis representing the Year from 1997 to 2017 in two-year increments and a Y axis representing the percentage of bills with group signals.
Top Panel: R M I G Signaling by Racial Group in California — Oppose.
The Y axis ranges from 0% to 3%.
* R M I G (black line with circles) starts at approximately 1.2% in 1997, peaks at 2.1% in 2011, and ends near 1.9% in 2017.
* Latinx (dark gray line) fluctuates between 0.5% and 1.2%, peaking in 2005.
* A A P I (light gray line) remains mostly below 1%, with a peak around 1.1% in 2007.
* Black (medium gray line) remains the lowest, consistently below 0.5%.
Bottom Panel: R M I G Signaling by Racial Group in California — Support.
The Y axis ranges from 0% to 11%.
* R M I G (black line) shows a strong upward trend, starting at 3% in 1997 and reaching a peak of 10% in 2015 before a slight drop to 9% in 2017.
* Latinx (dark gray line) starts at 1.8%, fluctuates, and rises to 5.5% by 2017.
* A A P I (light gray line) starts at 1.8% and rises steadily to approximately 5% by 2015.
* Black (medium gray line) starts at 0.5% and shows a gradual increase to 2.8% by 2017.
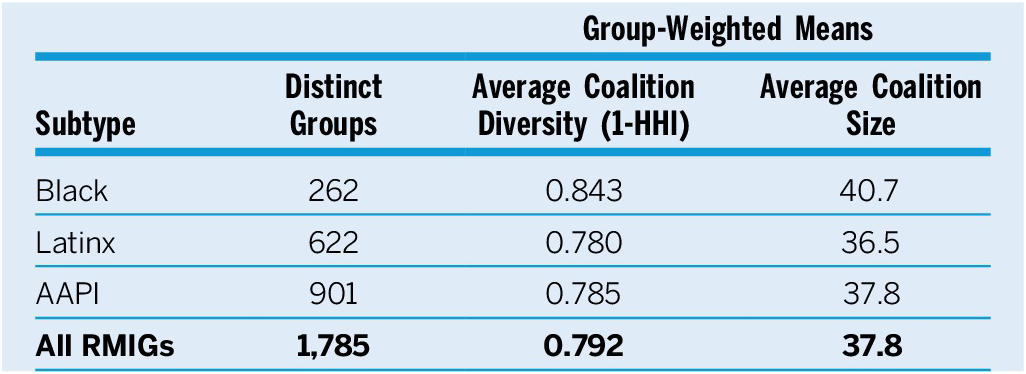
Descriptively, I also found that approximately 1,785 distinct RMIG groups lobbied during this period. The majority of RMIGs were Asian American and Pacific Islanders (AAPI), followed by Latinx and Black RMIGs. Each RMIG group type was in coalitions that were highly diverse or large. As shown in table 1, all RMIGs had an average coalition diversity score of 0.792 and an average coalition size of 37.8 groups. Black RMIGs were the most diverse and largest coalitions, compared to AAPI and Latinx RMIGs.
RMIG Lobbying Coalitions in California, 1997–2018

Table 1 Long description
The table consists of four columns: Subtype, Distinct Groups, Average Coalition Diversity (1 minus H H I), and Average Coalition Size. The data is organized as follows:
* Black: 262 distinct groups, 0.843 average diversity, 40.7 average size.
* Latinx: 622 distinct groups, 0.780 average diversity, 36.5 average size.
* A A P I: 901 distinct groups, 0.785 average diversity, 37.8 average size.
* All R M I Gs (Total): 1,785 distinct groups, 0.792 average diversity, 37.8 average size.
Notes indicate that values are group-weighted means representing the average per organization.
Notes: Group-weighted means (average per organization). Diversity is 1-HHI.
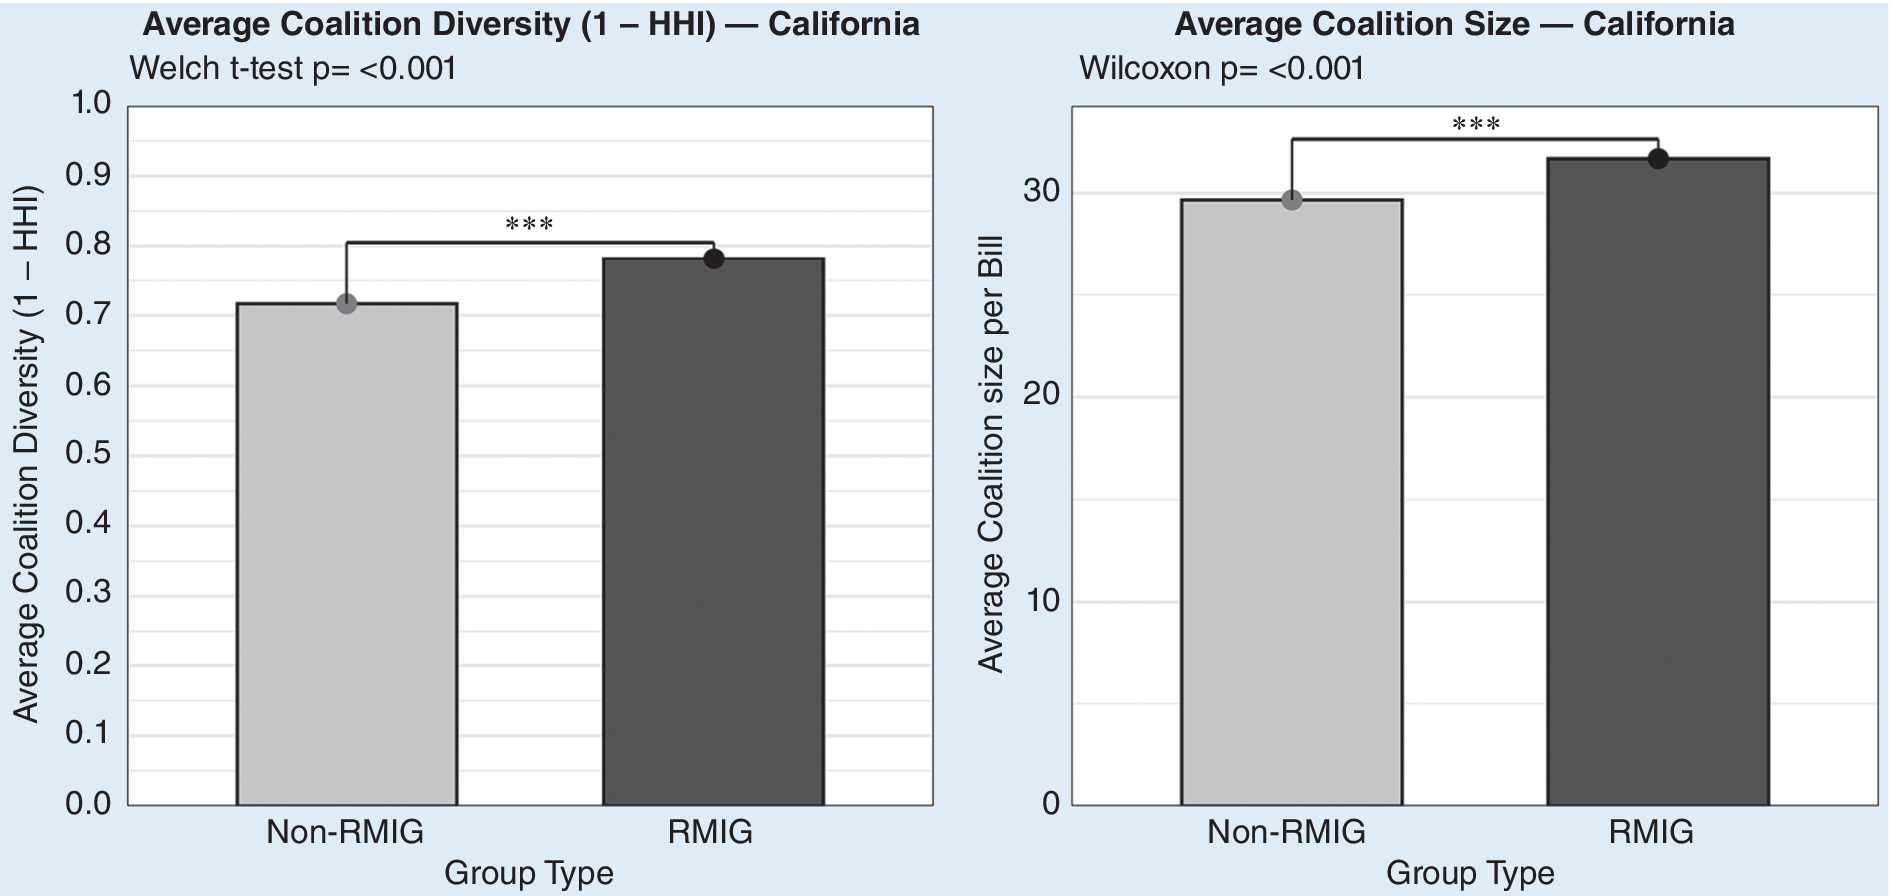
These descriptives reveal the types of coalitions in which RMIGs are found, as expected by hypothesis H1. There is evidence that RMIGs tend to be in more diverse and larger coalitions. Comparisons of coalition characteristics between RMIGs and non-RMIGs revealed substantial differences. RMIGs, on average, appeared in both larger and more diverse coalitions than other types of interest groups in California. A t-test supported that the difference in coalition size was highly significant with a p-value of less than 0.001. This also was the case when coalition diversity was compared (figure 5). Even when RMIGs were removed from the diversity calculation, coalitions on bills with RMIG participation remained significantly more diverse than those on bills without RMIGs. Coalitions involving RMIGs were substantially more diverse even when the RMIG category was excluded from the diversity calculation (i.e., the RMIG mean of 0.602 versus the non-RMIG mean of 0.390, t = –45.89, p<0.001). This demonstrates that the higher diversity of RMIG coalitions was not a mechanical artifact of RMIGs being one among 14 group categories. These results indicate that RMIGs were not randomly distributed across coalitions; instead, they were more likely to be found in coalitions that had a greater number and different interest groups. The observed results align with the theoretical expectation that RMIGs pursue legislative influence by embedding themselves in large and heterogeneous coalitions.
Comparison of Average Coalition Size and Diversity Between RMIGs and Non-RMIGs

Figure 5 Long description
A two-panel bar chart set.
Left Panel: Titled Average Coalition Diversity (1 minus H H I) — California. The Y-axis ranges from 0.0 to 1.0 in increments of 0.1. The X-axis is labeled Group Type. A light gray bar for Non-R M I G shows a value of approximately 0.72. A dark gray bar for R M I G shows a value of approximately 0.78. A horizontal line with three asterisks connects the tops of the bars, indicating statistical significance. A Welch t-test p-value is listed as less than 0.001.
Right Panel: Titled Average Coalition Size — California. The Y-axis is labeled Average Coalition size per Bill and ranges from 0 to 30 plus. The X-axis is labeled Group Type. A light gray bar for Non-R M I G shows a value of approximately 29. A dark gray bar for R M I G shows a value of approximately 32. A horizontal line with three asterisks connects the tops of the bars. A Wilcoxon p-value is listed as less than 0.001.
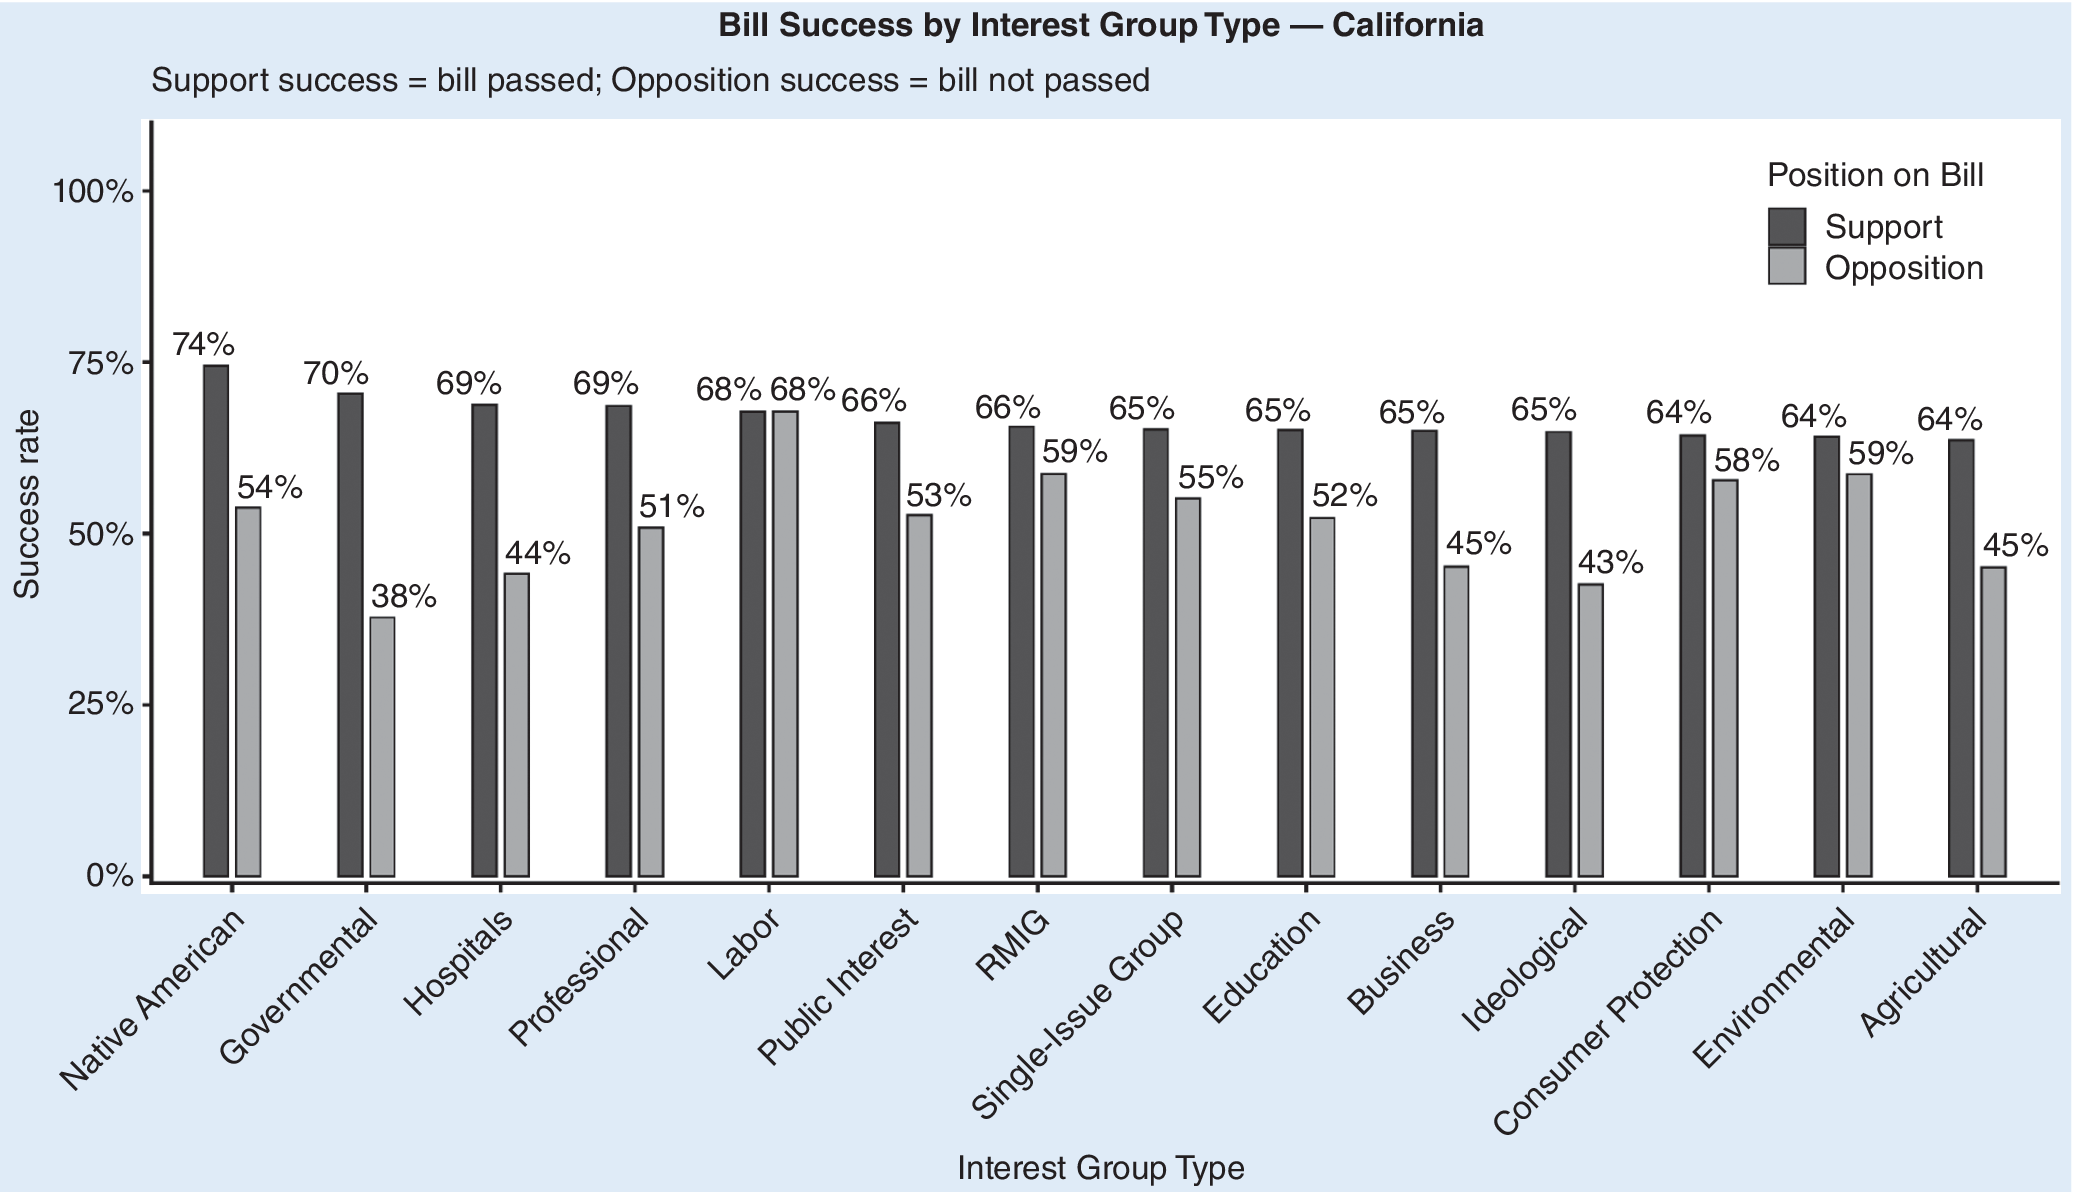
If RMIGs tend to be on larger and more diverse coalitions, does this offer them any higher chances of success? I computed success rates for each interest-group type by calculating the instances in which the bills they supported passed and the bills that they opposed did not. Using this metric, RMIGs competed on a par with other interest groups on the support side and seemed to outperform many traditional groups on the opposition side. RMIG-supported bills passed approximately 66% of the time, which is similar to business-supported success rates. On opposition, RMIGs “won” approximately 59% of the time (figure 6). Descriptively, RMIGs did not seem to be peripheral in legislative outcomes; rather, they apparently matched other interest groups—conceivably with more resources—and did well at blocking unfavorable bills.
Bill Success by Group Type, California, 1997–2018

Figure 6 Long description
The Y-axis represents Success rate from 0 percent to 100 percent in increments of 25. The X-axis lists Interest Group Type. A legend indicates dark gray bars for Support and light gray bars for Opposition.
Data points from left to right include:
* Native American: Support 74 percent, Opposition 54 percent.
* Governmental: Support 70 percent, Opposition 38 percent.
* Hospitals: Support 69 percent, Opposition 44 percent.
* Professional: Support 69 percent, Opposition 51 percent.
* Labor: Support 68 percent, Opposition 68 percent.
* Public Interest: Support 66 percent, Opposition 53 percent.
* R M I G: Support 66 percent, Opposition 59 percent.
* Single-Issue Group: Support 65 percent, Opposition 55 percent.
* Education: Support 65 percent, Opposition 52 percent.
* Business: Support 65 percent, Opposition 45 percent.
* Ideological: Support 65 percent, Opposition 43 percent.
* Consumer Protection: Support 64 percent, Opposition 58 percent.
* Environmental: Support 64 percent, Opposition 59 percent.
* Agricultural: Support 64 percent, Opposition 45 percent.
Support success is defined as the bill passing, while opposition success is defined as the bill not passing.
The descriptive data indicated that the participation of RMIGs has increased over time in California and that they appear to join coalitions differently. The percentage of California bills with any RMIG support increased over time (see figure 4). RMIGs also appeared in large and more-diverse coalitions compared to non-RMIGs. At the most basic level, RMIGs also apparently achieved legislative success relative to many well-resourced groups. These findings provide descriptive credence to the theory that RMIGs are not excluded from the lobbying process and that they function differently than traditional interest groups.
FINDINGS
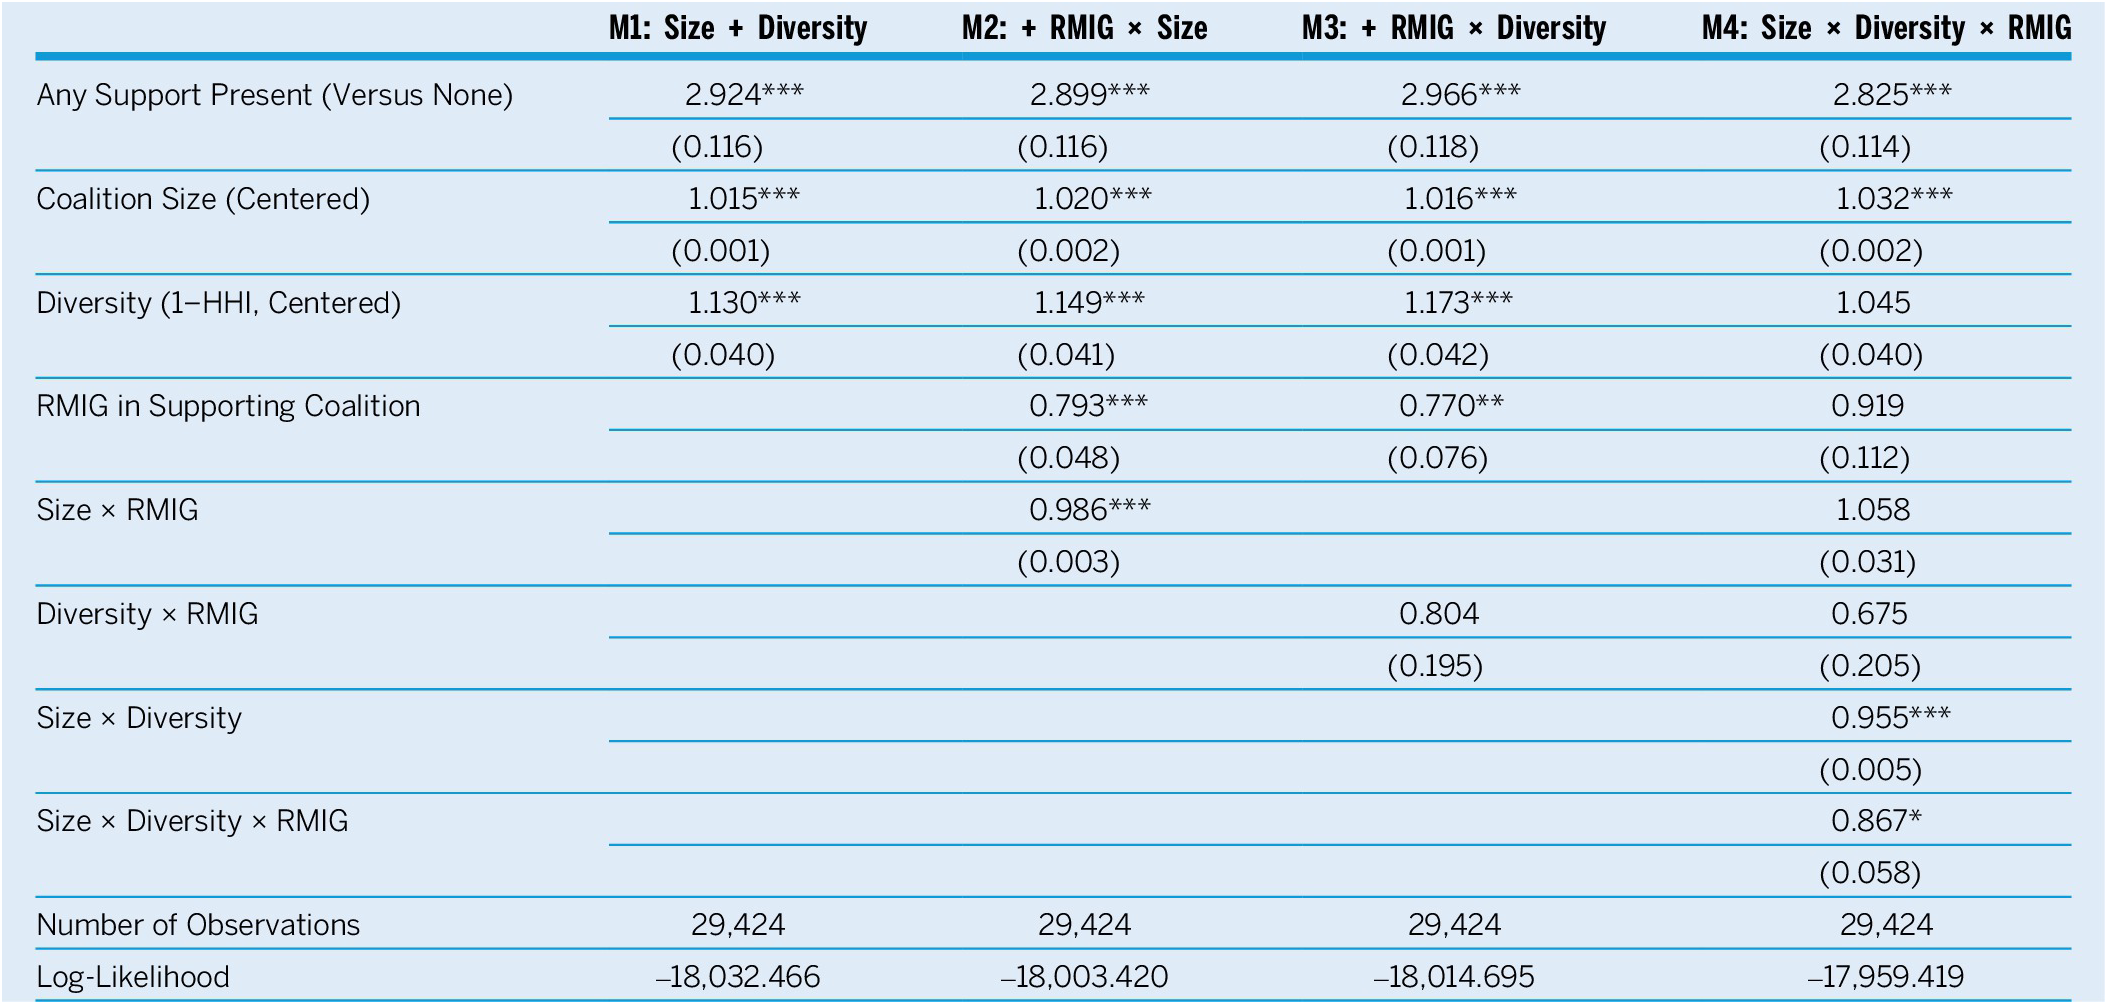
The full-sample models provide initial evidence that large and diverse coalitions were associated with more policy success. In support of hypothesis H2, bills with a large support coalition were more likely to pass through the legislature (from both lower and upper chambers) and reach the governor’s desk. Considering the opposing coalition, bills with many organizations supporting them pass at higher rates than those with smaller support coalitions. Table 2 shows the logit results of four logistic-regression models across different specifications for bill passage out of the legislature before conditioning on coalition coordination. Both coalition size and diversity had consistently positive and highly significant coefficients across all four models. In the first column in table 2 (model 1), the coefficients on coalition size and diversity can be interpreted as the change in the log-odds of passage for a one-unit increase in each measure relative to its average value. The coefficients on both variables are statistically significant and indicate that bills with above-average coalition size and diversity were more likely to pass. Because the variables are mean-centered, the model assessed whether departures from the typical coalition led to increased bill passage. These effects remain strong and statistically significant across all four model specifications. Each additional supporter above the average increased passage odds by 1% to 3%. Holding other factors equal, a one-unit increase in the diversity score improved the odds by approximately 20% to 25%.
Logit Models of Bill Passage (Odds Ratio), Full Sample

Table 2 Long description
The table presents odds ratios for four logit models (M 1 through M 4). Standard errors are provided in parentheses below each odds ratio.
* M 1: Size plus Diversity. Any Support Present: 2.924 (0.116). Coalition Size (Centered): 1.015 (0.001). Diversity (1 minus H H I, Centered): 1.130 (0.040).
* M 2: plus R M I G times Size. Any Support Present: 2.899 (0.116). Coalition Size: 1.020 (0.002). Diversity: 1.149 (0.041). R M I G in Supporting Coalition: 0.793 (0.048). Size times R M I G: 0.986 (0.003).
* M 3: plus R M I G times Diversity. Any Support Present: 2.966 (0.118). Coalition Size: 1.016 (0.001). Diversity: 1.173 (0.042). R M I G in Supporting Coalition: 0.770 (0.076). Diversity times R M I G: 0.804 (0.195).
* M 4: Size times Diversity times R M I G. Any Support Present: 2.825 (0.114). Coalition Size: 1.032 (0.002). Diversity: 1.045 (0.040). R M I G in Supporting Coalition: 0.919 (0.112). Size times R M I G: 1.058 (0.031). Diversity times R M I G: 0.675 (0.205). Size times Diversity: 0.955 (0.005). Size times Diversity times R M I G: 0.867 (0.058).
Summary statistics for all models: Number of Observations is 29,424. Log-Likelihood values range from minus 18,032.466 in M 1 to minus 17,959.419 in M 4. Significance levels are indicated by asterisks: one for p less than 0.05, two for p less than 0.01, and three for p less than 0.001.
Notes: Year/topic/party/legislator-race controls included but not shown. *p<0.05, **p<0.01, ***p<0.001.
The interaction term between size and diversity was negative, suggesting that positive effects of coalition size and diversity were not strictly additive. Whereas bills with both larger and more-diverse coalitions tended to perform better, the combination of very large and highly diverse (i.e., more than average) coalitions appears to have yielded diminishing returns. Increasing the size of and diversifying the coalition both improve prospects of success on its own; however, when pursued simultaneously, they may not be as effective.
COALITION SIZE AND DIVERSITY HELP RMIGS ONLY UNDER CONDITIONS OF PRIOR COORDINATION
Evidence for hypothesis H2 is more nuanced when considering RMIGs. It predicted that RMIGs would be more influential when they were part of large, diverse coalitions. However, the results complicate this expectation. RMIG interactions in models 2–4 show that RMIGs do not, on average, experience higher odds of passage when supporting a bill compared to other groups. In fact, their presence seems to be associated with slightly lower odds of passage. The interaction between RMIG presence and coalition size was negative in model 2, indicating that simply adding RMIGs to larger coalitions did not increase the likelihood of bill success. Model 4 shows that the three-way interaction among coalition size, diversity, and RMIG presence was negative and statistically significant. It implies that the benefits of large and diverse coalitions are not always beneficial for RMIGs. When a coalition is both large and diverse, the marginal payoff of increasing size is even less on RMIG bills than non-RMIG bills. RMIGs do not lose from large and diverse coalitions; they only seem to gain less from additional groups when they already have high diversity in their coalitions. Larger and more-heterogeneous coalitions both tend to improve legislative prospects on their own; however, coalitions with high levels of both features experience diminishing returns. This effect also is true when RMIGs are present. The costs and challenges of maintaining multiple types of groups may be more difficult for racial minority groups. Altogether, the full-sample results generally support hypothesis H2 in that size and diversity are independently valuable. However, they also qualify it by demonstrating that these advantages attenuate when pursued simultaneously and when RMIGs are involved.
Figure 7 illustrates these nuanced findings that have implications for RMIG coalitions. RMIG-supported bills apparently fared better when the coalition was more diverse. The negative interaction between size and RMIG presence suggests that RMIGs did not benefit from simply expanding coalition membership. The predicted probability of passage decreases with increasing coalition size as diversity increases. When RMIGs were present, coalition size conditioned the effect of diversity. The pattern implies that small RMIG coalitions were substantially less likely to succeed at low diversity but experienced steep gains as diversity increased. Large RMIG coalitions, in comparison, gained less from more diversity.
Predicted Probability of Bill Passage Across Coalition Diversity and Size for Coalitions with RMIGs Versus Non-RMIGs, Full Sample

Figure 7 Long description
A two-panel line graph with a shared Y-axis labeled Predicted probability of passage from 0.40 to 1.00 and a shared X-axis labeled Coalition diversity (1 minus H H I, centered; higher = more diverse) ranging from -0.50 to 0.25.
Left Panel: R M I G absent.
- Small coalition size (solid line): Shows a slight linear increase from 0.60 to 0.70 as diversity increases.
- Medium coalition size (dashed line): Remains relatively flat, hovering around 0.70.
- Large coalition size (dotted line): Shows a slight linear decrease from 0.80 to 0.75.
- All three lines converge toward 0.70 at high diversity levels with narrow 95% C L shaded regions.
Right Panel: R M I G present.
- Small coalition size (solid line): Shows a steep linear increase from 0.40 to 0.65. The shaded confidence interval is wide at low diversity and narrows at high diversity.
- Medium coalition size (dashed line): Shows a very slight downward trend, staying near 0.65.
- Large coalition size (dotted line): Shows a significant downward curve from 0.95 at low diversity to 0.65 at high diversity. The shaded confidence interval is very broad at low diversity.
- All three lines converge at approximately 0.65 when coalition diversity is highest.
A legend at the bottom identifies Coalition size: Small (~10th) as a solid line, Medium (~50th) as a dashed line, and Large (~90th) as a dotted line.
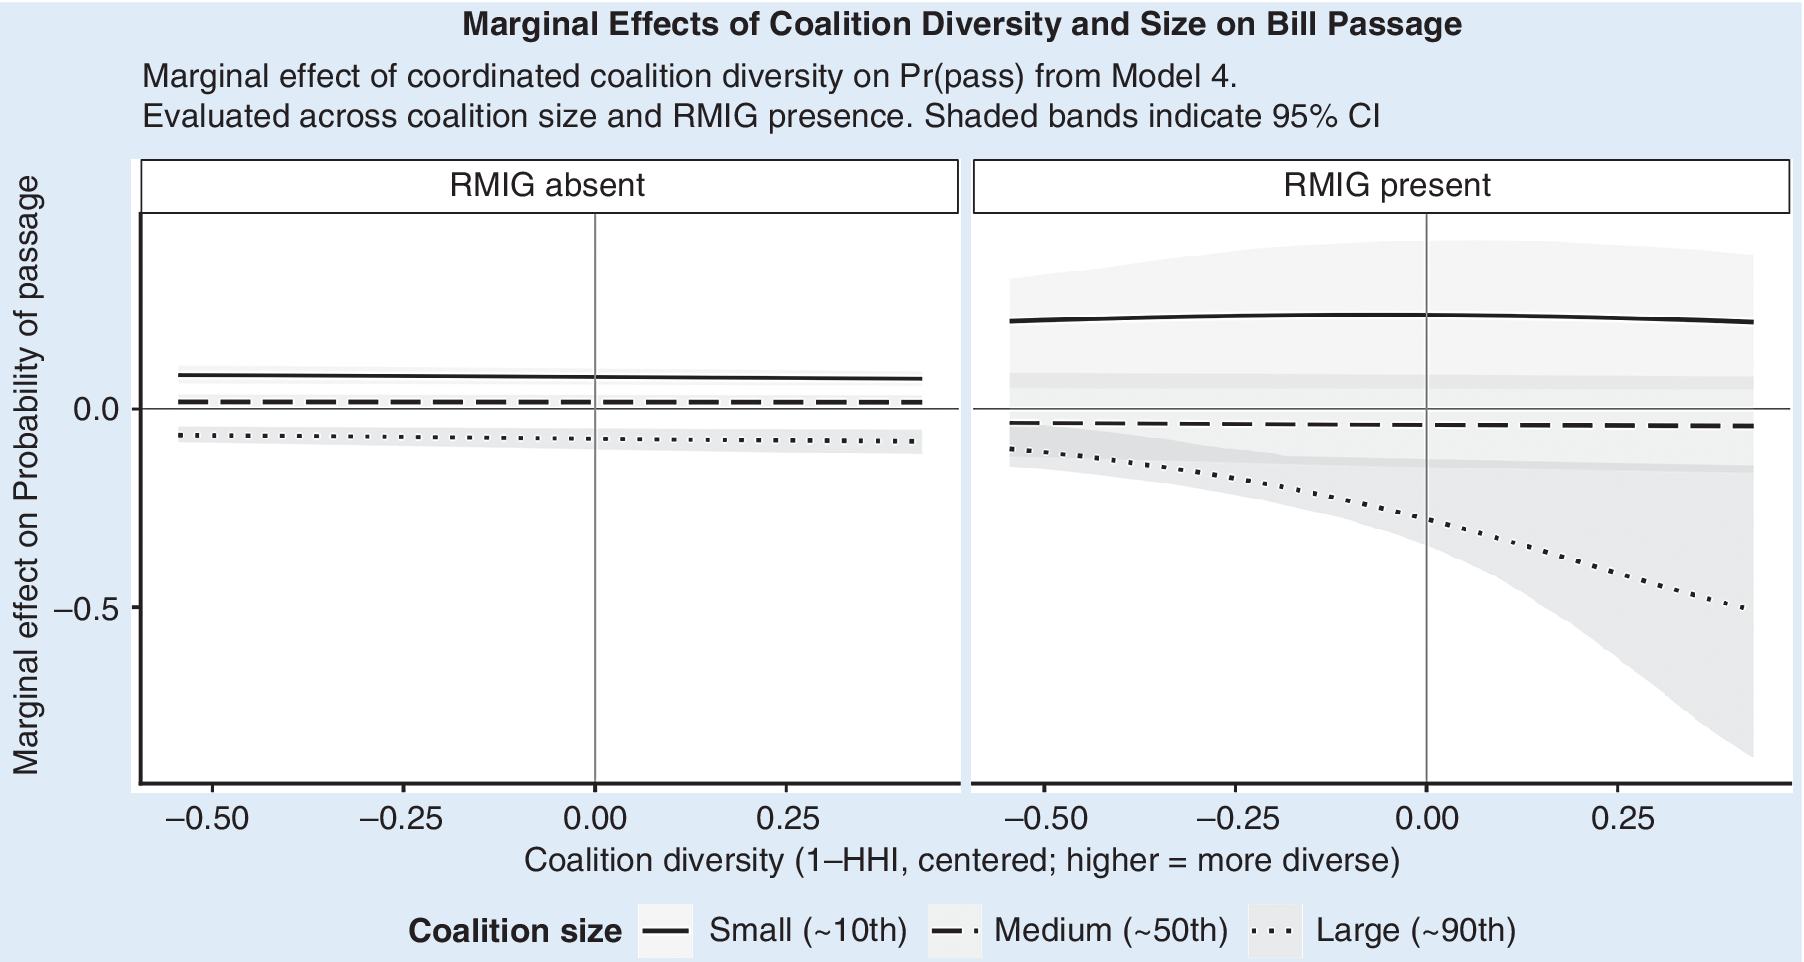
When the marginal effects of coalitional diversity and size on bill passage were plotted to further interpret the three-way interaction, increasing diversity had little substantive impact at any coalition size for non-RMIGs. The estimated marginal effects hovered near zero and the confidence interval crossed zero (figure 8). The pattern was different when RMIGs were present. Diversity was beneficial only within small coalitions, in which the marginal effect was positive and statistically distinguishable from zero. The effect of diversity attenuated, became negative, and was imprecisely estimated in large RMIG coalitions.
Marginal Effects of Coalitional Diversity and Size on Bill Passage

Figure 8 Long description
The graph consists of two side-by-side panels. The Y-axis represents the Marginal effect on Probability of passage, ranging from -0.5 to 0.0. The X-axis represents Coalition diversity (1 minus H H I, centered), ranging from -0.50 to 0.25.
Left Panel (R M I G absent):
Three horizontal lines show near-zero marginal effects regardless of diversity.
- Small coalition size (solid line) is slightly above 0.0.
- Medium coalition size (dashed line) sits exactly at 0.0.
- Large coalition size (dotted line) is slightly below 0.0.
Shaded 95% C I bands are narrow and overlap the 0.0 baseline.
Right Panel (R M I G present):
- Small coalition size (solid line) remains positive and flat above 0.0.
- Medium coalition size (dashed line) is flat and slightly below 0.0.
- Large coalition size (dotted line) shows a significant downward trend. It starts near 0.0 at -0.50 diversity and drops to -0.5 at 0.25 diversity. The shaded C I band for the large coalition widens significantly as diversity increases, indicating higher uncertainty.
To check the three-way interaction, I used the procedures recommended by Hainmueller, Mummolo, and Xu (Reference Hainmueller, Mummolo and Xu2019). Binning estimators reveal that the marginal effect of coalition size declined steadily as diversity increased and that this decline was steeper for RMIG than for non-RMIG coalitions. According to their guidance, I estimated and plotted a Generalized Additive Model (GAM) to visualize the relationship between the predictors and the outcome. GAM surface plots revealed a nonlinear interaction structure in which the high-size and high-diversity region showed minimal additional gain for bills with RMIGs in their support coalition (see online appendix G). Binning-support tables demonstrated adequate overlap across diversity ranges, indicating that these estimates were not driven by a lack of observations. Together, these robustness checks corroborated the regression results. In the full sample, large and highly diverse coalitions appear to yield diminishing returns for RMIGs relative to other groups.
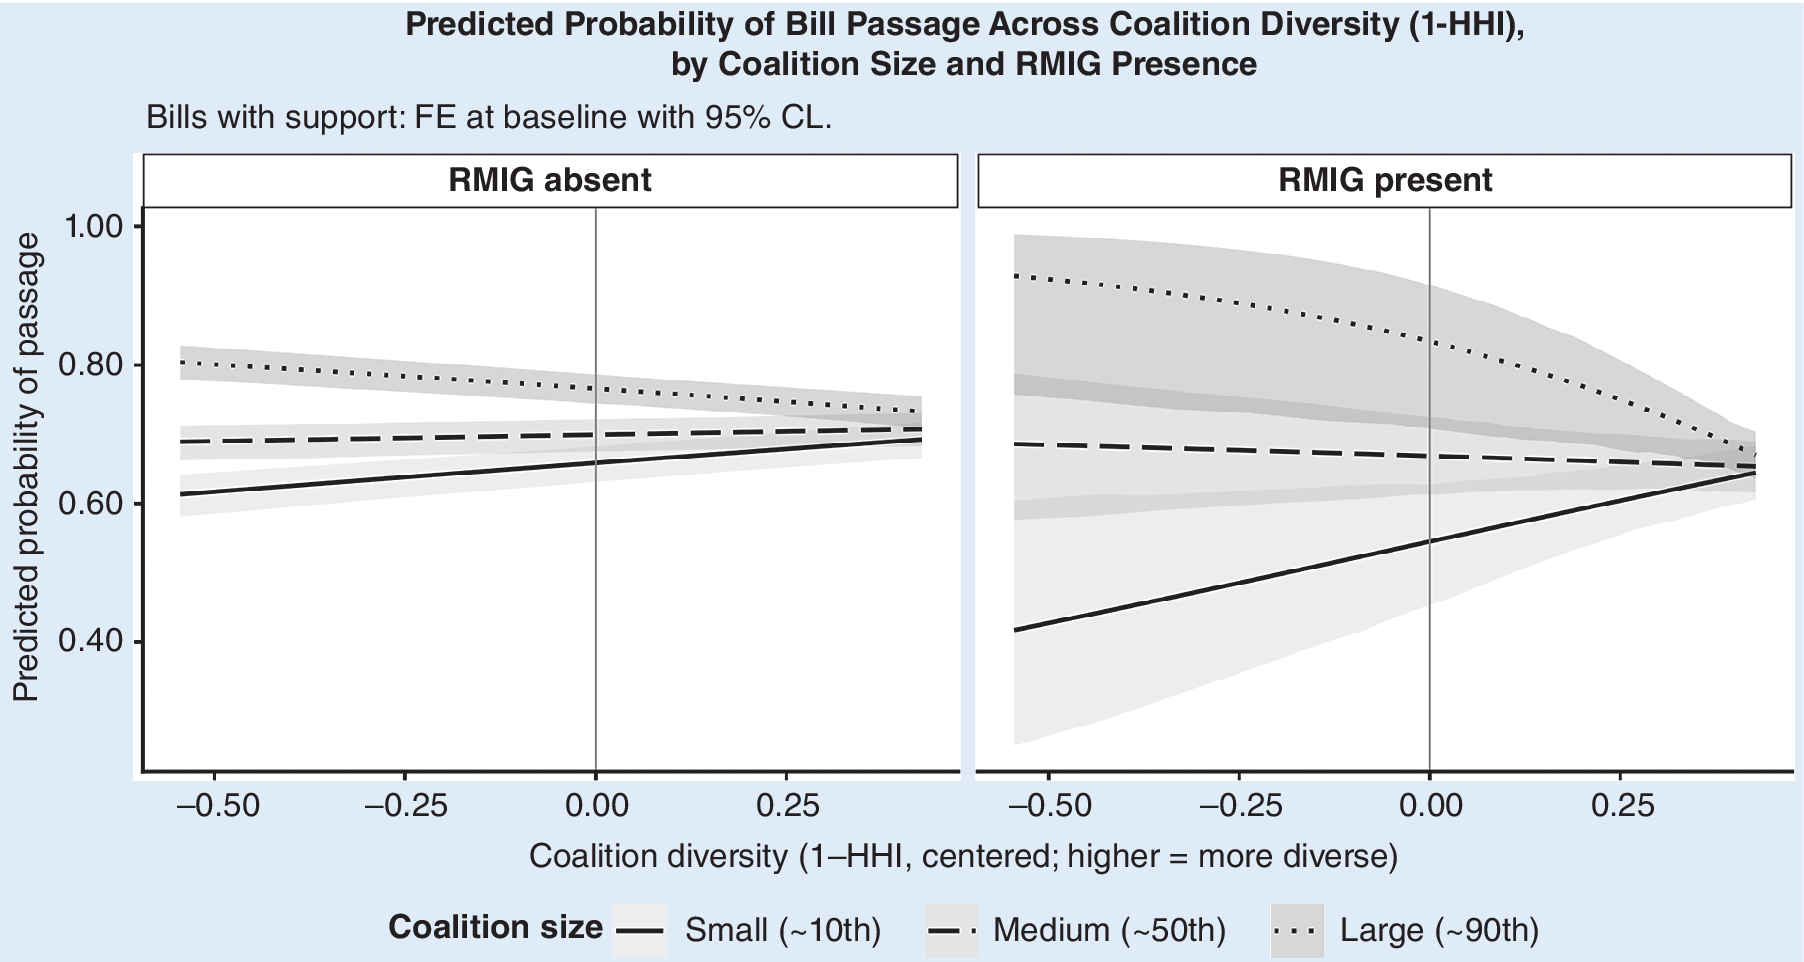
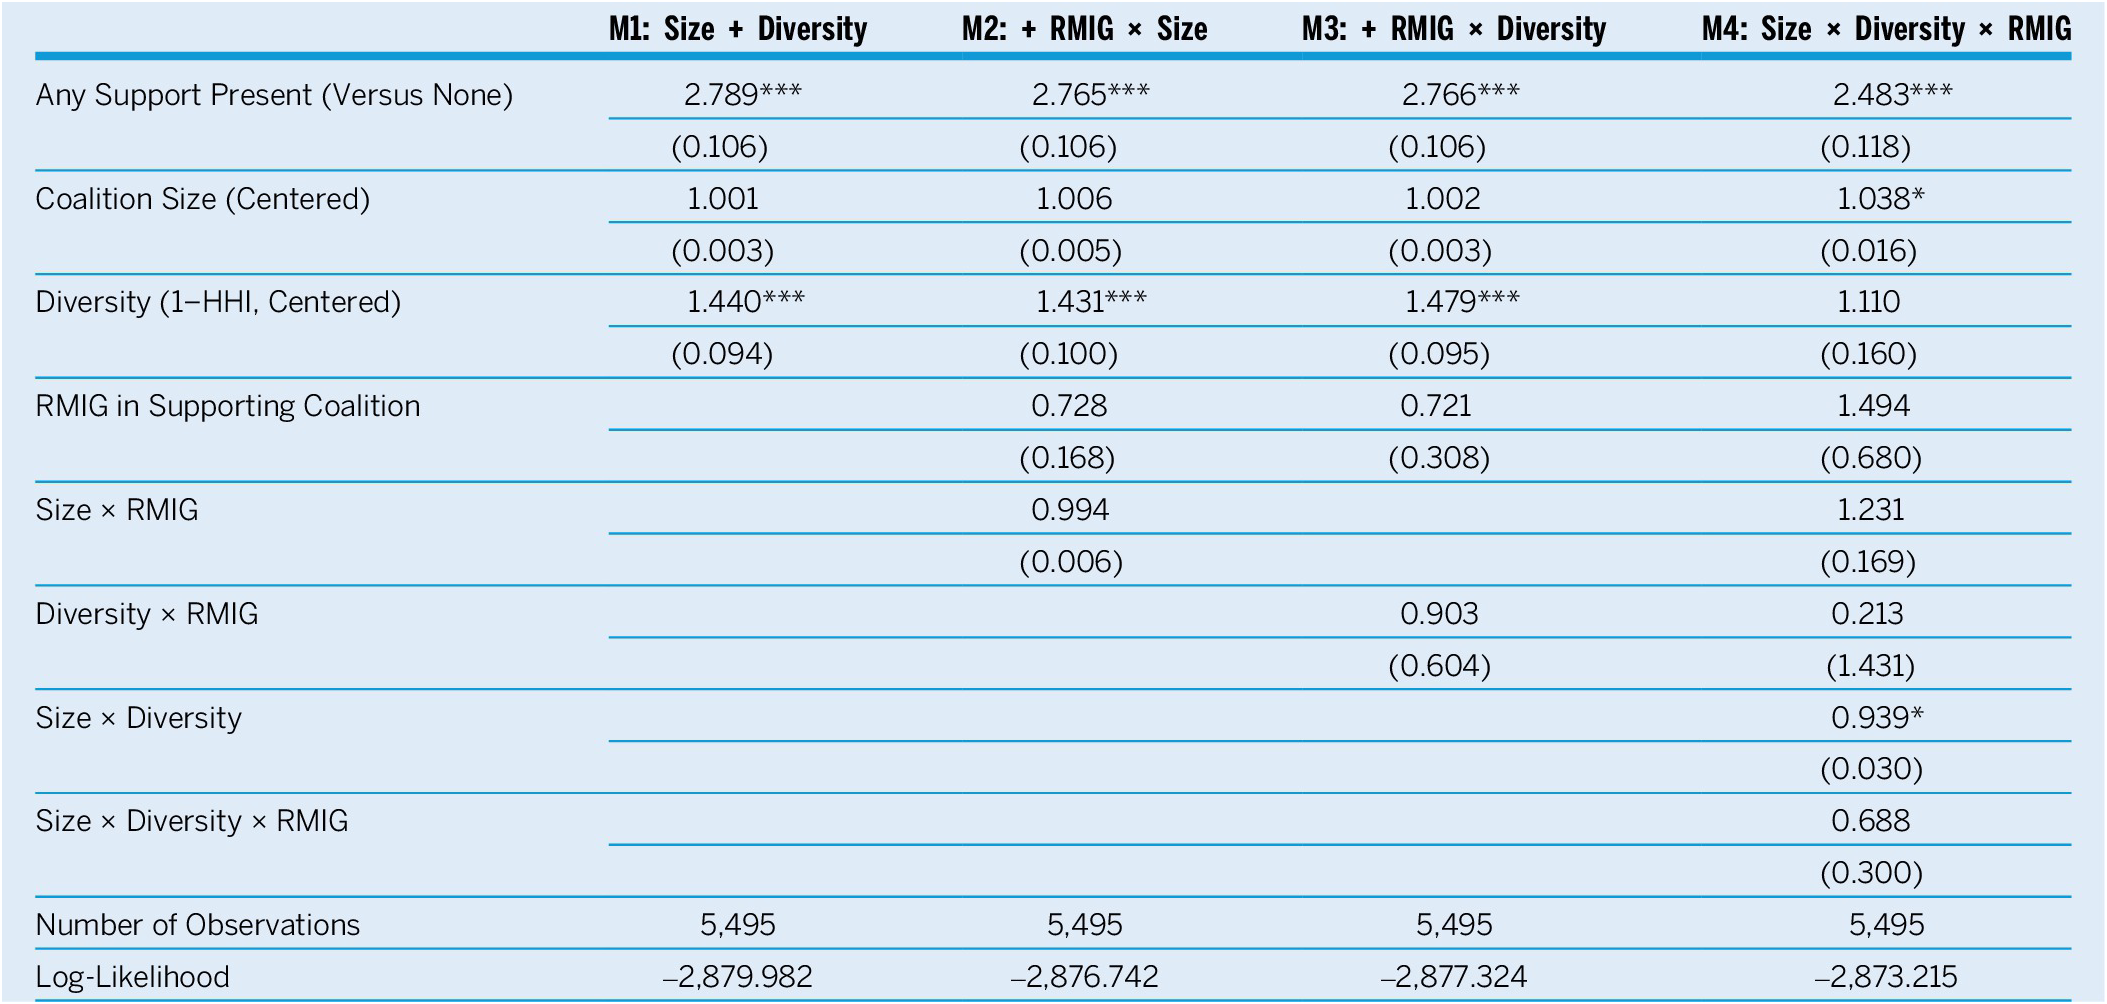
The full-sample model shows a significant penalty for large, diverse coalitions among RMIGs. This changed after the sample was restricted to the top quartile of historically coordinated coalitions. In this sample, the main effect of diversity remained positive. Table 3 presents the re-estimation of the main models for bills whose supporting coalitions were in the top 25% of coordination scores. The restriction functioned as a proxy for more stable and durable coalitions in which interest groups had a history of repeated joint position taking across sessions. These estimates captured the determinants of bill success—conditional on coalition coordination—rather than across the full sample of ad hoc and established coalitions. Among more coordinated, durable coalitions, diversity rather than size apparently drove legislative success, as demonstrated in model 1 through model 3 (see table 3).
Logit Models of Bill Passage (Odds Ratios), High-Coordination Subsample

Table 3 Long description
The table presents odds ratios for four logit models.
Column headers:
* M 1: Size plus Diversity.
* M 2: plus R M I G times Size.
* M 3: plus R M I G times Diversity.
* M 4: Size times Diversity times R M I G.
Row variables and values (odds ratios with standard errors in brackets):
* Any Support Present (Versus None): M 1 is 2.789, M 2 is 2.765, M 3 is 2.766, M 4 is 2.483. All are significant at p less than 0.001.
* Coalition Size (Centered): M 1 is 1.001, M 2 is 1.006, M 3 is 1.002, M 4 is 1.038 (significant at p less than 0.05).
* Diversity (1 minus H H I, Centered): M 1 is 1.440, M 2 is 1.431, M 3 is 1.479 (all significant at p less than 0.001), M 4 is 1.110.
* R M I G in Supporting Coalition: M 2 is 0.728, M 3 is 0.721, M 4 is 1.494.
* Size times R M I G: M 2 is 0.994, M 4 is 1.231.
* Diversity times R M I G: M 3 is 0.903, M 4 is 0.213.
* Size times Diversity: M 4 is 0.939 (significant at p less than 0.05).
* Size times Diversity times R M I G: M 4 is 0.688.
Model Statistics:
* Number of Observations: 5,495 for all models.
* Log-Likelihood: M 1 is -2,879.982, M 2 is -2,876.742, M 3 is -2,877.324, M 4 is -2,873.215.
Notes indicate that year, topic, party, and legislator-race controls are included but not shown.
Notes: Year/topic/party/legislator-race controls included but not shown. *p<0.05, **p<0.01, ***p<0.001.
More important, the effects of RMIG interaction terms largely disappeared, became non-significant, and were lower in magnitude than in the full-sample models. This suggests that after RMIGs were in more coordinated networks, the penalty of being in large and diverse coalitions dissipated. These results imply that the effects of having both larger size and more diversity for RMIG coalitions were strongest when the coalition was more established. Therefore, the negative interactions of size and diversity in the full sample were not inherent to RMIGs but rather conditional on the coordination environment. Robustness checks reveal that 78% of RMIG-supported bills in the high-coordination subsample were concentrated in the top tercile of coalition diversity (see online appendix G). Apparently, RMIGs appear in broad coalitions when those coalitions have a history of repeated alignment. This would explain why the negative Size x Diversity x RMIG interaction dissipates, decreasing to an odds ratio of 0.688 and becoming non-significant. In the full population of bills, large and diverse coalitions were ad hoc aggregations that may have produced informational ambiguity that can be disadvantageous for RMIGs. When attention was restricted to a historically coordinated coalition that more closely resembled the coalitions described by Browning, Marshall, and Tabb (Reference Browning, Marshall and Tabb1986), diversity and size no longer became problematic for RMIGs.
The results provide a starting point for how coalition compositions can influence bill passage in California. They should be interpreted with caution because there are many difficulties associated with modeling bill outcomes. Bill passage is shaped by a wide range of factors, some of which are observable and many that are not. Shifting political priorities, party dynamics, specific bill language, and leadership decisions are difficult to capture fully in statistical models. These issues create risks of omitted-variable bias if important but unmeasured influences correlate with the variables of interests. The models in this study control for the most obvious variables, such as the position of the bill author as a party leader or chair of an important committee (Butler and Miller Reference Butler and Miller2022). Coalition formation is an endogenous process. For example, groups choose to join larger or more diverse coalitions when bills are more difficult to pass or if they are highly controversial. The cause and effect in these situations cannot be determined. For these reasons, I hesitate to claim causality. The results are better read as associations rather than clear causal explanations. At the very least, they provide useful descriptive evidence that larger and more diverse coalitions are linked to bill outcomes and that RMIGs apparently are better at being in these types of coalitions. The precise causal paths remain more tentative.
CONCLUSION
This study found that larger and more diverse lobbying coalitions generally are associated with greater policy success and that RMIGs tend to be in these types of coalitions. Cautiously, the findings reveal interesting patterns for RMIG lobbying. They refine the theoretical expectations in two ways. First, RMIGs often are in both large and diverse coalitions. Although on their own, these characteristics may provide benefits to bill passage, they are not a unique advantage for only RMIGs. In fact, there is a penalty for RMIGs when they attempt to do both at the same time. Second, the effects of size and diversity are conditioned by either coalition coordination or whether the coalition previously was on the same side of the issue. In alignment with previous research, opportunistic and temporary coalitions are weaker than more coordinated coalitions (Browning, Marshall, and Tabb Reference Browning, Marshall and Tabb1986; Dwidar Reference Dwidar2025; Ture and Hamilton Reference Ture and Hamilton1992). The RMIG disadvantage of being in large and diverse coalitions disappears when they are embedded in more coordinated networks.
This study found that larger and more diverse lobbying coalitions generally are associated with greater policy success and that RMIGs tend to be in these types of coalitions.
These findings suggest that RMIG coalitions face a tradeoff. In low-coordination situations, attempts to simultaneously expand coalition size and diversity are penalized, even as these dimensions independently improve legislative prospects for non-RMIG groups. RMIGs are better served by focusing on either mobilizing many groups (i.e., size) or different types of groups (i.e., diversity) but not at the same time. Only after RMIG coalitions become embedded in durable coordination networks do the benefits of large, diverse coalitions begin to emerge. This study’s models demonstrate that any magnified effects of both large and diverse coalitions are legible to legislators only when they reflect higher organizational coordination among groups with histories of cooperation. When descriptive rates of success are examined, RMIGs are particularly adept at defeating bills they oppose. RMIGs achieve success rates almost similar to traditional, non-RMIG groups when they support legislation. These findings highlight the central role of RMIGs in representing historically marginalized communities, suggesting that RMIGs can use coalition building in the lobbying process with a more strategic outlook, such as focusing on smaller, more diverse coalitions and building on prior collaborations.
RMIGs are better served by focusing on either mobilizing many groups (i.e., size) or different types of groups (i.e., diversity) but not at the same time. Only after RMIG coalitions become embedded in durable coordination networks do the benefits of large, diverse coalitions begin to emerge.
The case of policing-reform efforts in the 2019–2020 legislative session in California illustrates these dynamics. Assembly member Steven Bradford’s SB 731 was defeated despite being backed by 66 organizations across six types.Footnote 1 Shirley Weber’s AB 392 passed and had support from more than 200 organizations across eight interest-group types that included clergy, RMIGs, advocacy organizations, unions, and business groups.Footnote 2 Both bills sought to introduced strong reforms to control the use of force by the police. Each bill faced intense opposition from well-resourced police unions. Only Weber’s bill with the larger and more diverse coalition prevailed. At first glance, this comparison appears to contradict the full-sample models that suggest very large and very diverse RMIG coalitions experience lower odds of bill success. The second-stage results point to a potential answer: the effectiveness of large and diverse coalitions depends on the level of prior coordination among coalition groups.
Weber’s AB 392 coalition appears to have drawn on more coordinated and durable relationships than Bradford’s SB 731 coalition. For example, in both examples, the RMIG Asian Americans Advancing Justice (AAAJ) was in the support coalition with unions. The labor union American Federation of State, County, and Municipal Employees (AFSCME) supported Bradford’s SB 731, and the Service Employees International Union (SEIU) supported Weber’s AB 392. By examining the co-signaling pattern of AAAJ and these unions in the data, I found that the SEIU aligned with AAAJ 27 times in past lobbying compared to only 13 times with AFSCME. This evidence suggests that the AB 392 coalition was embedded in a more stable and durable network of cooperation. Although it is based on descriptive counts, the case of these two bills contextualizes the findings of this study. Large, diverse coalitions can be effective when built from partners with a history of working together. Without such coordination, size and diversity may signal only fragmented interests to legislators. Size and diversity can amplify influence and tune the signals to legislators.
Taken together with the quantitative finding, this illustration suggests that the influence of RMIGs is contingent on coalition structure, particularly in the quality of coordination. Their limited financial and political resources mean that they cannot compete with traditional interests that have money and access; however, they can leverage strength in numbers and organizational diversity to signal legitimacy and break through legislators’ fog of uncertainty. Coalition building does not guarantee success but it remains a central strategy for marginalized interests and communities of color.
Beyond this initial application, this study also demonstrates that my dataset presents a wide array of future research possibilities. Although this analysis is limited to a single state, it highlights the potential of state-level lobbying data to enhance our understanding of racial representation in the policy-making process. The findings should be interpreted within this scope, but they also serve as proof of concept and a call for the systematic collection of similar data in other states.
SUPPLEMENTARY MATERIAL
To view supplementary material for this article, please visit http://doi.org/10.1017/S104909652610208X.
ACKNOWLEDGMENTS
I thank Marisa Abrjano, LaGina Gause, and Thad Kousser for their mentorship and support, as well as all of the undergraduate student research assistants who worked with me to prepare these data, principally Jack Trent-Dorfman, Joan Yan, and Brett Guinan at the University of California, San Diego, and Sami Olsen, Catherine Wallace, and Sammi Bray at Trinity College.
DATA AVAILABILITY STATEMENT
Research documentation and data that support the findings of this study are openly available at the PS: Political Science & Politics Harvard Dataverse at https://doi.org/10.7910/DVN/8PHDYQ.
CONFLICTS OF INTEREST
The author declares that there are no ethical issues or conflicts of interest in this research.


 Open access