


Introduction
Biodiversity and trophic structure of marine ecosystems are controlled by bottom-up, top-down or middle-out (wasp-waist) mechanisms (Hunt and McKinnell, Reference Hunt and McKinnell2006). These forces influence the abundance and biomass (quantitative) of marine species as well as the community composition (qualitative; Menge, Reference Menge1992). Bottom-up controls prevail in ecosystems with nutrient/plankton resource limitations, whereas predation represents the top-down mechanisms (Hunt and McKinnell, Reference Hunt and McKinnell2006). The third mechanism, the middle-out or wasp-waist control, can be found in ecosystems where intermediate trophic levels are dominated by a few species only, with numerous species at the bottom and the top of the trophic pyramid; such a kind of control often occurs in upwelling systems (Rice, Reference Rice and Beamish1995; Cury, Reference Cury2000; Bakun, Reference Bakun2006). Bakun (Reference Bakun2006) described these intermediate trophic levels that exert middle-out controls in an ecosystem as species with short life cycles, which have a predominance in biomass; often, they are the lowest mobile trophic level able to relocate and heavily rely on juvenile stages of their predators as prey. Examples are the Gulf Stream region off the eastern US, dominated by the Atlantic menhaden Brevoortia tyrannus or the Falkland Current east of South America responsible for the high productivity of the Patagonian Shelf, where a known key intermediate species is Patagonotothen ramsayi (Bakun, Reference Bakun2006; Diaz et al., Reference Diaz, Pájaro, Olivar, Martos and Macchi2011; Laptikhovsky et al., Reference Laptikhovsky, Arkhipkin and Brickle2013).
The Patagonian Shelf Large Marine Ecosystem (LME) is located in the Southwest Atlantic Ocean. It is one of the widest (~800 km) and largest (1.2 million km2) continental shelves in the world. The Falkland Shelf ecosystem is a part of the Patagonian Shelf LME and is characterized by tidal mixing and western boundary current fronts (Belkin et al., Reference Belkin, Cornillon and Sherman2009). It features high productivity due to upwelling of the cold Falkland Current originating in the Southern Ocean (Vivier and Provost, Reference Vivier and Provost1999; Agnew, Reference Agnew2002; Belkin et al., Reference Belkin, Cornillon and Sherman2009; Matano et al., Reference Matano, Palma and Piola2010; Gil et al., Reference Gil, Giarratano, Barros, Bortolus, Codignotto, Schenke, Eva Góngora, Lovrich, Monti, Pascual, Rivas and Tagliorette2018; van der Grient et al., Reference van der Grient, Morley, Arkhipkin, Bates, Baylis, Brewin, Harte, White and Brickle2023). As with many other upwelling ecosystems, the Falkland Shelf is considered to have a wasp-waist structure with only a few species in intermediate trophic positions (e.g. P. ramsayi, Illex argentinus, Micromesistius australis, Doryteuthis gahi), linking many species in low trophic levels with many top predators (Cury, Reference Cury2000; Padovani et al., Reference Padovani, Viñas, Sánchez and Mianzan2012; Laptikhovsky et al., Reference Laptikhovsky, Arkhipkin and Brickle2013).
Therefore, the Falkland Shelf is a unique ecosystem, also given its high biomass of higher trophic-level animals, which also attract numerous fisheries. A high number of predatory species migrate from their spawning grounds in Argentine waters towards the waters around the Falkland Islands (Arkhipkin et al., Reference Arkhipkin, Brickle, Laptikhovsky and Winter2012; van der Grient et al., Reference van der Grient, Morley, Arkhipkin, Bates, Baylis, Brewin, Harte, White and Brickle2023) to feed upon mid-level resident species that are highly abundant e.g. P. ramsayi and D. (formerly Loligo) gahi. Four main fisheries operate within the Falkland Islands Conservation Zones, which represent the Falkland Islands Exclusive Economic Zone. First, Spanish/Falkland flagged trawlers extracting (1) migratory finfish such as Patagonian hake (Merluccius hubbsi), kingclip (Genypterus blacodes), hoki (Marcruronus magellanicus) and, targeted in previous years but now being a major bycatch species, blue whiting (M. australis); and (2) D. gahi, operating within the so-called ‘Loligo Box’. Then, there is a high number of Taiwanese and Korean jigging vessels targeting (3) Argentine shortfin squid I. argentinus and the longline fisheries (consisting now of one vessel only), targeting bathyal (4) toothfish (Dissostichus eleginoides) on the shelf edge and in waters deeper than 400 m (Falkland Islands Fisheries Department (FIFD), 2021). Although these are the main characteristics, targeted species and licences utilized may change depending on seasonal conditions; e.g. trawlers targeting I. argentinus. The fishery within the Falkland Islands Conservation Zone (FICZ) is managed by the Falkland Island Government Fisheries Department (FIFD) and is based on effort limitation, which can be achieved by granting licences and fishing days to companies and their fishing vessels (Barton, Reference Barton2002).
Loliginid squids are often considered key species in marine ecosystems, linking bottom to top levels of the ecosystem (Gasalla et al., Reference Gasalla, Rodrigues and Postuma2010; Arkhipkin, Reference Arkhipkin2013). The loliginid squid D. gahi is of high economic value to the Falkland Islands. It feeds mainly on planktonic crustaceans such as Euphausiacea, Chaetognatha, Amphipoda and juvenile lobster krill Munida gregaria, with larger squids feeding more on fish and other squids including cannibalism (Brickle et al., Reference Brickle, Olson, Littlewood, Bishop and Arkhipkin2001; Rosas-Luis et al., Reference Rosas-Luis, Sánchez, Portela and Del Rio2014; Büring et al., Reference Büring, Schroeder, Jones, Pierce, Rocha and Arkhipkin2022). D. gahi is also an important prey for predatory fishes such as M. hubbsi and G. blacodes, sharks and skates, penguins, flying seabirds, pinnipeds and cetaceans. Therefore, D. gahi could be considered an important intermediate species to transfer energy from lower trophic levels to top predators, thus being a wasp-waist species in the Falkland Islands marine environment. The population structure of D. gahi in Falkland Islands waters consists of two main annual cohorts characterized by different seasons of spawning – the autumn-spawning cohort (ASC) and the spring-spawning cohort (SSC) (Patterson, Reference Patterson1988; Hatfield et al., Reference Hatfield, Rodhouse and Porebski1990). Hence, the same ontogenetic phases of squids from each cohort occur during different seasons and in distinct habitats, experiencing varying environmental conditions (Hatfield et al., Reference Hatfield, Rodhouse and Porebski1990; Arkhipkin et al., Reference Arkhipkin, Grzebielec, Sirota, Remeslo, Polishchuk and Middleton2004; Jones et al., Reference Jones, Arkhipkin, Marriott and Pierce2018). Consequently, several studies found the trophic ecology to differ between the two cohorts of squids (Arkhipkin et al., Reference Arkhipkin, Hatfield, Rodhouse, Rosa, O'Dor and Pierce2013; Büring et al., Reference Büring, Schroeder, Jones, Pierce, Rocha and Arkhipkin2022; Jones et al., Reference Jones, Bustamante, Guillou and Arkhipkin2023).
Understanding the trophic relationships within an ecosystem is a crucial component of ecosystem-based fisheries management. There are at least two ways to determine the structure of the food web. One of them is the stable isotope analysis of samples from animals. The ratio of the heavier 13C to the lighter 12C stable isotopes, expressed as δ13C, can be used to identify carbon pathways and discriminate among alternative food chains on which consumers depend for supporting their energy demand (Post, Reference Post2002; McCutchan et al., Reference McCutchan, Lewis, Kendall and McGrath2003). The ratio of 14N to 15N, expressed as δ15N, increases with trophic levels due to accumulation of the heavier isotope and can therefore inform on a species' position within the food web (Minagawa and Wada, Reference Minagawa and Wada1984; Post, Reference Post2002). In addition, analysis of both carbon and nitrogen stable isotopes can reveal the ecotrophic niche of a species, which refers to its position in the food web and the resources it utilizes (Bearhop et al., Reference Bearhop, Adams, Waldron, Fuller and Macleod2004). Modelling feeding interactions between trophic groups represents another way to estimate the structure and evaluate energy circulation in ecosystems. Such a goal requires mapping out trophic relationships between ecosystem components, a task traditionally achieved using results of stomach content analysis. Since the 1980s, researchers have been developing Ecopath, a software tool that helps to assemble and model a ‘mass balanced snapshot’ of energy or matter circulation in ecosystems (Polovina, Reference Polovina1984; Christensen & Pauly, Reference Christensen and Pauly1992; Pauly et al., Reference Pauly, Christensen and Walters2000). Ecopath enables estimating trophic levels and the functional importance of species and trophic groups by considering, for instance, the direct and indirect effects they exert on other ecosystem components in the energy circulation network (Christensen et al., Reference Christensen, Walters, Pauly and Forrest2008).
Limited work has been dedicated to model the trophic structure of the Falkland Islands marine ecosystem, and is mostly represented by seabird stable isotope studies (Weiss et al., Reference Weiss, Furness, McGill, Strange, Masello and Quillfeldt2009; Quillfeldt et al., Reference Quillfeldt, Ekschmitt, Brickle, Mcgill, Wolters, Dehnhard and Masello2015) and a preliminary mass-balanced model of the Falkland Islands Conservation Zones informed by a ‘Newfoundland’ model (Heymans and Pitcher, Reference Heymans and Pitcher2002; Cheung and Pitcher, Reference Cheung and Pitcher2005). Both approaches included D. gahi as one of the species studied. However, the ecosystem has since undergone significant changes (Laptikhovsky et al., Reference Laptikhovsky, Arkhipkin and Brickle2013) and a comparison between the trophic levels of D. gahi and other species by both approaches using data of a similar time period is lacking. To have updated data of the ecosystem (biomass, catches, update of functional groups) and stable isotope data from the same period for a comparison is therefore crucial. Further, it is timely to update the Falkland model to reflect improved understanding of the important components (functional groups) with regards to biomass pools. For example, the Cheung and Pitcher model include the multi-stanza group of snoek, Martialia hyadesi and basking sharks as functional groups, which are not common species in the food web. In addition, this new model focuses on the shelf area alone, thereby also including the crucial coastal kelp component, while the Cheung and Pitcher model included off-shelf areas too, thereby allowing for the inclusion of, for example, adult toothfish, which do not occur on the shelf.
While squid abundances in the northern hemisphere have increased or are predicted to increase, this may not occur in the southern hemisphere (Pecl and Jackson, Reference Pecl and Jackson2008; Kooij et al., Reference Kooij, Engelhard and Righton2016; Guerreiro et al., Reference Guerreiro, Borges, Santos, Xavier, Hoving and Rosa2023). Therefore, the squid importance within southern-hemisphere ecosystems needs to be evaluated and especially for the Falkland Islands whose economy depends on squid fisheries catches, so to inform future fisheries management (Doubleday et al., Reference Doubleday, Prowse, Arkhipkin, Pierce, Semmens, Steer, Leporati, Lourenço, Quetglas, Sauer and Gillanders2016). Previous studies highlighted the need for an ecosystem-based approach to fisheries management that considers the entire food web and the interactions between species, rather than focusing solely on individual species. (Phillips et al., Reference Phillips, Inger, Bearhop, Jackson, Moore, Parnell, Semmens and Ward2014; Royal Society for the Protection of Birds (RSPB), 2017; Elliott and Limited, Reference Elliott and Limited2020b, Reference Elliott and Limited2020a; Craig and Link, Reference Craig and Link2023). The present work aims at filling such gaps. Extensive stable isotope analysis informs about the general structure of the ecosystem, the trophic niches occupied by functional groups, and provides a proxy for trophic levels. The latter are compared with those calculated from our Ecopath model of the Falkland Shelf, which informs about energy flows, trophic impacts of species and groups on each other, and estimates the importance of each species and group through the keystone index. The findings of this study will have implications for ecosystem-based fisheries management of the Falkland Islands and the presented model can be used as a start point to apply time series data and model different management scenarios (Pauly, Reference Pauly2000; Heymans et al., Reference Heymans, Coll, Link, Mackinson, Steenbeek, Walters and Christensen2016). Understanding the trophic position and impact of an economically and ecologically important species such as Doryteuthis gahi is essential for effective management of the fishery.
Material and methods
Sampling
A sampling protocol was set with the aim to sample selectively abundant commercial and bycatch species in the Patagonian Shelf, with small and large individuals of each species per season and area (Figure 1). Areas were defined as: East (<58° W) and West (>61° W), with samples in between (58° W to 61° W) assigned to North (<52° S), South (>52° S) or High Seas (North of the FICZ). Samples (Table 1) of fishes, skates, sharks, squids and adult (benthic) M. gregaria were taken by scientific observers on fishing vessels in Falkland Islands waters or on-board the FV Castelo or the FV Beagle during three research cruises. Two of these cruises were conducted in February 2020, one was conducted in July 2020. These samples were obtained by bottom trawling at depths between 100 and 857 metres (mean: 190 m; median: 168 m; 90% of samples taken <300 m). In addition, bycatch of seabirds and pinnipeds provided incidental samples of higher trophic-level groups. In total 617 trawl samples were taken between January 2020 and February 2021, representing different fishes, skate, shark, squid and zooplankton species, with zooplankton sample collection described below (Figures 1 and 2).
Map of Doryteuthis gahi samples (left) and other species in the Falkland Shelf ecosystem (right; Squid = except D. gahi); solid lines show Falkland Outer and Falkland Inner Conservation Zone (FOCZ and FICZ), dashed lines represent Argentinean Exclusive Economic Zone.

All sampled species with associated functional groups, measured δ13C and δ15N values ± standard deviation

n, number of samples; mean weight in g with standard deviation and mean length in cm with standard deviation; * one adult individual with 206 kg and one juvenile with only 69 kg; tissue, sampled tissue type for stable isotopes; BM, breast muscle; DMT, dorsal muscle tissue; WM, wing muscle; MT, mantle tissue; whole*, muscle tissue without carapace.
Detailed map of Falkland Islands Conservation Zone sampling area and ‘Loligo box’; dashed lines show Falkland Inner Conservation Zone (FICZ); Doryteuthis gahi not included (see Figure 1).

Zooplankton samples were taken on board three different vessels during three different time periods: (A) On board PV Protegat during February 2020 with a 500 μm mesh size Bongo net from depths between 50 and 200 m, and a tow time of approximately 30 min. (B) On board the RV Jack Sollis in Port William, with a 350 μm mesh Bongo net during February, September and November 2020 at a depth of around 5 metres with a tow time of 10 min. (C) On board the FV Castelo with a 500 μm Isaacs-Kidd plankton net by horizontal trawling (20–150 m depth). Plankton species such as larval M. gregaria, Chaetognatha and Themisto gaudichaudii were identified using an identification key (Boltovskoy, Reference Boltovskoy1999). Salps could only be identified to group level because of the sample condition (damaged). Drifting kelp tissue was obtained from trawls. One valid Particulate Organic Matter (POM) sample was obtained using a bucket to collect surface seawater. Samples of birds, omnivorous and piscivorous species were taken monthly, except for August and December in the case of omnivorous species and except for January, June, August and December for birds and piscivorous species. Other groups were sampled less frequently. See ‘Statistics’ section for information on functional groups. Refer to supplementary materials Table S1 for more details on seasonal sampling.
All samples including bycatch of birds and pinnipeds were brought on land, frozen and defrosted in the FIFD laboratory. Autopsies of birds and pinnipeds followed all local guidelines and jurisdictions (Research Licence No: R12/2022). Total length, measured to the nearest centimetre (cm) for fishes, penguins and pinnipeds, and dorsal mantle length (DML) to the nearest 0.5 cm for squids, was recorded for each individual. In the case of M. magellanicus, pre-anal length was measured to the nearest cm. For skates, the disk-width was measured to the nearest cm. In marine birds, the axillary length was measured to the nearest cm. Total body mass was measured to the nearest 0.02 g, except for heavier individuals such as birds, pinnipeds or large skates, where it was measured to the nearest gram. Sample number, average length and weight for each species can be obtained from Table 1.
Stable isotope measurements
A piece of muscle was extracted for stable isotope analysis. In fishes, a piece of dorsal muscle; in skates, a piece of wing muscle near the spine; in birds, a piece of breast muscle laying underneath the outer fat layer; in squids, a piece dorsal mantle tissue was used, and for crustaceans the outer shell was removed and a piece of muscle tissue was extracted.
In a pilot study, carbon and nitrogen ratios were measured in several fish species, e.g. G. blacodes, M. magellanicus, D. eleginoides, red cod (Salilota australis), P. ramsayi and skates. The C/N ratio was analysed and found to be elevated in G. blacodes, M. magellanicus and D. eleginoides. Following this realization, as lipids are highly depleted in 13C relative to other tissue components (DeNiro and Epstein, Reference DeNiro and Epstein1977), lipids were first removed from tissue samples from these three species using cyclohexane (delipidation), as described by Chouvelon et al. (Reference Chouvelon, Spitz, Cherel, Caurant, Sirmel, Mèndez-Fernandez and Bustamante2011). All other samples were not delipidated as C/N ratio below 4.0 revealed that the content of lipids was not high and lipids would not alter the δ13C signal significantly in these specimens.
Muscle tissue samples were dried for 24 h at 80°C, ground into a fine homogenous powder with a pestle and mortar and then sent to the LIENSs (La Rochelle University, France) for further processing.
All samples were weighed into a tin container using an ME5 Sartorius Microbalance (precision ± 1 μg). The ratios of 13C/12C, 15N/14N and C/N were measured using a Flash 2000 elemental analyser (Thermo Scientific, Milan, Italy) coupled with a Delta V Plus isotope ratio mass spectrometer with a Conflo IV interface (Thermo Scientific, Bremen, Germany). Isotope ratios of samples are reported as δ13C or δ15N values:

where R is 13C/12C or 15N/14N, respectively. The measured isotope ratios were given as δ values in per mil deviation (‰) relative to Vienna PeeDee Belemnite (VPDB) for δ13C and atmospheric N2 for δ15N. Measurements of internal laboratory standards (±0.10‰ for δ13C and ± 0.15‰ δ15N) based on USGS-61 and USGS-62 were inserted every 20 samples between measurements.
Trophic baseline
The utilization of a stable isotope baseline is important for the trophic level calculations reliant on δ15N. Trophic levels, which quantify an organism's position within a feeding hierarchy, are deduced from the differences in nitrogen isotope ratios (δ15N) between consumers and their prey. As δ15N values are influenced by various environmental factors (Peterson and Fry, Reference Peterson and Fry1987; Somes et al., Reference Somes, Schmittner, Galbraith, Lehmann, Altabet, Montoya, Letelier, Mix, Bourbonnais and Eby2010), a missing baseline may lead to misleading trophic level estimations (Cabana and Rasmussen, Reference Cabana and Rasmussen1996). By incorporating stable isotope data from primary producers, such as kelp or phytoplankton, we can accurately standardize nitrogen isotope composition with respect to the base of the food web (Cabana and Rasmussen, Reference Cabana and Rasmussen1996; Stowasser et al., Reference Stowasser, Atkinson, McGill, Phillips, Collins and Pond2012). This baseline enhances the precision of trophic level calculations and helps to account for local and global variations, ensuring reliability, comparability and robustness of the study (Navarro et al., Reference Navarro, Coll, Somes and Olson2013; Perkins et al., Reference Perkins, McDonald, Van Veen, Kelly, Rees and Bearhop2014).
We used the isoscape model provided by St John Glew et al. (Reference St John Glew, Espinasse, Hunt, Pakhomov, Bury, Pinkerton, Nodder, Gutiérrez-Rodríguez, Safi, Brown, Graham, Dunbar, Mucciarone, Magozzi, Somes and Trueman2021), where a δ15N baseline was modelled in R-INLA (integrated nested Laplace approximation) for the Southern Ocean, originally based on POM measurements to calculate trophic levels (TL). Baseline values were extracted from their first interaction model for each season and location of our samples and applied to our analysis according to the following equation:

where 1 represents trophic level 1 of POM, and trophic levels were calculated for each sample. The isoscape model was subdivided into seasons: Jan–Feb, Mar–Apr, May–Oct and Nov–Dec, so we assigned our samples accordingly. To estimate a broad relationship between measured δ15N and calculated trophic levels for visualisation purposes, a simple linear model was performed

using all δ15N values measured, regardless of the species.
Ecopath
The Ecopath model was built using the freeware ‘Ecopath with Ecosim’ software tool, v. 6.6.5 (Pauly, Reference Pauly2000). The mass-balanced approach of Ecopath is based on two equations. The first equation (where P is production):

describes the potential fate of total production of each functional group. The second equation (where Q is consumption):

uses the principle of conservation of matter within each group. Ecopath relies on parameters to define the energy budget of each compartment, and at least three of them must be entered. The four parameters are the biomass (B), production/biomass (P/B; also referred to as total mortality = Z), consumption/biomass (Q/B) ratios, and the ecotrophic efficiency (EE). The ecotrophic efficiency expresses the proportion of the production used in the system (Christensen et al., Reference Christensen, Walters, Pauly and Forrest2008).
The model presented here refers to the area of the Falkland shelf up to a depth of 300 m, which covers about 200,000 km2; it considers species and functional groups that can be found within the shelf area over the year, including migratory species. Adults of D. eleginoides, certain skate species and certain grenadier species were excluded from the model, as they can only be found in depths greater than 300 m. For D. gahi, autumn (ASC) and spring (SSC) spawning cohorts were modelled separately, to enable more precise estimates of their trophic niche and relationships within the ecosystem. The fisheries fleet include jiggers and trawlers; longliners were excluded from the model for the same reason as adult D. eleginoides was excluded.
Production (P/B) as well as total mortality (Z) and consumption (Q/B) rates were mostly obtained from FishBase (Froese and Pauly, Reference Froese and Pauly2021), with the annual water temperature adapted to 7°C. Biomass values for major fish groups were obtained from stock assessment models from the FIFD for 2020. For groups not of commercial interest to the Falkland Islands Fisheries but for which catch data and CPUE data from 2020 were available, a Schaefer production model (BSM) was applied (Froese et al., Reference Froese, Demirel, Coro, Kleisner and Winker2017). For invertebrate species and other functional groups where P/B and Q/B values could not be obtained by FishBase, values of similar functional groups were averaged from other studies (Table 2). Total mortality Z, P/B and Q/B were also calculated and cross validated with the following equations provided by Christensen et al. (Reference Christensen, Walters, Pauly and Forrest2008):

where L ∞ is the asymptotic length, K is the von Bertalanffy growth function (VBGF) parameter, $\;\overline{\overline L}$ is the mean length in the population, and L′ represents the mean length at entry into the fishery.

where W ∞ is the asymptotic weight (g), Temp is the mean annual water temperature in degrees Celsius, A is the aspect ratio of the caudal fin, h is a dummy variable expressing food type (1 for herbivores and 0 for detritivores and carnivores), and d is a different dummy variable expressing food type (1 for detritivores and 0 for herbivores and carnivores).
Definition of functional groups used in the Ecopath model, with references for biomass (B), production (P/B), consumption (Q/B) and ecotrophic efficiency (EE) values; vB, van Bertalanffy; Ecopath, calculated by Ecopath.

1: Barausse et al. (Reference Barausse, Duci, Mazzoldi, Artioli and Palmeri2007), 2: Heymans and Sumaila (Reference Heymans and Sumaila2007),3: Neira and Arancibia (Reference Neira and Arancibia2007), 4: del Monte-Luna et al. (Reference del Monte-Luna, Arreguín-Sánchez and Lluch-Belda2007), 5: Arreguín-Sánchez et al. (Reference Arreguín-Sánchez, del Monte-Luna, Díaz-Uribe, Gorostieta, Chávez and Ronzón-Rodríguez2007), 6: Samb (Reference Samb2007), 7: Salcido-Guevara and Arreguín-Sánchez (Reference Salcido-Guevara and Arreguín-Sánchez2007), 8: Dommasnes et al. (Reference Dommasnes, Christensen, Ellertsen, Kvamme, Melle, Nøttestad, Pedersen, Tjelmeland and Zeller2001), 9: Bornatowski et al. (Reference Bornatowski, Angelini, Coll, Barreto and Amorim2017), 10: Cheung and Pitcher (Reference Cheung and Pitcher2005), 11: Ramos (Reference Ramos2021), 12: Ramos and Winter (Reference Ramos and Winter2021), 13: Ramos and Winter (Reference Ramos and Winter2022a, Reference Ramos and Winter2022b), 14: Bayley et al. (Reference Bayley, Brickle, Brewin, Golding and Pelembe2021), 15: Skeljo and Winter (Reference Skeljo and Winter2021), 16: Calculated after Froese et al. (Reference Froese, Demirel, Coro, Kleisner and Winker2017), 17: Winter (Reference Winter2018), 18: Weir (Reference Weir2017), 19: Arkhipkin et al. (Reference Arkhipkin, Baumgartner, Brickle, Laptikhovsky, Pompert and Shcherbich2008), 20: Arkhipkin et al. (Reference Arkhipkin, Hatfield, Rodhouse, Rosa, O'Dor and Pierce2013), 22: Falkland Conservation (2022), 23: Winter (Reference Winter2021a), 24: Winter (Reference Winter2021b), 25: Arkhipkin et al. (Reference Arkhipkin, Brickle and Laptikhovsky2003), 26: Arkhipkin et al. (Reference Arkhipkin, Brickle, Laptikhovsky, Butcher, Jones, Potter and Poulding2001), 27: Baylis et al. (Reference Baylis, Arnould and Staniland2014), 28: Belleggia et al. (Reference Belleggia, Colonello, Cortés and Figueroa2021), 29: Belleggia et al. (Reference Belleggia, Figueroa, Irusta and Bremec2014), 30: Brickle et al. (Reference Brickle, Laptikhovsky, Pompert and Bishop2003), 31: Brickle et al. (Reference Brickle, Arkhipkin, Laptikhovsky, Stocks and Taylor2009), 32: Büring (Reference Büring2019), 33: Büring et al. (Reference Büring, Schroeder, Jones, Pierce, Rocha and Arkhipkin2022), 34: Cherel et al. (Reference Cherel, Pütz and Hobson2002), 35: Collins et al. (Reference Collins, Brickle, Brown and Belchier2010), 36: Copello et al. (Reference Copello, Quintana and Pérez2008), 37: Dunn et al. (Reference Dunn, Connell, Forman, Stevens and Horn2010), 38: Galvan et al. (Reference Galvan, Botto, Parma, Bandieri, Mohamed and Iribarne2009), 39: Gonzales and Rodhouse (Reference Gonzales and Rodhouse1998), 40: Handley et al. (Reference Handley, Baylis, Brickle and Pistorius2016), 41: Joyce (Reference Joyce2002), 42: Kock et al. (Reference Kock, Wilhelms, Everson and Groger1994), 43: Laptikhovsky et al. (Reference Laptikhovsky, Arkhipkin and Brickle2010), 44: (Laptikhovsky and Arkhipkin (Reference Laptikhovsky and Arkhipkin2003), 45: Laptikhovsky et al. (Reference Laptikhovsky, Arkhipkin and Henderson2001), 46: Loizaga de Castro et al. (Reference Loizaga de Castro, Saporiti, Vales, García, Cardona and Crespo2016), 47: Mouat et al. (Reference Mouat, Collins and Pompert2001), 48: Nyegaard et al. (Reference Nyegaard, Arkhipkin and Brickle2004), 49: Phillips et al. (Reference Phillips, Nichols and Jackson2003), 50: Pinkerton et al. (Reference Pinkerton, Forman, Stevens, Bury and Brown2012), 51: Sigler et al. (Reference Sigler, Hulbert, Lunsford, Thompson, Burek, O'Corry-Crowe and Hirons2006), 52: Shelton (Reference Shelton1978), 53: Yau et al. (Reference Yau, George, Coggan and Criado-Delgado1996), 54: Romero et al. (Reference Romero, Lovrich, Tapella and Thatje2004), 55: Braeckman et al. (Reference Braeckman, Provoost, Sabbe, Soetaert, Middelburg, Vincx and Vanaverbeke2012), 56: Shreeve et al. (Reference Shreeve, Collins, Tarling, Main, Ward and Johnston2009), 57: Sommer et al. (Reference Sommer, Adrian, De Senerpont Domis, Elser, Gaedke, Ibelings, Jeppesen, Lürling, Molinero, Mooij, van Donk and Winder2012), 58: Montecinos et al. (Reference Montecinos, Castro and Neira2016), 59: Alonso et al. (Reference Alonso, Crespo and Pedraza2000), 60: Rey et al. (Reference Rey, Samaniego and Petracci2012), 61: Reiss et al. (Reference Reiss, Häussermann and Mayr2020), 62: Buchan et al. (Reference Buchan, Vásquez, Olavarría and Castro2021).
For functional groups where neither literature nor catch data were available, guesstimated EE values (0–1) were provided to let Ecopath calculate the biomass, and the model was balanced with Ecopath's inbuild PREBAL tools following best practice advice from Heymans et al. (Reference Heymans, Coll, Link, Mackinson, Steenbeek, Walters and Christensen2016). All references for the basic inputs can be found in Table 2. The diet of each functional group was taken from the literature: Frequency of occurrence values were averaged from different studies and species belonging to functional groups. Apart from ‘Detritus’, the group ‘Discards’ was used as prey category for discard-feeders/scavengers, such as birds and its biomass is the sum of all fisheries discards from 2020 (Table S4). The model accounted for cannibalism in several functional groups, such as M. hubbsi, D. gahi (both cohorts), small and large demersal fish. For migratory species such as M. hubbsi, I. argentinus or for the functional group of ‘Toothed Whales and Dolphins’ and sharks, it was assumed that some proportion of their diet would come from outside the shelf region, e.g. spawning grounds, high seas or deeper waters. Therefore, the ‘Import’ field of the diet matrix was used to balance their energy needs, with imports reaching a maximum of 50%. The diet matrix (Table S2), the initial P/B, Q/B and EE values, and catch and discard numbers can be found in the supplementary materials (Tables S3 and S4).
The TL is a fractional and dimensionless index. Ecopath assigns a TL of 1 to detritus and primary producers, and uses feeding preferences to estimate predators' diet compositions. The TL of each species is then calculated based on the biomass-weighted average of the TL of its prey.
The ‘Trophic Level Decomposition’ routine in Ecopath calculates the TL of species in a food web model by decomposing the food web into a set of linear pathways that connect primary producers to each consumer. The routine assigns TLs to each species based on their position in these pathways. The relative flow values indicate the proportion of energy that flows between TLs in the food web. The absolute flow values, on the other hand, indicate the actual amount of energy that flows between TLs, measured in units of energy per units of time and space.
The mixed trophic impact routine can be used to identify the relative impacts of different groups on each other in steady-state systems. It is based on the Leontief matrix, initially developed to analyse economic interactions, which was adapted for use in ecology by Hannon and Joiris (Reference Hannon and Joiris1989). The approach allows for the assessment of the direct and indirect impacts of changes in the biomass of one group on the biomass of other groups in a system.
‘Keystoneness', after Libralato et al. (Reference Libralato, Christensen and Pauly2006), is the evaluation of a trophic group regarding its impact on different elements of the whole ecosystem, with such an impact penalized for larger biomasses. The method was used in this study to evaluate species' importance. To balance the overall effect of group i and consider its biomass, the following equations were used:

where

and

where KSi is the keystone index of group i, mij is the mixed trophic impact (i.e. the impact of group i on groupj), B i is the biomass of group i and Bk is the biomass of all living groups. IC and BC are the impact component and biomass component, respectively. This index scores higher for functional groups that exhibit low biomass proportions (compared to the total biomass in the ecosystem) and high overall effect. Valls et al. (Reference Valls, Coll and Christensen2015) suggested the following index:

where BC0 stands for the biomass component based on the rank of each group biomass B i.
Statistics
All statistical analyses were performed using R v.4.03 (R Core Team, 2020). Plots were generated using the R package ‘ggplot2’ (Wickham, Reference Wickham2016). The VBGF parameters were calculated using the R package ‘FSA’ (Ogle et al., Reference Ogle, Doll and Dinno2022), which stands for Fisheries Stock Assessment methods.
Standard ellipse and trophic niche overlap calculations for the stable isotope values were performed using a Bayesian model approach with the R packages ‘SIBER’ (Jackson et al., Reference Jackson, Inger, Parnell and Bearhop2011; SIBER = Stable Isotope Bayesian Ellipses in R) and ‘nicheROVER’ (Lysy et al., Reference Lysy, Stasko and Swanson2021). The number of Monte Carlo draws (iterations) was set to 1000 and α to 95%. Trophic niche refers to the stable isotope niche when analysing δ13C and δ15N values together (Bearhop et al., Reference Bearhop, Adams, Waldron, Fuller and Macleod2004).
The SIBER package calculates: (1) The range of δ15N, which provides information on the trophic length of the biological community (i.e. the trophic chain length). (2) The range of δ13C, which provides an estimate of the diversity of basal resources. (3) The total area of the convex hull including all data points (TA), which provides an indication of the niche width of each group. (4) The mean distance to the centroid (CD), which can give additional information on the niche width of each group but also about the group spacing (i.e. it increases asymptotically with sample size). (5) The mean nearest-neighbour distance (MNND), which provides a measure of density and clustering of species within the community (it decreases with sample size). (6) The standard deviation of the nearest-neighbour distance (SDNND), which provides a measure of evenness of spatial density and packing of data points (it decreases with sample size). Calculation of the food chain length also followed a Bayesian approach. First, the whole dataset was resampled with 1000 Monte Carlo draws and each time the minimum trophic level was subtracted from the maximum trophic level (equation (11)) to obtain the chain length. Then, the maximum likelihood was calculated with the ‘stats4’ package of R (R Core Team, 2020). Equation (11) was also used to calculate the food chain length of the Ecopath model, excluding trophic level 1 (detritus and primary producers).

Species were grouped into functional groups based on their diet, foraging behaviour or habitat use; e.g. ‘Zooplankton’, ‘Birds’ etc. Therefore, M. gregaria was split into juvenile/pelagic individuals that were grouped together with zooplankton, whereas adult/benthic individuals formed their own unique group (Table 1). Euphausia lucens and Thysanoessa macura were pooled as ‘Euphausiacea’. Unidentified Myctophidae and Gymnoscopelus nicholsi were pooled as ‘Zooplanktivorous’. Many species in intermediate trophic levels were pooled as ‘predatory/omnivorous’, because of complex ontogenetic diet changes or uncertainty of their feeding behaviour. D. gahi was split into ASC and SSC individuals based on Arkhipkin et al. (Reference Arkhipkin, Hatfield, Rodhouse, Rosa, O'Dor and Pierce2013) and Büring et al. (Reference Büring, Schroeder, Jones, Pierce, Rocha and Arkhipkin2022, Reference Büring, Jones, Pierce, Rocha, Bustamante, Brault-Favrou and Arkhipkin2023) to allow direct comparisons of TLs based on stable isotopes vs the Ecopath model. Species with less than three samples were excluded from the Bayesian analysis (Table 1).
A series of ANOVAs was performed to investigate differences in stable isotope values between males and females of each species. Linear models were applied to show the relationship between δ15N and δ13C vs the logarithm (base 10) of wet body weight (‘Weight’) of different species.

For the comparison of TLs estimated using stable isotopes (SI) and Ecopath, the following equation was used:

Results
Trophic levels and trophic niches derived from stable isotope measurements
Whereas δ15N and δ13C stable isotope ratios are ‘direct’ measurements, which have been influenced by different factors such as season and location, TLs were calculated based on the isoscape model described in the methods and therefore consider these environmental influences. To give a broad estimate of the trophic position of each species, a second y-axis was introduced in Figure 3, using the relationship between all measured δ15N values vs calculated trophic levels (equation (3)): TL = 0.676 + 0.225 × δ15N (P < 0.001, adj. r 2 = 0.41, F = 420, DF = 608). The maximum likelihood (α = 95%) of the trophic chain length was found to be 3.65, measured from zooplankton to top predators.
Standard ellipse areas around functional groups based on δ13C and δ15N stable isotopes.

Lowest and highest δ13C values among all samples were measured in kelp tissues with −23.16‰ and −12.85‰. Juvenile M. gregaria had the lowest (−21.99‰) observed δ13C values for animals. The lowest overall mean δ13C values were found for T. gaudichaudii (−21.42‰), G. nicholsi (−20.62‰) and Euphausiacea (−20.61‰). The lowest δ15N values within all samples were measured in Euphausiacea (6.65‰) and juvenile M. gregaria (6.90‰). Lowest overall mean δ15N values were found in Euphausiacea (8.04‰), T. gaudichaudii (8.32‰) and juvenile M. gregaria (8.59‰). Zooplankton organisms, which include Chaetognatha, juvenile M. gregaria, Euphausiacea and salps, were found to have an average δ15N value of 8.61‰, representing a TL of 2.5 (Figure 3, Table 1).
Zooplanktivorous species grouped separately; they had a TL of around 3 and showed the smallest δ13C range (1.85), likely due to only myctophid species being included in this group. Values of ‘mean nearest-neighbour distance’ and ‘centroid distance’ represent the density of sampling points within these groups. The zooplanktivorous group contained the fewest samples and mean nearest neighbour distances were highest (0.66 ± 0.63). The centroid distance was low (1.02), meaning that samples were still clustered together (Table 3). Kelp displayed the largest standard ellipse area (in ‰2), followed by planktivorous taxa and zooplankton (Table 3).
Results from the Bayesian stable isotope analysis model; centroid distance, mean nearest neighbour distance with standard deviation, total area, standard ellipse area and corrected standard ellipse area summarized for each functional group

Adult M. gregaria were found at TLs between 2.7 and 3.7, with δ13C values around −17.5‰. Birds had the third lowest δ13C ranges because of the low number of species included (Table 3). Omnivorous species showed the second highest δ13C ranges and therefore had high diversity in carbon sources, followed by benthic omnivorous species (adult M. gregaria). Seabirds were found to have slightly higher TLs (around 3.6) compared to predatory/omnivorous species (around 3.4) such as squids (D. gahi, I. argentinus and Moroteuthopsis ingens) or benthopelagic fish (M. australis, P. ramsayi, M. magellanicus, Cottoperca gobio and D. eleginoides).
Cat shark S. bivius showed the highest δ13C values (−15.06‰) among all samples. Highest overall mean δ13C values were found for O. flavescens (−15.97‰), B. albomaculata (−16.01‰) and S. bivius (−16.46‰). Piscivorous species showed the second broadest δ13C range among consumers, after omnivorous species (Table 3).
The highest δ15N values were measured in S. acanthias (19.61‰), M. hubbsi (18.03‰) and S. australis (17.41‰). Overall, G. blacodes had the highest mean δ15N values (16.34‰). Skates (omnivorous benthic) were found to have TLs around 3.6 and higher δ13C values compared to the omnivorous and bird species (−16.5‰). Large pelagic predatory fish (piscivorous) such as G. blacodes, S. australis and M. hubbsi were found to have the highest TLs (~4), together with other top predators such as the South American fur seal and the sea lion (Figure 3). Piscivorous species also had the highest centroid distance of all groups (Table 3), with some samples far away from the centroid. Omnivorous and piscivorous species showed the highest δ15N ranges (each 7.5‰) whereas benthic omnivorous species (skates and cat shark) had lower δ15N ranges (5.15‰).
Niche overlap
We analysed the niche overlap among eight functional groups, which had enough samples for the Bayesian approach. Our results revealed a wide range of niche overlap, with some groups exhibiting high levels of similarity in their stable isotope signature, whilst others were markedly distinct (Figure 4, Table S5).
Niche overlap of each functional group as determined with a Bayesian model.

Birds were the functional group with the highest overall niche overlap, sharing 99.19% of their niche with predatory/omnivorous species and sharing 85.14% of their niche with piscivorous species. Predatory/omnivorous species shared 65.79% of their niche with birds. M. gregaria (adults) had the highest overlap with predatory/omnivorous (56.58%) and the least overlap with zooplankton (2.97%). The predatory/omnivorous group shared 59.02% of their niche with the piscivorous group. Benthic omnivorous (skates) had the least niche overlap with zooplankton and vice versa (<0.01% and 0.01%, respectively); skates exhibited the lowest sharing of niche space with any of the groups and their highest niche overlap was with adult M. gregaria (51.82%), and predatory/omnivorous species (39.04%). The piscivorous group had their highest share with predatory/omnivorous species (52.72%), followed by birds (37.16%); their lowest share was with kelp (0.12%). The highest share of the kelp niche was found to be with adult M. gregaria (17.01%). Zooplanktivorous species shared 64.09% of their niche with zooplankton and 60.83% with predatory/omnivorous species but only 0.04% of their niche was shared with benthic omnivorous (skates), a score even lower than their share with piscivorous species (1.51%). Zooplankton had their highest niche shares with primary producers (65.16%) and zooplanktivorous species (41.49%).
Ontogenetic change in stable isotope values
No significant differences in δ15N or in δ13C values were found between males and females of each species (ANOVA, see Table S6, supplementary material). Therefore, linear models (equation (8)) did not include the variable sex. All investigated species had a significant (P < 0.001, Table S7 supplementary material) positive fit for δ15N dependent on weight with the exception of G. blacodes, D. lamillai, P. griseus, T. melanophrys and S. acanthias (Figure 5). Average adjusted r 2 for all species with a significant fit was 0.46 (Table S7). For δ13C, D. eleginoides, I. argentinus, M. hubbsi, P. ramsayi and S. australis showed significant (P < 0.001, Table S7) trends of increasing δ13C values with increasing weight.
Relationships of δ15N vs weight [g] of species with more than four samples; TL on second y-scale (right); grey area represents 95% confidence interval.

Red cod S. australis showed the highest range in TL (minimum to maximum TL), which was 2.68 TLs; D. gahi also displayed a high range of 2.27 TLs, followed by I. argentinus with a range of 2.18 TLs, and D. eleginoides with a range of 2.03 TLs.
Trophic levels, keystoneness and impacts derived from ecopath
By following PREBAL diagnostic checks, and following rules of thermodynamics and ecology, the final model was balanced (Link, Reference Link2010; Heymans et al., Reference Heymans, Coll, Link, Mackinson, Steenbeek, Walters and Christensen2016). The main goal of the Ecopath model was to estimate TLs and cross-validate the TLs estimated using stable isotope analysis. The length of the trophic chain was found to be ~3.31, ranging from phytoplankton/detritus (TL 1.00) to Austral hake M. australis (TL 4.31).
Highest TLs were found in Austral Hake with 4.31, sharks (4.16) and toothed whales and dolphins (4.09). Squids such as the functional group Squid (including M. ingens) and the individual species groups I. argentinus and D. gahi ASC and SSC were found to have trophic levels of 3.35, 3.20, 3.18 and 3.16, respectively (Table 4). All squid species occupy central positions in the ecosystem, linking lower trophic levels such as zooplankton, benthic crustaceans and myctophids to higher trophic levels such as hake, kingclip, birds and penguins, sharks, seals and dolphins (Figure 6).
Basic estimates from the Ecopath model; biomass values within parentheses were calculated by Ecopath; ecotrophic efficiency (EE) values in parentheses were provided by the user.

Ecopath energy flow diagram with trophic levels indicated on the y-axis; node size proportional to biomass (log transformed); colours representing functional groups, similar to Figure 3: pink, top predators; light blue, fishing fleet; light green, piscivorous fish; turquoise, benthic species; dark purple, bird species; orange, predatory/omnivory species; yellow, small demersal species; grey, zoobenthic species; dark green, primary producer.

Using the ‘Trophic Level Decomposition’ routine of Ecopath, we found that TL 3 had the highest relative energy flows through the system (Figure S1 supplementary material), implying that the intermediate consumers (e.g., carnivores or omnivores) are highly efficient at converting the energy they consume into biomass. Trophic level 4 had second highest relative flow values, followed by trophic level 2 and lastly levels 1 and 5. These distributions of efficiency values among discrete trophic levels are indicative of an ecosystem with a wasp-waist structure (Riccialdelli et al., Reference Riccialdelli, Becker, Fioramonti, Torres, Bruno, Rey and Fernández2020).
The most important species, considering keystone indices above or close to zero (after Libralato et al., Reference Libralato, Christensen and Pauly2006) were sharks, pinnipeds and phytoplankton (Figure 7 top). Just below zero, there were penguins, all squid species (including both cohorts of D. gahi on 11th and 13th position, counting from most important to least important groups), hake and rock cod as well as zoobenthic and pelagic invertebrates. The least important species were flounder, baleen whales, kelp and juvenile toothfish. This ranking was found to be similar when considering keystone indices by the method of Valls et al. (Reference Valls, Coll and Christensen2015), except that phytoplankton and zooplankton are ranked lower. Both cohorts of D. gahi are ranked high in both methods, just after large predators and penguins.
Keystone index after Libralato et al. (Reference Libralato, Christensen and Pauly2006); this index provides an estimate of the relative total impact of trophic groups by considering their biomass (i.e. direct and indirect impacts are more relevant for low biomass trophic groups).

Ecopath allowed for estimation of the impact of and on D. gahi using the mixed trophic impact routine (Figure S2, supplementary material). The highest negative impact of both cohorts is on Myctophidae (Figure 8). Many predators of D. gahi (e.g. penguins, kingclip, dogfish and hake) also showed high negative impacts by D. gahi, probably due to indirect interactions, e.g. increased predation on myctophids and benthic crustaceans by D. gahi would decrease the prey availability for these predators. For both cohorts, the most positive impact on other species and groups is exerted on ‘Toothed Whales and Dolphins’ and on ‘Seals and Sea Lions’, due to top-down effects such as direct predation on D. gahi. Furthermore, both fishing fleets (jigging and trawling) would benefit from higher D. gahi biomasses, as would red cod (Figure 8).
D. gahi as an impacting species within the Falkland Shelf. Impacts are ordered from the most negative to the most positive.

Both D. gahi cohorts have the highest negative effects on each other when assessed from the perspective of impacted species. Other compartments negatively impacting D. gahi are the trawl fishery and populations of I. argentinus, hake, red cod and squid (Figure 9). Positive impacts on D. gahi were shown to occur with increased biomass of Myctophidae, phytoplankton and zooplankton, due to bottom-up effects.
D. gahi as the impacted species within the Falkland Shelf. Impacts are ordered from the most negative to the most positive.

Comparison of trophic levels between methods
Comparing TLs calculated using Ecopath with those derived from stable isotopes (Figure 10), we found that the mean difference was 0.385 TL (7.89%), with a median difference of 0.390 TL (8.42%). An ANOVA comparing the two different TL types was found to be non-significant at the 5% level (P = 0.147, df = 1, residuals = 64, F = 2.155), with trophic levels based on stable isotopes that tended to be higher compared to those calculated in Ecopath.
Difference in trophic level between stable isotope measurements and Ecopath (in%), sorted by trophic level (bottom low, top high); species labels on the left, corresponding functional group on the right; colour intensity shows the extent of difference between Ecopath and isotope TL estimates.

One of the largest differences between stable isotopes and Ecopath could be found in juvenile M. gregaria (23.7%), P. gravis (19.6%), followed by C. gobio (18.6%) and T. melanophrys (18.2%). A. australis, S. acanthias and D. eleginoides all had <3% difference in TL when comparing the estimates derived from the two methods. This was followed by M. australis (4.2%) and S. bivius (6.0%), which also display minor differences (Figure 10).
We compared similar functional groups from our model with those of Cheung and Pitcher (Reference Cheung and Pitcher2005). The trophic levels of Cheung and Pitcher's model were higher (P = 0.019, df = 1, residuals = 50, F = 5.86, ANOVA) compared to those calculated in the present study (Figure S3 supplementary material). Furthermore, differences between trophic levels derived from stable isotopes and our Ecopath model were slightly smaller than differences between the two Ecopath models (P = 0.107, df = 1, residuals = 46, F = 2.71, ANOVA).
Discussion
To the best of our knowledge, this is the first ecosystem model in the area of the Falkland Shelf focused on the functional role of squid. Moreover, this is the first attempt to compare trophic levels (TL) of species of the Falkland Shelf derived from two different methods. In this work, we relied on both a chemical–analytical approach (stable isotope analysis) and a modelling approach, which makes use of a mass-balanced trophic network analysed using the Ecopath with Ecosim software program. We aimed to clarify the role of the key species D. gahi in the wasp-waist structured ecosystem of the Falkland shelf, where a small number of key species play a crucial role in the connectivity and therefore the health and productivity of the ecosystem.
Stable isotopes
Species sampled and analysed with stable isotope analysis ranged from lower TLs such as zooplankton species to intermediate levels, e.g. birds, squids and smaller fish up to top predators like hake, kingclip and pinnipeds. Based on their δ15N values, species ranked according to their estimated TL as expected and grouped together as feeding guilds. A trend of increasing δ13C values with increasing TL was observed, and δ13C values separated pelagic from benthic species, which aligns with descriptions in other studies (Peterson and Fry, Reference Peterson and Fry1987; Post, Reference Post2002; Fry, Reference Fry2006).
Kelp had higher δ15N values than expected from their TL. The nitrogen stable isotopes of macroalgae could be higher compared to phytoplankton due to differences in their nitrogen utilization strategies. Macroalgae are able to take up nitrogen in a variety of forms, including nitrate, ammonium and organic nitrogen (Alwyn and Rees, Reference Alwyn and Rees2007) but indications suggest that they could prefer ammonium, while phytoplankton might prefer nitrate (Hein et al., Reference Hein, Pedersen and Sand-Jensen1995). This could lead to lower δ15N values in phytoplankton compared to macroalgae. Additionally, macroalgae tend to grow on rocky substrates creating more sheltered environments (Bayley et al., Reference Bayley, Brickle, Brewin, Golding and Pelembe2021), which have a higher concentration of organic matter and ammonium when compared to open waters, further contributing to their higher δ15N values (Sfriso and Pavoni, Reference Sfriso and Pavoni1994; Fry, Reference Fry2006).
Furthermore, kelp stable isotope signatures were found to vary with season and their changes were measured in δ15N up to 10‰ (Foley and Koch, Reference Foley and Koch2010). However, our samples were not taken from living kelp organisms but obtained as tissue pieces found in trawls. Therefore, tissue samples were probably already undergoing bacterial degradation, altering and increasing the δ15N signature (Macko and Estep, Reference Macko and Estep1984). Our particulate organic matter (POM) showed elevated δ15N, potentially caused by bacterial degradation or because parts of microbes or faeces were accidentally sampled. However, Hückstädt et al. (Reference Hückstädt, Rojas and Antezana2007) found similar carbon and nitrogen values of POM in Chilean waters to our study.
Genypterus blacodes is known to be a benthic predator and showed higher TLs based on stable isotope analysis when compared to Ecopath. Benthic species often display elevated δ15N values (Mintenbeck et al., Reference Mintenbeck, Jacob, Knust, Arntz and Brey2007) because of bacterial degradation of food items such as marine snow eaten by these benthic prey species, which means stable isotope values of G. blacodes might be elevated and might not reflect adequately the TL of the species. Nevertheless, TL of G. blacodes was previously estimated between 4.18 and 4.34 based on stomach content analysis and 4.48 based on stable isotopes sampled in Chile (Hückstädt et al., Reference Hückstädt, Rojas and Antezana2007, Table 5). The same inflation of δ15N values may also apply to the analysed skate species and M. gregaria due to their benthic feeding.
Selected trophic levels and stable isotopes of comparable studies; *1 = based on hair and vibrissae samples; *2 = based on blood samples.

Several studies such as Quillfeldt et al. (Reference Quillfeldt, Ekschmitt, Brickle, Mcgill, Wolters, Dehnhard and Masello2015), Rosas-Luis et al. (Reference Rosas-Luis, Navarro, Sánchez and Del Río2016), Ciancio et al. (Reference Ciancio, Pascual, Botto, Frere and Iribarne2008) and Hückstädt et al. (Reference Hückstädt, Rojas and Antezana2007) reported TLs of species investigated in this study. An overview of the reported values can be found in Table 5. Overall, species were found to have similar trophic levels or stable isotope values in this study compared to previous studies.
Our study found clear positive relationships between body mass and δ15N values for most of the species, indicating 15N ontogenetic diet changes, as larger individuals feed on larger prey (Peterson and Fry, Reference Peterson and Fry1987; McCutchan et al., Reference McCutchan, Lewis, Kendall and McGrath2003; Fry, Reference Fry2006). Ruiz-Cooley et al. (Reference Ruiz-Cooley, Gerrodette, Chivers and Danil2021) found that top-predators might not show a linear increase in trophic level as a function of increasing biomasses but rather exhibit an asymptotic behaviour. However, in our study the adjusted r 2 of linear models expressing the TL of higher predators as a function of body weight was still high (M. hubbsi r 2 = 0.486, S. australis r 2 = 0.651). The high ranges in TL associated with squid (D. gahi and I. argentinus) and red cod (S. australis) might be due to the fact that the sample weight of these species varied by a factor of 100. On the other hand, these species displaying a pronounced trend of ontogenetic diet change (Arkhipkin et al., Reference Arkhipkin, Brickle, Laptikhovsky, Butcher, Jones, Potter and Poulding2001; Mouat et al., Reference Mouat, Collins and Pompert2001; Büring et al., Reference Büring, Schroeder, Jones, Pierce, Rocha and Arkhipkin2022).
The analysis of niche overlap among different functional groups revealed a wide range of similarities and differences, suggesting similar feeding habits in some, while others have markedly distinct feeding preferences. For example, birds exhibited the highest overall niche overlap with other functional groups, sharing their niche with predatory/omnivorous species and piscivorous species. Birds were found to feed a lot on discards, e.g. fish guts and heads from fishing vessels (Kuepfer et al., Reference Kuepfer, Votier, Sherley, Ventura, Matias, Anderson, Brickle, Arkhipkin and Catry2022), resulting in elevated δ15N ratios (Mariano-Jelicich et al., Reference Mariano-Jelicich, Copello, Seco Pon and Favero2014). Another interesting finding was the high niche overlap between adult M. gregaria and benthic omnivorous species (56.58%). This share is less than that with predatory/omnivorous species, suggesting that adult M. gregaria are a more important food source for benthic omnivorous species (Brickle et al., Reference Brickle, Laptikhovsky, Pompert and Bishop2003; Arkhipkin et al., Reference Arkhipkin, Baumgartner, Brickle, Laptikhovsky, Pompert and Shcherbich2008) than for predatory/omnivorous species, sharing the same benthic habitat. Additionally, benthic omnivorous (skates) had the least niche overlap with zooplankton and vice versa, which indicates that skates feed little on pelagic zooplankton, even though previous studies found euphausiids and amphipods in the diet of skates (Brickle et al., Reference Brickle, Laptikhovsky, Pompert and Bishop2003; van der Grient et al., Reference van der Grient, Morley, Arkhipkin, Bates, Baylis, Brewin, Harte, White and Brickle2023).
The results also showed that piscivorous species had their highest share with birds, followed by predatory/omnivorous species. This finding suggests that piscivorous species heavily rely on predatory/omnivorous species as a food source, highlighting the importance of the predatory/omnivorous functional group within the ecosystem. Overall, the analysis of niche overlap among different functional groups highlights the complex interactions and interdependencies that exist within the ecosystem.
Ecopath model
Ecopath models represent a mass-balanced snapshot of average energy flows between ecosystem compartments, often calculated on an annual basis. Many species in the Falkland Shelf are migrating annually on and off the Shelf, with little information available about their population sizes and dynamics; hence, assumptions had to be made to construct the model. Furthermore, modelling the lower trophic levels of the ecosystem (phytoplankton and zooplankton) is particularly difficult around the Falkland Islands as data are scarce. This latter condition resulted in pooling all planktonic primary producers and zooplankton taxa into two main compartments. Further concerns on data availability apply to all biomass estimates, which can have wide confidence intervals, and all migratory species that leave the Falkland Islands Conservation Zone for spawning, such as I. argentinus (Arkhipkin, Reference Arkhipkin2013; Chemshirova et al., Reference Chemshirova, Hoving and Arkhipkin2021) and M. hubbsi (Macchi et al., Reference Macchi, Pájaro and Dato2007). D. gahi, as a main species of interest, is the only species with seasonal differences considered here and was split into ASC and SSC. This split could be supported as data regarding biomass estimates, fisheries seasons and stomach data were available (Büring et al., Reference Büring, Schroeder, Jones, Pierce, Rocha and Arkhipkin2022). For other (mostly migratory) species, for which supporting data were absent, we considered average biomass values over the year. This choice, of annual averages, might affect estimates of trophic interactions, which may be more seasonally dependent. As a result, estimates of energy flows and potential ecosystem structure may be affected by this. One of the ways ecosystem models can be used is in the support for an ecosystem-based approach to fisheries management, and this requires a sufficient understanding of the ecosystem functioning and structure. However, the use or disuse of ecosystem models is potentially more affected by management frameworks rather than data limitations, suggesting that this model is still an important and necessary step towards ecosystem-based management to fisheries in the Falkland marine ecosystem (Craig and Link, Reference Craig and Link2023). Furthermore, seasonal changes might be addressed using a dynamic solution of Ecopath, thus including an Ecosim component (Christensen et al., Reference Christensen, Walters, Pauly and Forrest2008).
Even though our model used the previous ecosystem model as a starting point (Cheung and Pitcher, Reference Cheung and Pitcher2005), some of the main features between our Ecopath model and the previous version developed by Cheung and Pitcher (Reference Cheung and Pitcher2005) were markedly different. Cheung and Pitcher based some of their parameters on the Newfoundland model. Our restriction of the shelf area to a depth of above 300 m, and as a result the exclusion of bathyal species such as adult toothfish and the Longlining fleet, is another important difference. Furthermore, we constructed a new diet matrix relying on different studies and updated the values on biomass, landings and discards. This was especially necessary, as the ecosystem underwent some crucial changes within the last 20 years (Busbridge et al., Reference Busbridge, Marshall, Arkhipkin, Shcherbich, Marriott and Brickle2020). We also focused on single abundant species (in terms of catchability) rather than on functional groups. Functional groups and species were updated and therefore different for the Cheung and Pitcher model (Reference Cheung and Pitcher2005). We excluded for example some of the original groups such as snoek or basking shark, as these species are not regularly found in Falkland Islands waters. This adjustment was possible because of the direct access to fisheries-related data from the FIFD database. Another relevant adjustment concerns the modelling of D. gahi, with two cohorts considered separately. This choice enabled assessing their particular importance in the ecosystem and the fact that maturity stages of both cohorts differ in both spatial and temporal distribution and were found to have different trophic ecology (Büring et al., Reference Büring, Schroeder, Jones, Pierce, Rocha and Arkhipkin2022, Reference Büring, Jones, Pierce, Rocha, Bustamante, Brault-Favrou and Arkhipkin2023; Jones et al., Reference Jones, Bustamante, Guillou and Arkhipkin2023). The inclusion in the model of two cohorts allowed us to consider their mutual predation.
Although many species in the Ecopath model prey on I. argentinus, its ecotrophic efficiency (EE) is low (0.308), despite its high P/B ratio and high biomass. However, I. argentinus is a migratory species caught by a large fleet of jigging vessels not only in Falkland Islands waters but also within the Argentine Exclusive Economic Zone (EEZ) and international waters, and these catch data were not available to us. In addition, outside the Argentine EEZ there is a known area of unregulated squid fisheries (Seto et al., Reference Seto, Miller, Kroodsma, Hanich, Miyahara, Saito, Boerder, Tsuda and Oozeki2023), which extracts an unknown amount of squid biomass. This means the real EE of I. argentinus could exceed the values calculated for our ecosystem model, thus indicating a strong status of excessive exploitation.
Comparison between methods
Overall, both methods yielded similar results for calculating TLs. The maximum TL discrepancy between the two methods was less than 20%, with an average of less than 10%, which suggests that both methods are comparable. Other studies found differences between both methods around 13% (Milessi et al., Reference Milessi, Danilo, Laura, Daniel, Javier and Rodríguez-Gallego2010; Du et al., Reference Du, Cheung, Zheng, Chen, Liao and Hu2015, Reference Du, Makatipu, Tao, Pauly, Cheung, Peristiwady, Liao and Chen2020). In general, the comparison between trophic levels of species is more meaningful than comparison between functional groups. In the case of species showing higher TLs in Ecopath compared to stable isotope analysis, diet studies might have been biased or did not reflect the diet at time of sampling. These deviations might be caused by seasonal factors, opportunism, digestibility of prey, and ontogenetic changes (van der Grient et al., Reference van der Grient, Morley, Arkhipkin, Bates, Baylis, Brewin, Harte, White and Brickle2023). Moreover, there might be cases with single species not sharing the same diet as other species belonging to the same functional group, which is a lost detail because of the averaging within a functional group. This may be the case where we compared M. ingens with the Ecopath functional group of squid. Overall, there seem to be a trend of higher TL based on stable isotopes compared to Ecopath. As details of lower TLs are missing, e.g. micro- and macro-zooplankton, there might be one or several missing TLs in the model (Sommer et al., Reference Sommer, Charalampous, Scotti and Moustaka-Gouni2018). Length of the trophic chain (lowest to highest species/functional group) was found to be comparable between methods with 3.65 TLs (stable isotope analysis) and 3.31 TLs (Ecopath), resulting in an average total length of 3.48 TLs from the lowest to the highest group in the ecosystem, excluding primary producer. Thus, the total length is 4.48 TLs. The shorter chain length of the Ecopath model also suggests there could be interactions missing, due to the scarcity of data on lower TLs.
The Falkland shelf ecosystem and migration in the Patagonian Shelf LME
The Patagonian Shelf LME and its sub-area, the Falkland Shelf, display wasp-waist characteristics, e.g. the food web contains many top predator species and many species at the base but few in the middle. Regarding the base of the food web, there is high biodiversity in lower trophic levels, such as in zooplankton, with about 505 species of copepods, 188 species of amphipods and 61 species of euphausiids recorded in the South Atlantic Ocean (Boltovskoy et al., Reference Boltovskoy, Correa and Boltovskoy2003; Hoffmeyer et al., Reference Hoffmeyer, Sabatini, Brandini, Calliari and Santinelli2018). Few papers have been published about zooplankton dynamics or their importance in the Falkland Shelf ecosystem (Sabatini and Colombo, Reference Sabatini and Colombo2001), even though zooplankton represent the backbone of the ecosystem as the keystone species D. gahi, I. argentinus and P. ramsayi heavily rely on them (Mouat et al., Reference Mouat, Collins and Pompert2001; Laptikhovsky and Arkhipkin, Reference Laptikhovsky and Arkhipkin2003; Büring et al., Reference Büring, Schroeder, Jones, Pierce, Rocha and Arkhipkin2022). To refine future ecosystem models, more research on plankton communities on the Patagonian Shelf should be undertaken.
There are many predatory species in the Patagonian Shelf LME, including piscivorous fish species such as hakes, red cod and kingclip, skate and shark species (Arkhipkin et al., Reference Arkhipkin, Brickle, Laptikhovsky and Winter2012). Other relevant predators are three pinniped species, several baleen and toothed whale species, dolphins, five penguin species and many other seabird species (van der Grient et al., Reference van der Grient, Morley, Arkhipkin, Bates, Baylis, Brewin, Harte, White and Brickle2023). Despite the high productivity of the Patagonian Shelf LME, many of the higher TL consumers display migratory behaviour, with differences between the location of feeding and spawning grounds (van der Grient et al., Reference van der Grient, Morley, Arkhipkin, Bates, Baylis, Brewin, Harte, White and Brickle2023). For instance, I. argentinus feed largely along the Argentinian and Uruguayan coasts (Chemshirova et al., Reference Chemshirova, Hoving and Arkhipkin2021), away from its main spawning area. Arkhipkin et al. (Reference Arkhipkin, Brickle, Laptikhovsky and Winter2012) suggested that feeding pressure experienced by their offspring might be too high to establish a spawning population on the shelf area. Conversely, in the mid-trophic levels the presence of constant nutrient availability may result in the prevalence of a few dominant species outcompeting the others (Alemany et al., Reference Alemany, Acha and Iribarne2009) and establishing spawning populations. In addition to the high biodiversity of lower trophic levels, it is worth noting the unique characteristics of squid life history and their plasticity in adapting to a changing environment. Squids like D. gahi are predators with short life spans and high growth rates (Jackson and O'Dor, Reference Jackson and O'Dor2001), allowing them to take advantage of any niches much quicker than multiannual species (Rodhouse and White, Reference Rodhouse and White1995). This flexibility could play an important role in the ecosystem dynamics of the Falkland shelf ecosystem as squid can quickly adapt to changing environmental conditions (Hoving et al., Reference Hoving, Gilly, Markaida and Benoit-Bird2013) and take advantage of newly available resources.
Keystone species are considered species with low biomass but high impact on – and a structural role in – the ecosystem (Libralato et al., Reference Libralato, Christensen and Pauly2006). For the Falkland Shelf ecosystem, the definition of keystone species applies to the top predators: sharks, seals and sea lion, dolphins and penguins. However, D. gahi and other squids undoubtedly play an important role in the Falkland Shelf ecosystem. D. gahi's biomass is high but its influence may be disproportionate high compared to its biomass. The highest negative impacts of D. gahi biomass were found on Myctophidae and on D. gahi itself (including both cohorts separately), because of a high proportion of cannibalism in its diet (Büring et al., Reference Büring, Schroeder, Jones, Pierce, Rocha and Arkhipkin2022). A positive trophic impact may occur when an increase in the biomass of one trophic level leads to an increase in the biomass of the trophic levels that consume it as a resource. For example, if the biomass of D. gahi increases there is an increase in the biomass of pinnipeds and other species feeding on D. gahi. Conversely, a negative trophic impact occurs when an increase in the biomass of one trophic level leads to a decrease in the biomass of the trophic levels that are consumed by it. For example, if the biomass of D. gahi increases this may lead to a decrease in the biomass of Myctophidae that are preyed upon by D. gahi. These two examples represent rather simplistic direct relationships, but the mixed trophic impact outcomes presented here are valuable because they can describe less intuitive and indirect consequences like the concept of beneficial predators found by Bondavalli and Ulanowicz (Reference Bondavalli and Ulanowicz1999). Understanding the positive and negative trophic impacts in a food web can help to identify important relationships and potential ecological effects of changes in species abundances or management strategies. Quantifying positive impacts on other species can help to identify key species that are critical to the overall functioning and productivity of the food web. Conversely, mapping trophic relationships responsible for the spread of negative impacts can help to identify potential risks and trade-offs associated with management strategies that affect the species involved. The highest positive impacts of D. gahi were found on top predators because of feeding habits of these consumers that either directly or indirectly depend on the squids (Alonso et al., Reference Alonso, Crespo and Pedraza2000; Laptikhovsky et al., Reference Laptikhovsky, Arkhipkin and Brickle2010). The highest negative impacts of D. gahi were found on myctophids. Myctophids are highly abundant and represent an important group of mesopelagic fish in the oceans. They are an important group in Antarctic waters (Pusch et al., Reference Pusch, Hulley and Kock2004; Pakhomov et al., Reference Pakhomov, Bushula, Kaehler, Watkins and Leslie2006) and the highest myctophid abundances can be found between 200 and 700 m in the Scotia Sea (Lourenço et al., Reference Lourenço, Saunders, Collins, Shreeve, Assis, Belchier, Watkins and Xavier2017). Previous studies found high frequency of occurrence of myctophids in D. gahi stomachs (Brickle et al., Reference Brickle, Olson, Littlewood, Bishop and Arkhipkin2001, Büring et al., Reference Büring, Schroeder, Jones, Pierce, Rocha and Arkhipkin2022). Our model and the dietary studies used for it suggest high abundances of myctophids are needed to sustain the ecosystem. However, studies regarding the abundance, biomass, and distribution of Myctophidae are scarce around the Falkland Islands, which represents a limitation for the quantification of their role in this model.
The third TL is a crucial bottleneck to energy flows, a finding that supports the relevance of a wasp-waist structure in the ecosystem under investigation. Ecologically, a high flow of energy in the intermediate trophic level could have important implications for the stability and resilience of the ecosystem. For example, changes in the availability or productivity of species in the third TL could have cascading effects on the energy flow and dynamics of the entire food web (Cury, Reference Cury2000; Jordán, Reference Jordán2009). Other food webs, for example in the Mediterranean Sea (Coll et al., Reference Coll, Lotze and Romanuk2008), show much greater biodiversity and higher numbers of trophic groups in medium trophic levels compared to the Falkland Islands marine ecosystem. Given the relatively small number of species (among them P. ramsayi and D. gahi) within the third TL in the Falkland Shelf ecosystem compared to other ecosystems, we can consider both species as key components within the ecosystem (corroborated by their keystone index) that require careful management. Even though top predators like sharks and pinnipeds exert an important top-down control, and phytoplankton and zooplankton influence the ecosystem from the bottom-up perspective (e.g. due to nutrient availability in an upwelling area), middle-out controls can be seen in relation to D. gahi and P. ramsayi, which represent intermediate connections linking the bottom of the food chain to top predators. An example of this role could be found around 2005 to 2015, when the Falkland M. australis stock collapsed and, in response to it, the P. ramsayi stock increased dramatically (Laptikhovsky et al., Reference Laptikhovsky, Arkhipkin and Brickle2013) prior to experiencing a drastic decline. The stock size of P. ramsayi, although now recovering again, is still very small (93,000 t) compared to 2011 (885,000 t; Ramos and Winter, Reference Ramos and Winter2022a, Reference Ramos and Winter2022b), with future impacts not assessed yet. Myctophids and the Patagonian sprat Sprattus fuegensis might also play a very important role as abundant prey in the Patagonian Shelf LME (Montecinos et al., Reference Montecinos, Castro and Neira2016). However, due to the lack of data (no S. fuegensis could be sampled, probably because of the large mesh size used by fishing vessels) a sound estimate of their importance could not be achieved in this study.
The Falkland Shelf ecosystem and the South Brazil Bight ecosystem share some similarities in terms of structure and presence of keystone species. They display in fact a high productivity and host a small number of key species, which act as bottlenecks to energy circulation and play a critical role in maintaining the overall health and productivity of the ecosystem (Nascimento et al., Reference Nascimento, Velasco, Okey, Christensen and Z. Amaral2011; Nogueira and Brandini, Reference Nogueira, Brandini, Hoffmeyer, Sabatini, Brandini, Calliari and Santinelli2018). The Falkland Shelf ecosystem is characterized by complex hydrodynamics, including the Falkland Current and the Antarctic Circumpolar Current, resulting in upwelling nutrients and therefore high productivity (Vivier and Provost, Reference Vivier and Provost1999; Agnew, Reference Agnew2002; Belkin et al., Reference Belkin, Cornillon and Sherman2009; Matano et al., Reference Matano, Palma and Piola2010; van der Grient et al., Reference van der Grient, Morley, Arkhipkin, Bates, Baylis, Brewin, Harte, White and Brickle2023). In contrast, the South Brazil Bight ecosystem is a shelf area with wind-driven upwelling, especially during summer, which brings nutrient-rich water to the surface and sustains a high productivity (Castro, Reference Castro2014). Like the Falkland Shelf ecosystem, in the South Brazil Bight a loliginid squid species (Loligo plei) is considered a key species (Gasalla et al., Reference Gasalla, Rodrigues and Postuma2010). These squids are an important prey for many predators, including dolphins, seals, and seabirds, and also play an important role in the diet of many commercial fish species. Therefore, the loss of L. plei could have significant impacts on the overall productivity and health of the South Brazil Bight ecosystem (Gasalla et al., Reference Gasalla, Rodrigues and Postuma2010).
When comparing the food web structure of the marine Falkland Islands ecosystem with that of the marine ecosystems of the Antarctic, there are several notable differences. One significant difference is the food chain length. Food webs have typically a length between 3 and 4 (Pimm and Kitching, Reference Pimm and Kitching1987). Food chain length is important to understand resource availability, ecosystem stability, optimal diet choice of individuals, size relationships of prey to predators and size of the habitat area (Pimm, Reference Pimm1982; Pimm and Kitching, Reference Pimm and Kitching1987; Kondoh and Ninomiya, Reference Kondoh and Ninomiya2009). The food chain in Antarctic ecosystems is longer than in the Falkland Islands ecosystem (Stowasser et al., Reference Stowasser, Atkinson, McGill, Phillips, Collins and Pond2012). This could be a result of a higher proportion of top predators in the Antarctic ecosystems, such as killer whales, leopard seals and various species of birds, which feed on a variety of prey including krill, fish and squid. In contrast, the Falkland Islands ecosystem has a lower proportion of top predators, and the food chain tends to be shorter. Another difference is the control mechanisms of the food web. The Antarctic ecosystem is controlled by bottom-up forces, with the abundance of primary producers such as phytoplankton, sea ice algae and zooplankton (particularly Euphausia superba) driving food web dynamics (Hempel, Reference Hempel, Siegfried, Condy and Laws1985; Kerry and Hempel, Reference Kerry and Hempel1990). In contrast, the Falkland Islands ecosystem is more complex, with both top-down and bottom-up control mechanisms playing a role (Laptikhovsky et al., Reference Laptikhovsky, Arkhipkin and Brickle2013; van der Grient et al., Reference van der Grient, Morley, Arkhipkin, Bates, Baylis, Brewin, Harte, White and Brickle2023). While primary producers do play a significant role in the Falkland Islands ecosystem, the abundance of predators such as squids and fishes can also have an impact on food web functioning. Additionally, there are differences in the key species. In the Antarctic ecosystem, the Antarctic krill is a key species (Rau et al., Reference Rau, Hopkins and Torres1991) that serves as a primary food source for many predators in the ecosystem. In the Falkland Islands ecosystem, the loliginid squid Doryteuthis gahi is a key species due to its high abundance and significant impact on the food web.
Conclusion
In this study, we have demonstrated that stable isotopes and Ecopath can yield similar predictions of trophic levels. Furthermore, we found that the Falkland Shelf features many aspects of middle-out, wasp-waist dynamics besides the bottom-up and top-down mechanisms of control. We quantified the importance of both cohorts of D. gahi and squids in general within the Falkland Islands waters, but top predators such as pinnipeds and sharks still dominate food web dynamics and are essential for its functioning. Although the characterization of myctophids' role in the ecosystem requires further research, our findings on the ecosystem structure and functioning of the Falkland Island food web are useful and important steps towards planning for and incorporating an ecosystem-based fisheries management to ensure a sustainable use of resources on the Falkland Shelf. Effects on species in the third TL could cascade through the entire food web, and the relatively small number of species given within the third TL in the Falkland Shelf ecosystem, among them P. ramsayi and D. gahi, we can consider both species as key components that require careful management. The next step would be creating an Ecosim model based on the presented Ecopath model to simulate the impact of climate change and alternative fisheries management scenarios on the Falkland Shelf ecosystem.
Supplementary material
The supplementary material for this article can be found at https://doi.org/10.1017/S0025315423000887
Acknowledgements
We would like to thank the scientific fisheries observers of the Falkland Islands Fisheries Department for collecting samples. We would like to thank Verónica Iriarte for the seal and bird necropsies and samples. We would like to thank Rebecca Piontek for the collection and identification of zooplankton species, proof reading and general support during this project. The University of Vigo is to thank for supporting this PhD project.
The authors are grateful to Gaël Guillou and Gauthier Poiriez for their help with stable isotope analyses. Paco Bustamante is an honorary member of the IUF (Institut Universitaire de France). Further thanks go to Alastair Baylis for providing some biomass estimates of penguins and dolphins.
Author Contributions
Tobias Büring = Writing and reviewing, sample collection and processing, conceptualization, analysis; Jesse van der Grient = Conceptualization, writing and reviewing; Graham Pierce = Supervision, writing and reviewing; Francisco Rocha = Supervision; Jessica Jones = writing and reviewing, funding acquisition; Marco Scotti = writing and reviewing; Paco Bustamante = sample processing, writing and reviewing; Alexander Arkhipkin = writing and reviewing, supervision, funding acquisition, conceptualization
Financial Support
The Beauchene Ltd Fishing Company is to thank for partially sponsoring this study along with the Falkland Islands Fisheries Department. The Director of the Fisheries Department, Dr Andrea Clausen is to thank for supporting this research. The CPER (Contrat de Projet Etat-Région) and the FEDER (Fonds Européen de Développement Régional) are acknowledged for funding the IR-MS of LIENSs laboratory.
Marco Scotti received support from the German Federal Agency for Nature Conservation (BfN) with funds from the Federal Ministry of the Environment, Nature Conservation and Nuclear Safety (BMU), under grant agreement FKZ: 3521532201.
Competing interest
None.
Ethical Standards
Research Ethics comply with international standards and with law and regulations of the Falkland Islands. This project's research has Licence No: R12/2022.
Data availability
The Ecopath model will be freely available. Other data can be shared on request.


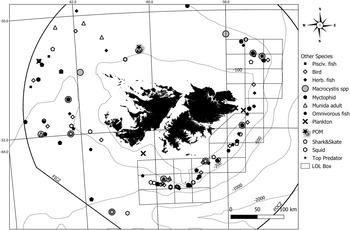

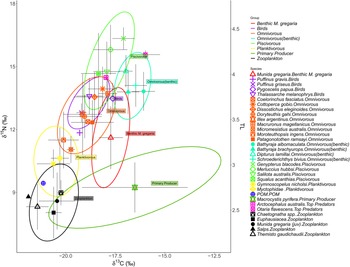


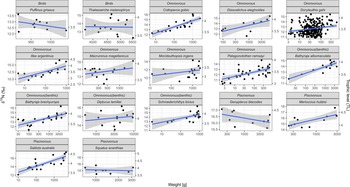


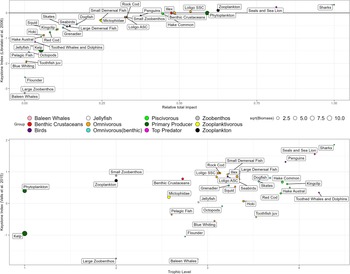


 Open access