

Healthy eating habits during childhood are a major factor in preventing health problems( 1 ) and improving cognitive ability and concentration( 1 , Reference Sorhaindo and Feinstein 2 ). Since dietary patterns acquired in childhood tend to persist in adulthood, it is essential to encourage healthy eating habits since early life( Reference Mikkila, Rasanen and Raitakari 3 ).
Social and economic changes affect population's eating habits. Rapid changes in the educational level, the reduced costs of most energy-dense foods, urbanisation and industrialisation partly explain the changes in eating patterns( Reference Popkin, Adair and Ng 4 , Reference Popkin 5 ). In particular, women's participation in the labour market, and the consequent lack of time to cook, increased the demand for catering services( Reference Chung, Popkin and Domino 6 , Reference Jabs and Devine 7 ). Thus, during the week, children spend most of their day out of home and consequently consume meals and snacks away from home( Reference Singer, Fuller and Keiley 8 ). Eating out of home has been related to poor diet quality and increased energy intake( Reference Mancino, Todd and Guthrie 9 – Reference Nago, Lachat and Huybregts 16 ). Furthermore, childcare has been associated with an increased overweight risk throughout childhood( Reference Gubbels, Kremers and Stafleu 17 – Reference Geoffroy, Power and Touchette 19 ).
In the United States, out-of-home consumption takes place mostly in fast food restaurants( Reference Lachat, Nago and Verstraeten 15 ). A study with American children aged 2–18 years( Reference Poti and Popkin 13 ) found that in 2006 the percentage of energy from fast food restaurants increased to surpass intake from schools and become the largest contributor to foods prepared away from home. In Europe, public catering (school and worksite canteens) seems to be the most important source of eating out( Reference Lachat, Nago and Verstraeten 15 ) and coffee/tea/waters and sweets are selectively consumed out of home by European adults( Reference Orfanos, Naska and Trichopoulos 20 ).
Out-of-home food consumption differs by age, region and eating location and need to be better defined. In a recent systematic review( Reference Lachat, Nago and Verstraeten 15 ), the conclusion was that eating out (including school) is an important risk factor for a higher energy intake and lower nutrient intake, but this finding is consistent only in adults but not in children. In a Spanish cohort of university graduates with a mean age of 37 years( Reference Bes-Rastrollo, Basterra-Gortari and Sanchez-Villegas 21 ), participants who ate more frequently away from home consumed less vegetables, fruits, legumes and low-fat dairy products and more soft drinks, juices, red meat, fast food and processed meat. In a study with Irish children aged 5–12 years( Reference Burke, McCarthy and O'Neill 22 ), fibre and micronutrient intakes were higher at home than at other locations. However, in a sample of Vietnamese adolescents( Reference Lachat, Le and Thi 23 ), soups and fruits featured as the most popular out-of-home foods and the energy density from out-of-home foods was lower compared to foods prepared at home. Furthermore, food at school differs across countries; it was characterised by a higher fibre content in the United States and a low diversity and vegetable content in Belgium( Reference Lachat, Nago and Verstraeten 15 ).
Information about eating out of home in children is scarce, especially in young European children. Thus, more studies are needed to estimate children's dietary intake according to the meal location and how it influences dietary adequacy, in order to develop appropriate public health strategies.
The present study aimed to assess dietary intake and dietary adequacy according to the eating location in preschool children.
Methods
Participants
This study included participants from the Generation XXI birth cohort described elsewhere( Reference Larsen, Kamper-Jorgensen and Adamson 24 ). A total of 8647 live born infants and their mothers were enrolled between April 2005 and August 2006 at all the public maternity units that cover six municipalities of the metropolitan area of Porto (Northern Portugal). These maternity units were responsible, at enrolment, for 91·6 % of the deliveries in the whole catchment population. Between April 2009 and April 2011, 7458 children (86·2 %) were re-evaluated: 5986 in face-to-face interviews and 1472 by telephone interview.
After confirming by phone that mothers accepted to participate in this follow-up, mothers received by post mail a 3 d food diary that should be returned during the face-to-face evaluation of children and subsequently a revision was made by the interviewers. For those mothers who forgot to bring the filled food diary, an extra 3 d food diary was provided to complete after the children's evaluation and return it by post. Only participants of face-to-face interviews were approached to fill a food diary and 3037 food diaries were returned, of which 544 were excluded because the diaries were incomplete or incorrectly filled, totalling 2493 complete food diaries. For the present analysis, only one of a pair of twins was randomly included (n 39) and children with 50 % or more of daily meals without information on eating location (n 40) were also excluded. Thus, the final sample included 2414 children, median age 51 (25th–75th percentiles 49–55) months, 1181 girls (48·9%), with a mean BMI of 16·2 (sd 1·8) kg/m2, a mean maternal age of 34·2 (sd 5·1) years and a mean maternal education of 11·5 (sd 4·2) years.
Ethics
This study was conducted according to the principles of the Declaration of Helsinki and all procedures involving human subjects were approved by the Ethics Committee of Hospital de São João/University of Porto Medical School and by the Portuguese Authority of Data Protection. Parents or legal tutors of each participant received an explanation on the purposes and design of the study, and gave written informed consent.
Data collection
Two questionnaires, one related to the child's health and the other to the mother's health, were applied by trained interviewers. Children and their mothers also had a physical examination that included anthropometric measurements. Dietary intake was measured by a 3 d food diary (2 weekdays and 1 weekend day) filled by the mother and/or father and/or other main caregiver, recording the day, time and location for each eating occasion in an open table. Oral and written instructions were given for the correct filling of food diaries and for the quantification of food portions. Participants should describe all foods and beverages consumed (reporting the trade name if applicable) and the amount (in grams, units or household measures). When children ate out of home without parents, the specific eating occasion should be reported by the caregiver. In relation to the prepared dishes, instructions were given to provide recipe details, including ingredients and methods of preparation.
The codification process of the food diaries was conducted by a team of trained nutritionists, using a food coding manual for children previously developed at the Department of Clinical Epidemiology, Predictive Medicine and Public Health, University of Porto Medical School. To convert foods into nutrients, the software Food Processor SQL version (2004–5 ESHA Research, Salem, Oregon, USA) was used, which is based on the Food Composition Table of the United States of America Department of Agriculture( 25 ). For typically Portuguese foods or culinary dishes, new codes were created with national nutritional information, as previously described( Reference Lopes 26 , Reference Lopes, Aro and Azevedo 27 ). For some dishes, nutritional information of final products could not be obtained; therefore, the information of the ingredients that made up the recipe was used. Food and beverages were further grouped according to Table 1 (foods eaten by very few children were not analysed), and the recipes were disaggregated so that their ingredients were also included into food groups.
Grouping of foods and beverages used in eating location analyses' and used in the dietary adequacy index

Definition of eating location and meals
For each eating and drinking occasion recorded in the food diaries, the eating location was reported. Thus, eating location was defined by the place where food or beverages were consumed, independently of the place of food preparation. Different eating locations were grouped into seven categories: home, grandparent's home, other relatives or friend's home, preschool, babysitter's home, restaurants/coffee shops and others (for example, at the cinema, in the car, in the street).
Based on the type of food consumed and the time of consumption, six types of meals were defined, independently of the energy content: breakfast, morning snack, lunch, afternoon snack, dinner and evening snack. When there was more than one meal of the same type in different locations, the chosen location was where energy intake was higher. For example, if a child ate an afternoon snack at preschool and another at grandparents' home (on the same day), the eating occasion chosen was the one with higher energy intake.
Definition of groups of children according to eating location
Children were split into four groups defined according to eating location (Table 2): ‘Home’ ( ≥ 80 % of meals at home); ‘Other homes’ ( < 80 % of meals at home and the remaining ones mainly at grandparent's home, other relatives or friend's homes or babysitter's home – 36·8 %); ‘Preschool’ ( < 80 % of meals at home and the remaining ones mainly at preschool − 31·9 %) and ‘Restaurants’ ( < 80 % of meals at home and the remaining ones mainly at restaurants/coffee shops or other places out of home – 25·9 %).
Distribution of individuals by eating location groups and mean percentage of meals consumed at each location (Mean values, standard deviations, number of subjects and percentages)
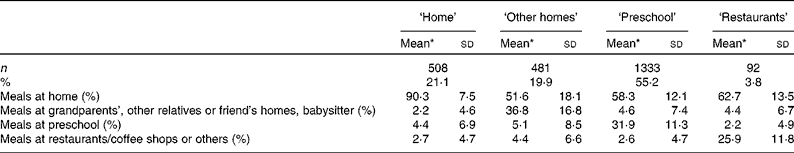
* Does not sum 100 % due to missing data on eating locations.
Dietary adequacy index
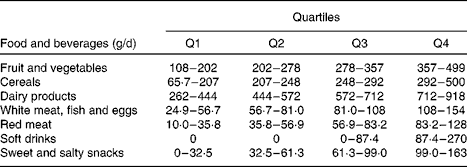
A dietary adequacy index was developed based on dietary recommendations for this age group( 28 , Reference Nicklas and Johnson 29 ), including foods and beverages (Table 1) but not nutrients. The index is composed of seven food groups for which quartiles of consumption were calculated and a score from 1 to 4 was allocated to each (Table 3). For children in the lowest quartile of consumption of the ‘healthy foods’ (fruit and vegetables; cereals; dairy products; white meat, fish and eggs), a score of 1 was attributed; to children in the quartile of intermediate consumption of these foods a score of 2 or 3 was attributed; and to children in the highest quartile it was attributed a score of 4. For the other food groups (red meat; soft drinks; sweet and salty snacks) a decreasing score was attributed when consumption increased. For the ‘soft drinks’ group, the first two quartiles show no consumption, so the children of both quartiles were scored with 1 and no one was scored with 2 points. The final score may vary from 7 to 28 and a higher score represents better dietary adequacy.
Distribution of food groups consumption, included in the dietary adequacy index, according to quartiles
Statistical analysis
The comparison of mean daily intake of energy, macronutrients, micronutrients and foods according to eating location groups was performed using ANOVA. ANCOVA was used to adjust for potential confounders: child's energy intake, sex and BMI, and maternal age and education. Bonferroni correction for multiple comparisons was applied.
Data analysis was performed using R® 3.0.1 (2013) statistical software and SPSS® 20.0 software (SPSS, Inc., 2011). A significance level of P< 0·05 was considered in all analyses.
Results
Most of the meals were consumed at home (63·5 %), followed by the preschool (19·8 %) and grandparents' home (9·3 %). In other locations, a smaller number of eating occasions were made: 2·7 % in restaurants/coffee shops, 0·9 % in babysitter's home, 0·9 % in other relatives or friend's home and 2·9 % in other places out of home. Most children were classified into ‘Preschool’ group (55·2 %), followed by ‘Home’ (21·1 %), ‘Other Homes’ (19·9 %) and ‘Restaurants’ (3·8 %) (Table 2).
Table 4 presented the crude and adjusted mean daily intake of energy, macronutrients, fibre and caffeine according to eating location groups. Groups ‘Preschool’ and ‘Restaurants’ were those presenting higher differences in intake. In multivariate analysis, ‘Preschool’ was characterised by a significantly higher energy and fibre intake and a lower intake of total fat compared with the other three groups. Group ‘Restaurants’ was distinguished from the other groups by presenting significantly lower protein intake and higher intake of saturated fat and caffeine. Group ‘Home’ revealed no statistical significant differences in overall intake from the group ‘Other homes’. The intake of sugars, polyunsaturated fat and n-6:n-3 ratio was not different between groups.
Daily intake of energy, macronutrients and other dietary components, according to eating location groups (Mean values and 95 % confidence intervals)

* Mean value was significantly different from that for ‘preschool’ (P< 0·05).
† Mean value was significantly different from that for ‘home’ (P< 0·05).
‡ Mean value was significantly different from that for ‘other homes’ (P< 0·05).
§ Mean value was significantly different from that for ‘restaurants’ (P< 0·05).
∥ Means adjusted to child's energy intake, sex and BMI, and maternal age and education (years).
Regarding micronutrients, ‘Preschool’ and ‘Restaurants’ were those groups with the highest significant differences in intake (Table 5). In multivariate analysis, ‘Preschool’ was characterised by a significant higher intake of Na than ‘Home’ and ‘Other homes’, and a higher intake of Mg than ‘Restaurants’. ‘Restaurants’ had a lower intake of phosphorus than ‘Home’ and ‘Other homes’, a lower intake of Ca than ‘Other homes’. ‘Home’ showed no significant differences in micronutrients intake compared to ‘Other homes’. In addition, there were no significant differences between groups in the intake of folate, vitamin C, vitamin A and Fe.
Mean daily intake of selected micronutrients according to eating location groups (Mean values and 95 % confidence intervals)

* Statistical significant difference with group ‘preschool’ (P< 0·05).
† Statistical significant difference with group ‘home’ (P< 0·05).
‡ Statistical significant difference with group ‘other homes’ (P< 0·05).
§ Statistical significant difference with group ‘restaurants’ (P< 0·05).
∥ Means adjusted to child's energy intake, sex and BMI, and maternal age and education (years).
¶ Intrinsic Na plus Na estimation for cooking.
The mean intake of food groups according to eating location groups was shown in Table 6. In multivariate analysis, ‘Preschool’ was characterised by a higher consumption of vegetables and bread/breakfast cereals than all the other groups; a higher fruit intake than ‘Home’ and ‘Restaurants’; higher fish but lower meat intake than ‘Home’ and ‘Other homes’; and higher consumption of fats/oils but lower of soft drinks than ‘Other homes’ and ‘Restaurants’.
Mean weight of each food group consumed between different eating location groups (Mean values and 95 % confidence intervals)

* Statistical significant difference with group ‘preschool’ (P< 0·05).
† Statistical significant difference with group ‘restaurants’ (P< 0·05).
‡ Statistical significant difference with group ‘home’ (P< 0·05).
§ Statistical significant difference with group ‘other homes’ (P< 0·05).
∥ Means adjusted to child's energy intake, sex and BMI, and maternal age and education (years).
Group ‘Restaurants’ was characterised by a higher consumption of cakes, salty snacks, soft drinks and fruit juices than ‘Home’ and ‘Preschool’; and a lower consumption of pasta/rice/potatoes and dairy products than the other groups.
Group ‘Home’ showed no significant differences in food consumption comparing to ‘Other homes’. No significant differences of sugar and confectionery consumption were also observed between eating location groups.
The mean score of the dietary adequacy index according to eating location groups could be observed in Table 7. In multivariate analysis, children in group ‘Restaurants’ had lower mean scores than children in the other groups and group ‘Preschool’ had a higher mean score in the dietary adequacy index compared with the other groups.
Mean score of the dietary adequacy index according to eating location groups (Mean values and 95 % confidence intervals)
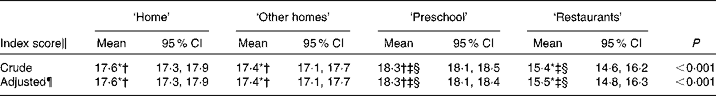
* Statistical significant difference with group ‘preschool’ (P< 0·05).
† Statistical significant difference with group ‘restaurants’ (P< 0·05).
‡ Statistical significant difference with group ‘home’ (P< 0·05).
§ Statistical significant difference with group ‘other homes’ (P< 0·05).
∥ Index score range from 7 to 28.
¶ Means adjusted to child's energy intake, sex and BMI, and maternal age and education (years).
Discussion
The results of this study show that preschool children who have more meals at preschool setting (‘Preschool’ group) present a mean daily energy intake of healthy foods such as vegetables, fruit, cereals and fish, and a global better dietary adequacy, compared to other groups. These findings were reflected in the differences found in nutrient intake between the groups: more intake of carbohydrates and fibre and less fat intake, corresponding to less saturated and monounsaturated fat and cholesterol.
Comparing childcare with home, other studies found a lower frequency of consumption of salty snacks in the afternoon snack( Reference Ziegler, Briefel and Ponza 30 ) and a higher intake of vegetables and lower intake of sweet pastry at childcare( Reference Lehtisalo, Erkkola and Tapanainen 31 ). A study with 1- to 3-year-old Dutch children( Reference Gubbels, Raaijmakers and Gerards 32 ) described that although children consumed similar amounts of energy both at home and at childcare, they consumed most of their fruit and sweet snacks at childcare and most of their vegetables at home. In a systematic review( Reference Lachat, Nago and Verstraeten 15 ), four studies showed no differences in total energy intake per d between eating out and eating at home in children, and only one study described a greater total energy intake associated with eating out. In a study with Sweden children aged 4–6 years( Reference Sepp, Lennernas and Pettersson 33 ), no differences were found in nutrient density (including macro- and micronutrients) between preschool and home diet except for dietary fibre and fat, higher at preschool, and carbohydrate and sugar intake, higher at home.
In the present study, higher Na intake in the ‘Preschool’ group seems contradictory, due to the lower consumption of salty snacks. However, it may be explained by a possible higher intake of soup and bread, foods that contribute more to Na intake among adult population of Porto( Reference Lopes, Oliveira and Santos 34 ), and in a study with Portuguese adolescents( Reference Araujo, Severo and Lopes 35 ), starchy foods were identified as the major food source of Na intake. Na intake is usually underestimated when assessed by dietary reporting methods( Reference Robare, Milas and Bayles 36 ), so the consumption of Na could be even higher. However, the possible non-differential bias on estimation does not compromise the comparison between groups.
Children belonging to the group ‘Restaurants’ had a higher intake of salty snacks, cakes, soft drinks and fruit juices, a lower intake of vegetables and dairy products as well as lower intake of some micronutrients (Mg, phosphorus and Ca). In a study with Irish children aged 5–12 years( Reference Burke, McCarthy and O'Neill 22 ), fibre and micronutrient intakes were significantly higher at home compared to the other locations (except school). Among sixteen food groups analysed, only the intake of poultry, game and meat products were higher outside home than at home.
A higher intake of caffeine in group ‘Restaurants’ compared to all other groups could be explained by the higher consumption of soft drinks observed in this group. Soft drinks are one of the groups that most contribute to caffeine consumption in children( Reference Ellison, Singer and Moore 37 , Reference Heckman, Weil and de Mejia 38 ), and have also been described as the major source of caffeine in a cohort of Portuguese adolescents aged 13 years( Reference Lodato, Araujo and Barros 39 ).
Comparisons between studies are particularly difficult due to methodological differences: analysis of food service sector as a whole v. a particular element of food service sector; analysis of a whole day or meals at the same day; different data collection methods; different age categories used; different definitions of out-of-home consumption. Relating to this last point, the HECTOR project – Eating Out: Habits, Determinants and Recommendations for Consumers and the European Catering Sector( Reference Orfanos, Naska and Gedrich 40 ) – recommends the use of the criterion ‘where the food/beverage was prepared’, that is, the definition of eating out should include all foods that are not cooked at home. Some studies based their definition on the place where the food is prepared or obtained( Reference Burke, McCarthy and O'Neill 22 , Reference Burns, Jackson and Gibbons 41 ) but others( Reference Orfanos, Naska and Trichopoulos 20 , Reference Bes-Rastrollo, Basterra-Gortari and Sanchez-Villegas 21 , Reference Kearney, Hulshof and Gibney 42 ), such as the present study, based the definition on where the food was consumed, regardless of the place of preparation.
To assess dietary adequacy between the different groups, a dietary adequacy index was developed, in which a higher score indicates a more appropriate overall food consumption. Even after adjustment for potential confounders, children in group ‘Preschool’ obtained a higher score than children from the other groups, that is, children in group ‘Preschool’ had a better dietary quality, according to this index. Moreover, children in group ‘Restaurants’ showed a lower score than all the other groups, which suggests that a higher frequency of consumption in restaurants/coffee shops or other places outside home contributes to a less healthy diet. In the study mentioned earlier( Reference Ziegler, Briefel and Ponza 30 ) with toddlers aged 15–24 months, the most eaten food in lunches away from home were French fries; soft drinks were more consumed away from home than at home or at day care. In a study with American children aged 6–12 years( Reference Mancino, Todd and Guthrie 9 ), whose diet quality was assessed by the Healthy Eating Index 2005, consumption outside home (excluding school) had a negative effect on this index score due to a lower consumption of fruit, vegetables and whole grains and a higher consumption of fat, saturated fat, sugars and Na. The effect of meals from school on diet quality, in younger children, did not differ from the effect of meals from home.
The use of this dietary adequacy index had some limitations. There are a wide variety of quality indexes and many arbitrary choices involved in the development of an index since the methodology used to develop them has not been completely clarified( Reference Waijers, Feskens and Ocke 43 ). There is no consensus about which foods should be included in diet quality indexes; for example, some indexes do not include unhealthy foods. However, the use of the index enables to summarise data related to food and nutrient intake between the different eating location groups. To test the index performance, we compared nutrient's intake after divided children into two groups (through median score of 18) and children with higher index scores had a significant higher mean intake of protein, fibre, vitamin C, vitamin A, folate, Mg, phosphorus, Na and Ca, and had a lower mean intake of caffeine and fat (data not shown).
The a priori definition of eating location groups could be discussed. Our theoretical assumption was to assume a cut-off point that allows us to compare those who mostly eat at home with others with a distribution by other locations, since most of meals were performed, as expected, at home. This cut-off point was based on the fact that we evaluated 3 d, 2 weekdays and 1 weekend day, and these children normally do six meals a day and the most common is lunch and one of the snacks at school, on average four school meals (2 weekdays) in eighteen total meals, which results in about 20 %, 80 % at home.
In the present study, dietary intake was evaluated through 3 d food diaries. Food diaries have been described as the most suitable method of intake assessment at the individual level, particularly in children( Reference Serra Majem and Aranceta 44 ). Nonetheless, the use of food diaries led to a substantial loss of data due to study low participation proportion. A high number of food diaries were not delivered, were delivered incomplete or incorrectly filled, which represents a methodological disadvantage of the use of food diaries( Reference Biro, Hulshof and Ovesen 45 ). However, no significant differences were found for child's sex and BMI and maternal age and education between the sample in the present study and the remaining cohort.
An additional constraint was the difficulty in estimating food portions, when no photo manual or scales were available. However, instructions were given to parents to weigh foods whenever possible, record the weight of the package or describe portions using household measures. When the caregivers did not indicate the portion size or when a food or beverage did not have a standard portion, a mean portion size, previously defined and described in the coding manual for children's consumption, was assumed.
To increase the quality of dietary assessment, instructions were given to parents to give the food diary to the caregiver (e.g. teacher at preschool or grandparents) when children did not eat at home. However, information on who filled the food diary was not registered, which is another limitation of the study.
Analysing food consumption by eating location and not just outside/inside home has the advantage of providing a better understanding of out-of-home consumption and enables subsequent specific interventions for foodservices in the institutional sector (especially in schools) and in the commercial sector. The analysis by eating location groups minimises the error of the association of certain foods to specific meals, which is a further strength of this study. The usual analysis of eating location does not have into account the possibility of confounding by the type of meal. For example, meals that were eaten substantially at preschool were always morning snacks, lunch or afternoon snacks. So they cannot measure if the effect is of the type of meal or eating location.
A further strength of this study is the inclusion of foods and beverages and not only nutrients. Finally, this study is part of a population-based cohort study with a large sample size, led by an experienced team, which contributes to minimise bias and supports the validity of the results.
In conclusion, preschool setting seems to contribute to a higher intake of nutrient-dense foods and a reduced consumption of energy-dense foods. However, a higher salt intake was also observed compared with the other eating locations. By contrast, the consumption in restaurants/coffee shops and other locations outside home seems to contribute to energy-dense food intake and reduced consumption of nutrient-dense foods. Consumption at parent's home did not differ from consumption at other homes, and when compared with preschool, it was associated with a lower intake of vegetables, fruit, bread, fish and higher intake of meat.
These findings may suggest some health policies implications such as the need of reducing salt in dishes, namely in soups at preschools. Schools have the potentiality to create an environment where healthy nutrition and behaviour are promoted, influencing the availability of certain foods and teaching about healthy nutrition. Our findings also suggest the need to encourage parents and other caregivers to offer more fruit and vegetables to their child at home and try to make healthier choices when eating at restaurants or coffee shops.
Acknowledgements
The authors gratefully acknowledge the families enrolled in Generation XXI for their kindness, all members of the research team for their enthusiasm and perseverance and the participating hospitals and their staff for their help and support.
Generation XXI was funded by Programa Operacional de Saúde – Saúde XXI, Quadro Comunitário de Apoio III and Administração Regional de Saúde Norte (Regional Department of Ministry of Health). It has support from the Portuguese Foundation for Science and Technology (FCT – PTDC/SAU-ESA/108577/2008), through FEDER from the Operational Programme Factors of Competitiveness – COMPETE and from the Calouste Gulbenkian Foundation. These funders had no role in the design, analysis or writing of this article.
The authors' contributions are as follows: T. M. was responsible for the analysis and interpretation of the data and wrote the first draft of the paper; M. S. was also responsible for the analysis of the data and A. O., E. R., S. R. and C. L. were also responsible for the interpretation of the data. T. M. and C. L. contributed to the concept and design of the study and all authors contributed to paper review.
None of the authors has a conflict of interest.


