

Introduction
Houses of worship have long been involved in disaster response and recovery (Bradfield, Wylie, and Echterling Reference Bradfield, Lou Wylie and Echterling1989; Elliott and Webb Reference Elliott and Webb2023; Gaillard and Texier Reference Gaillard and Texier2010; Gazley et al. Reference Gazley, Fulton, Mlsna Zebrowski and King2022; Sheikhi et al. Reference Sheikhi, Seyedin, Qanizadeh and Jahangiri2021; Shinn and Caretta Reference Shinn and Angela Caretta2020). For example, in the United States, congregations were host sites for the COVID-19 vaccine rollout (Portnoy Reference Portnoy2021), and they are routinely involved with sheltering, food distribution, debris removal, rebuilding, mental health counseling, and other response and recovery functions after natural disasters (De Vita et al. Reference De Vita, Kramer, Lauren Eyster, Kehayova and Triplett2008; Elliott and Webb Reference Elliott and Webb2023; Gazley et al. Reference Gazley, Fulton, Mlsna Zebrowski and King2022; Shinn and Caretta Reference Shinn and Angela Caretta2020). Beyond the initial response, congregations reach uniquely vulnerable communities (Rivera Reference Rivera2018; Rivera and Nickels Reference Rivera and Nickels2014), stay connected with communities after other aid groups have left (Phillips Reference Phillips2013), and fill the gaps left by under-resourced and overstressed response and recovery efforts (Adams Reference Adams2013; Meyer et al. Reference Meyer, Carlee Purdum, Haley Yelle, Rodriguez, Romero and Anderson Taylor2023). Like other service sectors (Cnaan Reference Cnaan2002), disaster response and recovery in the United States relies on houses of worship.
While houses of worship (HOWs) are often places of refuge after the storm, the organizations themselves can be victims. Like any other business or not-for-profit organization, physical property is vulnerable to natural hazards, staff and volunteers may be unable to return to work, and income streams may be disrupted if the congregation cannot meet. Concurrently, climate change is a threat multiplier for the natural hazards already facing many communities (Climate Trends 2023). Other sectors, including insurance companies working with HOWs (Poirier Reference Poirier2020, Reference Poirier2022), are already factoring in the threat from climate change. Given their role in community resiliency and the evolving threats from climate change, are houses of worship ready to be houses of refuge? Are the organizations resilient and ready for a disaster themselves? More specifically, is concern about climate and evolving risks leading clergy to improve congregational disaster readiness?
To answer these questions, this analysis draws on data from a nationwide survey of Protestant Christian clergy in 2019 with a total of 184 completed responses (Pudlo Reference Pudlo2023b). The survey contains baseline questions about disaster readiness along with the Six Americas Super Short Survey (SASSY) climate concern measure from the Yale Program on Climate Change Communication (Chryst et al. Reference Chryst, Jennifer Marlon, Leiserowitz, Maibach and Roser-Renouf2018). This combination makes the survey unique since it is one of the few to ask clergy about both disaster preparedness and climate concern. The paper tests a hypothesis proposing that “an increase in climate concern by leaders is positively associated with an increase in organizational disaster preparedness.” A corollary question asks, “how does climate concern effect the information, planning, and action items associated with disaster preparedness?” The analysis fails to reject the null, and the results suggest that climate concern has not yet affected how clergy assess natural hazard risks, nor how their organizations prepare for disaster. Instead, the top drivers of disaster planning remain organizational or experiential factors (Pudlo Reference Pudlo2023a). Failing to reject the null is still insightful (Alrababa’h et al. Reference Alrababa’h, Scott Williamson, Jens Hainmueller, Hotard, Laitin, Lawrence and Weinstein2023), and the paper concludes with some possible explanations and next steps.
Literature review
A growing body of research explores disaster readiness at the level of individual nonprofit organizations (Chikoto, Sadiq, and Fordyce Reference Chikoto, Sadiq and Fordyce2013; Ritchie, Tierney, and Gilbert Reference Ritchie, Tierney, Gilbert, Miller and Rivera2011) and houses of worship (Muller et al. Reference Muller, Burke, Berg, Lin and Upperman2014; Pudlo Reference Pudlo2023a). These studies show that organizational capacity or past disaster experience are often the best predictors of disaster preparation (Sadiq and Graham Reference Sadiq and Graham2016). To help with comparability, this analysis uses similar measures of preparation for the dependent variable and measures of capacity as control variables as described in the methods section. Less work has examined the roles of leaders in driving organizational readiness.
To pull in clergy, this analysis draws on several key backgrounds: first, clergy are understood to be entrepreneurial or transformational leaders. Second, leaders in other sectors have already included climate change in their organizational reliance and disaster readiness planning. These backgrounds are briefly described below.
Clergy as organizational leaders
Clergy occupy a unique space in the leadership of their organizations. Congregations are often structured like other nonprofits, borrow from business principles for management, and fill gaps in public service delivery (Cnaan Reference Cnaan2002; Ebaugh et al. Reference Ebaugh, Pipes, Saltzman Chafetz and Daniels2003). Yet, distinct from other leaders, clergy lead both a religious and an administrative organization. This parallel structure can give clergy outsized influence over otherwise mundane decisions (Chaves Reference Chaves1993; Hinings and Raynard Reference Hinings, Raynard, Tracey, Phillips and Lounsbury2014). This power is not limitless, and clergy may fail to act due to pressure from within the congregation or when pressed by higher-up leadership (Djupe and Gilbert Reference Djupe and Gilbert2008; Neiheisel and Djupe Reference Neiheisel and Djupe2008).
Reframing these powers and pressures, clergy are similar to street-level policy entrepreneurs (Arnold Reference Arnold2021; Cohen and Aviram Reference Cohen and Aviram2021). In an environment of constrained resources and competing pressures from clients (congregants) and superiors (boards or denominations), clergy can lead change through their agenda-setting or implementation powers. Disaster readiness seems like an area where clergy would have considerable sway given their leadership roles in congregations.
Connecting climate concern and disaster readiness
Disaster researchers are concerned about the dangers posed by climate change (O’Brien et al. Reference O’Brien, Phil O’Keefe and Wisner2006) and how increasing environmental risks interact with existing vulnerabilities (Crow and Albright Reference Crow and Albright2021; Mileti Reference Mileti1999; Tierney Reference Tierney2014). They are not alone. Earth scientists warn about expanding risks (Fifth National Climate Assessment 2023), the US military has a long-standing climate roadmap (Climate Change Adaptation Roadmap 2014), insurance companies are increasing prices and reducing coverages (for example, Brown Reference Brown2024; Kousky Reference Kousky2022), and attribution science has shown clear links between climate change and disaster intensity (van Oldenborgh et al. Reference van Oldenborgh, Karin van der Wiel, Sjoukje Philip and Robert Vautard2021). Leaders in key sectors of society have connected climate change to disaster risk, but have the clergy?
Communities of faith can be mobilized for disaster readiness through their broader religious beliefs, such as care for neighbors or creation (Luetz and Nunn Reference Luetz, Nunn and Leal Filho2020; Wisner Reference Wisner2010). However, proving that climate change beliefs influence disaster readiness is more difficult. Religious influences on climate change beliefs vary widely (Jenkins, Berry, and Kreider Reference Jenkins, Berry and Beck Kreider2018; Pudlo Reference Pudlo2019; Veldman et al. Reference Veldman, Wald, Mills and Peterson2021; The Faith Factor in Climate Change: How Religion Impacts American Attitudes on Climate and Environmental Policy 2023). Scholars debate the role of theology (Berry Reference Berry2013; Guth et al. Reference Guth, Green, Kellstedt and Smidt1995; Taylor Reference Taylor2016; Taylor, Van Wieren, and Zaleha Reference Taylor, Van Wieren and Zaleha2016), political ideology (Danielsen Reference Danielsen2013;Rivera-Kientz and Stewart Reference Rivera-Kientz and Stewart2024), scientific literacy (Roos Reference Roos2014; Stoutenborough and Vedlitz Reference Stoutenborough and Vedlitz2014), and others. Further complications emerge due to varying measurements of climate concern (Earls Reference Earls2020; Funk and Hefferon Reference Funk and Hefferon2019; Jones, Cox, and Navarro-Rivera Reference Jones, Cox and Navarro-Rivera2014). This paper uses the Six Americas Super Short Survey (SASSY) tool developed by the Yale Program on Climate Change Communication to measure climate concern. The four-question tool sorts respondents into one of six categories from dismissive to alarmed (Chryst et al. Reference Chryst, Jennifer Marlon, Leiserowitz, Maibach and Roser-Renouf2018; Maibach et al. Reference Maibach, Leiserowitz, Roser-Renouf and Mertz2011). It is the expectation of this analysis that clergy will make the connection between climate and disaster, like leaders in other sectors. As a result, clergy with higher climate concern should also increase the disaster readiness activities of their congregations.
Question, data, and method
Hypothesis: An increase in climate concern by leaders is positively associated with an increase in organizational disaster preparedness.
Corollary Question: How does climate concern affect the information, planning, and action items associated with disaster preparedness?
The data used to test the hypothesis and answer the corollary question are from a nationwide survey of Protestant clergy in the late summer of 2019 (Pudlo Reference Pudlo2023b). Invitations were emailed to the LifeWay Research Pastor Panel, followed by two reminders. The probability sample of Protestant churches was created through phone recruiting by LifeWay Research using random samples from all Protestant churches. Pastors who agree to be contacted by email for future surveys make up this LifeWay Research Pastor Panel. While geographically diverse, the sample is entirely Protestant, and around 90% identify as White-majority congregations. The full survey has a sample of 346 respondents, but only 185 clergy fully completed both the SASSY and disaster questions. Data are analyzed using descriptive analysis and Ordinary Least Squares (OLS) regression analysis. A quick note on terms: HOWs, congregations, and churches are used interchangeably due to the sample being entirely Protestant churches.
Description of variables
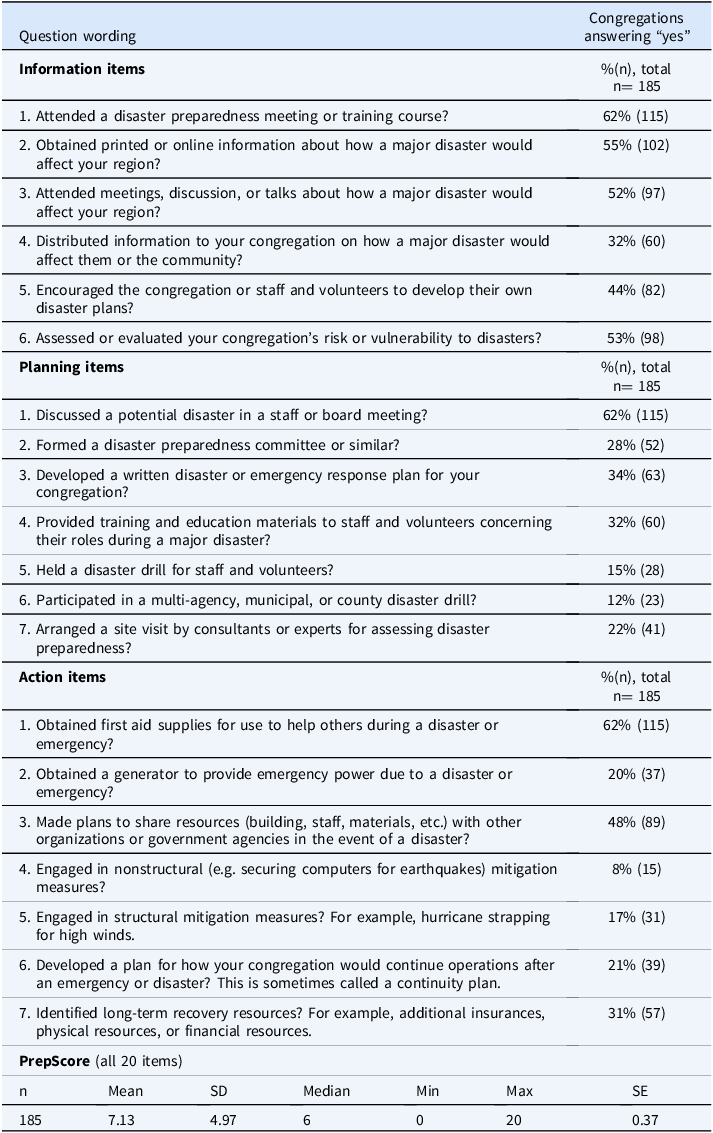
The dependent variable is organizational disaster preparedness. Preparedness is measured using a score of 20 items ranging from low-cost planning activities to expensive physical mitigation called PrepScore. Items are based on prior studies about not-for-profit organizational disaster readiness (Chikoto-Schultz et al. Reference Chikoto-Schultz, Russo, Manson and White2018; Ritchie, Tierney, and Gilbert Reference Ritchie, Tierney, Gilbert, Miller and Rivera2011). Preparedness items are coded as yes/no and items are categorized into one of three categories: information, planning, and action. Combining all three categories into PrepScore, the mean congregation completed seven items, and the median congregation completed six items. Table 1 displays item wording and summary statistics. Of note, insurance is not included in PrepScore since some insurances are required as a condition for operations and may not reflect agency on the part of the congregation.
PrepScore item wording and summary statistics

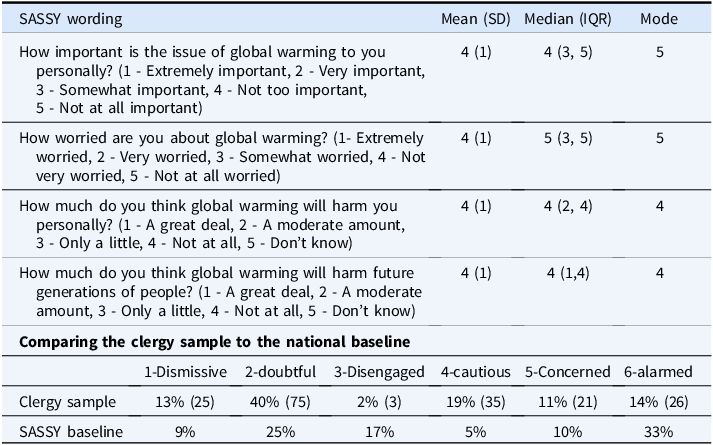
Comparing climate concern by clergy to the US National Baseline

The independent variable of climate concern is measured using the SASSY instrument. SASSY is an audience segmentation tool using four questions that divide respondents into one of six categories or audiences ranging from dismissive to alarmed about climate change (Chryst et al. Reference Chryst, Jennifer Marlon, Leiserowitz, Maibach and Roser-Renouf2018; Maibach et al. Reference Maibach, Leiserowitz, Roser-Renouf and Mertz2011). The original survey responses from this project were loaded into the SASSY group scoring tool for sorting into the SASSY audiences.1 Then the audiences were recoded into an ordinal variable where each category was assigned a numerical value to allow for regression analysis. “Dismissive” is given the lowest value at 1, and “alarmed” is assigned the highest value at 6, with “doubtful,” “disengaged,” “cautious,” and “concerned” filling out the rest of the variable. Table 2 provides question wording and compares the clergy in the survey to the national baseline from the same time period. The single biggest group in the clergy survey is doubtful at 40%, whereas alarmed is the highest audience at 33% in the national baseline.
Further exploring the SASSY independent variable, Figure 1 displays a quick regression predicting clergy climate concern by demographic variables. In the coefficient plot, higher levels of education are positively associated with higher climate concern. On the other hand, clergy who self-identify as Republican or Born Again score lower on the SASSY. The pattern is similar to the lower climate concern found in some previous studies (Jones et al. Reference Jones, Cox and Navarro-Rivera2014; Leiserowitz et al. Reference Leiserowitz, Maibach Edward, Geoff and Seth2015) but stands in contrast to a LifeWay study from 2019 showing relatively high agreement with anthropogenic global warming (Earls Reference Earls2020). Age, level of religious training, or race seem to have no effect on SASSY.
Regression coefficient plot displaying higher climate concern (SASSY) predicted by clergy demographics. Model statistics: Residual standard error: 1.42 on 178 degrees of freedom, multiple R-squared: 0.314, adjusted R-squared: 0.2908, F-statistic: 13.58 on 6 and 178 DF, p-value: 1.153e-12. A priori power analysis with significance criteria at 0.05 and power of 0.80 suggests a minimum sample n=90 to detect a medium effect.

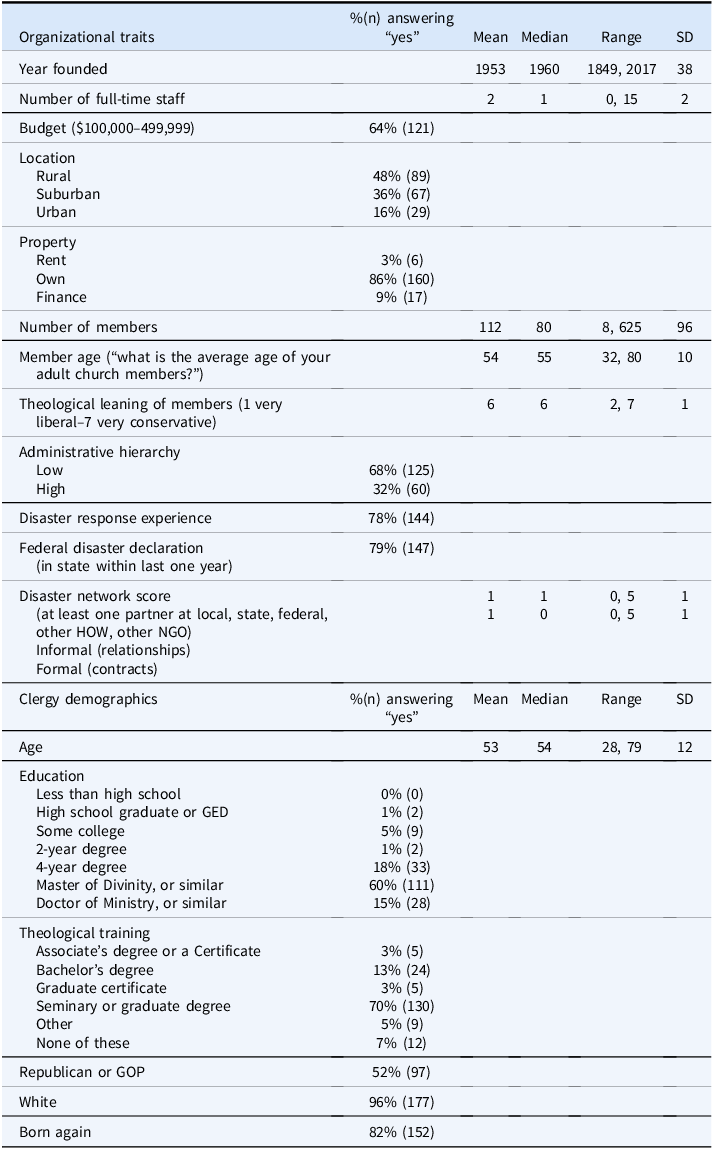
Control variables based on alternative explanations for disaster preparedness include organizational traits indicating capacity, experience, and structure, along with clergy demographics. Briefly summaries, organizational traits such as staff size, budget, location, or similar, indicate the resource capacity of the congregations. While a small sample, the HOWs in this study are similar to those in the National Congregations Study (NCS) national baseline study (Chaves, Hawkins, et al. Reference Chaves, Roso, Holleman and Hawkins2020). Congregations in this study are usually under 100 members, with a budget under $500,000, and just one full-time paid employee. All congregations in the study are Protestant Christian, over 80% of clergy believe their congregations are theologically conservative, and around 90% of congregations are majority White. The sample is nationwide, but 48% are in a rural location, 36% in a suburban location, and 16% in an urban location.
Past experience is a common predictor of disaster preparedness. Around 78% of congregations had prior experience with disaster relief of some kind. This is a little higher than the two-thirds of congregations that reported responding to a natural disaster during 2018 and 2019 in the NCS (Chaves et al. Reference Chaves, Roso, Holleman and Hawkins2020). Geographically, 79% of the congregations are located in states that received a federal disaster declaration within the last year. Due to the wide geographic spread of disasters, a regional dummy variable is not used in the analysis. During a response, many congregations build networks (Pudlo Reference Pudlo2023a). In this analysis, formal networks are contractual relationships with disaster partners from state, local, federal, and other HOWs and not-for-profit organizations. Informal networks are any kind of non-contractual relationship with these same partners.
HOWs use a variety of administrative and hierarchical structures, which are complicated by the dual religious and administrative systems of congregations (Chaves Reference Chaves1993; Hinings and Raynard Reference Hinings, Raynard, Tracey, Phillips and Lounsbury2014) and the challenges in defining “evangelicals” (Burge and Lewis Reference Burge and Lewis Andrew2018; Hackett and Lindsay Reference Hackett and Michael2008). For this project, the categories of high hierarchy or low hierarchy are based on the power of leaders outside the local congregation. Catholic, Episcopal, Lutheran, Methodist, and Presbyterian and similar are classified as high hierarchy, while Assemblies of God, Baptist, and non-denominational are low hierarchy. Around 32% of HOWs are high hierarchy, while 68% are low hierarchy. Hierarchy is not a proxy for theological orientation since 57% of low-hierarchy congregations identify as theologically conservative while 30% of high-hierarchy congregations identify as theologically conservative.
Lastly, leadership demographics use common measures such as the age of the clergy members, their education levels, their level of ministerial or theological training, partisan political identification, racial identification, and personal religious beliefs. On average, the clergy are in their early 50s, carry a professional degree, have formal theological training, and identify as Republican, White, and born again. A full list of the organizational traits and leadership demographic controls is included in Table 3. These independent, dependent, and control variables guide the analysis.
Organizational traits and clergy demographics

Results
The hypothesis is tested using OLS due to the expected linear relationship between the independent variable of climate concern and the dependent variable of disaster preparedness (Lewis-Beck and Lewis-Beck Reference Lewis-Beck and Lewis-Beck2015). Since the sample is relatively small, power analysis was conducted alongside each regression, and results suggest the sample size is sufficient to detect an effect with model parameters (Kyonka Reference Kyonka2018). Analysis is conducted in Posit using the Tidyverse environment (Wickham et al. Reference Wickham, Averick, Bryan, Chang, McGowan Lucy, François, Grolemund, Hayes, Henry, Jim and Max2019).
Moving to the hypothesis, Figure 2 displays two regression models. The first model predicts PrepScore with just SASSY alone. The results suggest that a one-unit increase in climate concern leads to a 0.5-unit decrease in preparedness, or about half an action on the preparedness score. The statistical significance of this finding is eliminated when alternative explanations are introduced into the second model with SASSY and all control variables. These control variables include organizational traits such as the size of the congregation, annual budget, property ownership, denominational hierarchy, past disaster experience or exposure, and region of the United States. Clergy demographics such as age, education, political leanings, and similar are also included.
Regression coefficient plot displaying higher disaster preparedness (PrepScore) predicted by climate concern (SASSY) and control variables. Non-significant variables excluded from graphic.
SASSY alone model statistics: Residual standard error: 4.91 on 183 degrees of freedom, multiple R-squared: 0.02886, adjusted R-squared: 0.02355, F-statistic: 5.438 on 1 and 183 DF, p-value: 0.02079. A priori power analysis with significance criteria at 0.05 and power of 0.80 suggests a minimum sample n=53 to detect a medium effect.
SASSY with controls model statistics: Residual standard error: 3.943 on 167 degrees of freedom, multiple R-squared: 0.4284, adjusted R-squared: 0.3702, F-statistic: 7.363 on 17 and 167 DF, p-value: 2.718e-13. A priori power analysis with significance criteria at 0.05 and power of 0.80 suggests a minimum sample n=139 to detect a medium effect.

Consistent with previous findings, the strongest predictors of increased disaster preparedness are increases in informal networks, formal networks, and past experience with disaster response. New to this study, the higher average age of congregation members is positively associated with disaster preparedness. Turning towards leader demographics, clergy with higher levels of education are associated with lower levels of disaster preparedness, while older clergy are associated with higher levels of preparedness. Notably, SASSY is not a statistically significant predictor of PrepScore when other controls are included.
To confirm this result, a series of regressions were conducted with the same predictor variables for each of the action, planning, and information groupings for PrepScore. In essence, if climate concern does not predict PrepScore, what happens when the score is broken apart? For example, does climate concern influence information and planning items but not action items? As displayed in Figure 3 and similar to the results for the main hypothesis, climate concern was not a statistically significant predictor for any element of disaster preparedness. Instead, organizational traits such as networks and member age, past experience, and clergy demographics such as education and clergy age continue to drive disaster preparation.
Regression of disaster preparedness action, information, and planning item predicted by climate concern (SASSY) and control variables. Non-significant variables excluded from graphic. Info Items model statistics: Residual standard error: 1.816 on 167 degrees of freedom, multiple R-squared: 0.3646, adjusted R-squared: 0.2999, F-statistic: 5.637 on 17 and 167 DF, p-value: 5.817e-10. Planning Items model statistics: residual standard error: 1.647 on 167 degrees of freedom, multiple R-squared: 0.3166, adjusted R-squared: 0.247, F-statistic: 4.551 on 17 and 167 DF, p-value: 9.214e-08. Action Items model statistics: residual standard error: 1.488 on 167 degrees of freedom, multiple R-squared: 0.3258, adjusted R-squared: 0.2571, F-statistic: 4.747 on 17 and 167 DF, p-value: 3.66e-08.

As it stands, the regression results suggest that climate concern is not a positive predictor of disaster preparedness, and the hypothesis cannot be accepted. Instead, the relationship seems negative, and higher climate concern is associated with slightly less disaster preparedness. The results also suggest that the clergy in this 2019 sample had not connected climate issues with natural hazards or disaster prevention. In other words, while they were aware of floods and fires, the clergy did not associate those hazards with a changing climate. What might explain this result? A possibility is proposed in the discussion and conclusion.
Discussion and conclusions
This paper began as an exploration of how the personal beliefs of clergy might influence organizational disaster preparedness. The hypothesis proposed that an increase in climate concern by leaders is positively associated with an increase in organizational disaster preparedness. However, the results suggest that increased climate concern by clergy resulted in no change or even decreased disaster preparedness. Even though the null is not rejected, the results are still insightful (Alrababa’h et al. Reference Alrababa’h, Scott Williamson, Jens Hainmueller, Hotard, Laitin, Lawrence and Weinstein2023).
First, results suggest that clergy have not made a causal connection between climate change and increasing or changing risks from natural hazards. Instead, increased organizational preparedness is best predicted by past organizational disaster experience and leadership networks. This result is different than leaders in other sectors, such as insurance or government, but similar to religious individuals (Adkins et al. Reference Adkins, Djupe and Neiheisel2023). The result also suggests that climate change is not a sharp enough event to drive organizational change, similar to what researchers observed in response to the COVID pandemic (DeLeo et al. Reference DeLeo, Taylor, Crow and Birkland2021). Leaders are aware of threats, but awareness is not enough to drive change.
Second, the null result may be a product of institutional and organizational dynamics. For example, the houses of worship in this study are geographically diverse but White Christian Evangelical Protestant. It is possible that results might be different in other religious traditions where higher levels of climate concern are more prevalent (Jones, Cox, and Navarro-Rivera Reference Jones, Cox and Navarro-Rivera2014; Smith and Leiserowitz Reference Smith and Anthony2013; Veldman et al. Reference Veldman, Wald, Mills and Peterson2021; Alper Reference Alper2022). While disasters may not discriminate, impacts are racially differentiated, and more vulnerable communities may be more proactive (Bolin and Kurtz Reference Bolin, Kurtz, Rodríguez, Donner and Joseph2018). Additionally, limits on the organizations may have constrained further planning. Houses of worship may not have the capacity for planning due to staff or financial constraints. This possibility speaks to larger issues around organizational dynamics and constraints in disaster planning. Finally, the opinion of leaders may not matter if they are concerned about bottom-up pressure from the congregation or top-down pressure from superiors. These pressures are known to constrain the actions of clergy across a range of environmental and political issues (Djupe and Gilbert Reference Djupe and Gilbert2008; Neiheisel and Djupe Reference Neiheisel and Djupe2008). Even if leaders are aware of risks from climate change and they want to act, organizational dynamics may prevent any change.
Taken together, the analysis did not support the hypothesis that an increase in climate concern by leaders is positively associated with an increase in organizational disaster preparedness. However, the null result is informative. The study adds to current knowledge about disaster preparedness by houses of worship, improves understanding about the relationship between climate change and disaster risk assessment, and contributes to larger theories about the influence and impact of leaders within their organizations. The study invites future research about the impact of climate change on disaster preparedness by houses of worship across a range of contexts.
Data availability
The data used in this study are openly available in the Association of Religion Data Archives as the Congregations and Disaster, United States 2019 data set at doi: 10.17605/OSF.IO/2U4S7.
Acknowledgements
The author thanks the editors and anonymous peer reviewers for their valuable time and generous feedback on this paper. This project, and especially the title, is better because of their contributions. The author also thanks participants at the Society for the Scientific Study of Religion Annual Conference in 2022 for their comments on an earlier draft of this project. All remaining faults belong to the author.
Funding support
The author is grateful for grant support from the Louisville Institute for data collection under Grant No. #2019035.
Competing interests
The authors declare no conflict of interest.
Dr. Jason M. Pudlo is a professor of Public Administration at East Carolina University. His research focuses on community disaster resilience, and he is especially interested in the various intersections of religion, climate, and disaster.


 Open access