

I. INTRODUCTION
Application of electromagnetic (EM) fields with frequency between 0.3 and 300 GHz, or microwave radiation (MWR), can generate surprising phenomena, which are not observed during conventional materials synthesis. Field-assisted methods have been shown to induce rapid phase transformations,Reference Baghbanzadeh, Carbone, Cozzoli and Kappe1–Reference Rybakov, Eremeev, Egorov, Bykov, Pajkic and Willert-Porada4 influence local atomic structure,Reference Nakamura, Terban, Billinge and Reeja-Jayan5 and affect microstructureReference Rybakov, Olevsky and Semenov6–Reference Yoshida, Sakka, Yamamoto, Lebrun and Raj9 at significantly lower temperatures compared with conventional techniques. Indeed, field-assisted processes have been applied to a range of material systems, including ceramics,Reference Baghbanzadeh, Carbone, Cozzoli and Kappe1,Reference Raj, Cologna and Francis John10,Reference Yu, Grasso, McKinnon, Saunders and Reece11 metal–organic frameworks,Reference Thomas-Hillman, Laybourn, Dodds and Kingman12 polymers,Reference Hoogenboom and Schubert Ulrich13,Reference Wiesbrock, Hoogenboom and Schubert Ulrich14 and pharmaceuticals.Reference Kappe and Dallinger15 However, the widespread application of these methods is still limited by a lack of understanding regarding the underlying mechanisms of many field-mediated effects, particularly in the case of ceramic materials. In particular, the role of thermal effects and field-induced “non-thermal” effects is debated.Reference Raj, Cologna and Francis John10,Reference Rybakov, Olevsky and Krikun16 Currently, the prevailing explanations attribute the observed effects to thermally driven rapid heating ratesReference Ji, Parker, Falco, Zhang, Fu and Todd17,Reference Zhang, Nie, Chan and Luo18 and localized grain boundary heating,Reference Narayan19,Reference Chaim20 while increased mass transportReference Rybakov, Olevsky and Semenov6,Reference Whittaker21 and significantly enhanced defect generationReference Cologna, Rashkova and Raj7,Reference Naik, Sglavo and Raj22 are the most commonly cited non-thermal mechanisms. For a more comprehensive discussion of the potential mechanisms underlying field-assisted techniques, the reader is directed to reviews by Raj et al.Reference Raj, Cologna and Francis John10 and Jha et al.Reference Jha, Phuah, Luo, Grigoropoulos, Wang, García and Reeja-Jayan23 To further investigate these mechanisms and understand how applied fields can drive these low-temperature transformations, it is necessary to deploy emerging, advanced characterization tools.
Synchrotron X-ray sources are a powerful tool for such structural characterization, as they couple high-energy X-rays (>300 keV) with increasingly rapid data acquisition to enable characterization in a variety of sample environments and on a wide range of material types. Synchrotron sources can also provide a range of beam energies and measurement techniques to enable characterization from the microscale down to the atomic scale for both crystalline and non-crystalline materials. These advantages of synchrotron radiation are not available using standard laboratory X-ray sources (e.g., Cu Kα radiation), and thus provide the opportunity to apply new characterization methods to the study of MWR-synthesized materials. Additionally, synchrotron sources provide the capability to analyze materials both ex situ and in situ. In situ instrumentation is inherently more difficult to implement, as it requires custom sample environments that simultaneously contain MWR and isolate the material of interest without significant interference from the surrounding environment (e.g., precursor solution, walls of the reactor). However, such in situ studies capable of observing the effects of MWR in real time may be of critical importance in uncovering the influence of EM fields on phase transitions and other related transient phenomena. Currently, synchrotron techniques have not been widely implemented in the characterization of MWR-grown materials either ex situ or in situ. The purpose of this review is to introduce recent advances that utilize synchrotron radiation to characterize MWR-assisted synthesis and to discuss the potential of synchrotron-based techniques in helping to uncover the mechanisms underlying field-assisted synthesis.
This review outlines recent synchrotron X-ray experimentation applied to characterize materials grown by MWR-assisted synthesis and discusses how the characterization methods used may be beneficial in understanding the mechanisms underlying field-assisted materials synthesis, with a focus on ceramic materials such as metal oxides. While MWR has also been used for sintering of ceramic powders, this topic is outside the scope of this review. The review is split into five sections. Section II introduces the process of MWR-assisted synthesis. Section III reviews recent ex situ studies using synchrotron radiation to characterize MWR-synthesized materials. Section IV details advances in in situ instrumentation and results. Finally, Sec. V provides a summary and discusses prospects for the use of synchrotron X-ray sources to understand how externally applied fields can engineer advanced materials in the future.
II. OVERVIEW OF MWR-ASSISTED SYNTHESIS
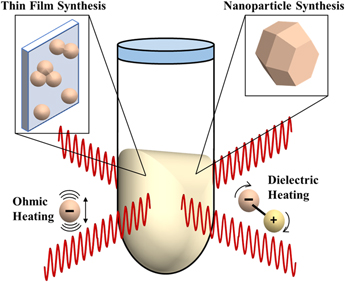
MWR-assisted synthesis involves the application of MWR with a frequency typically in the range of 0.3–300 GHz to a precursor solution or solid-state mixture, promoting rapid heating and crystallization. This process has been demonstrated in the synthesis of a wide variety of ceramic materials,Reference Baghbanzadeh, Carbone, Cozzoli and Kappe1 as well as to sinter oxide and non-oxide ceramic powders. The heating mechanism in MWR-based methods is inherently different from conventional furnace-based heating. MWR heats a material volumetrically, while a furnace heats only the outer surface and is reliant on conduction to move heat throughout the material. There are two main mechanisms widely proposed for microwave heating: ohmic (Joule) heating and dielectric heating. Ohmic heating is caused by the oscillation of free charges in an alternating electric field (E-field), leading to dissipation of thermal energy. Dielectric heating is caused by the rotation of molecular dipoles as they attempt to align themselves with the E-field (Fig. 1). These can be described mathematically by the complex form of permittivity:
 $$\varepsilon = \varepsilon ' - j\varepsilon ''\quad ,$$
where ε′ is the real component of permittivity and describes the electric charge storage within the material and ε″ is the imaginary component describing energy loss from dipole relaxation. The energy lost by a given material exposed to microwave energy can then be described by the loss tangent, as follows:
 $$\tan \delta = {{\omega \varepsilon '' + \sigma } \over {\omega \varepsilon '}}\quad ,$$
where ω is the angular frequency of the applied field and σ is the electrical conductivity. ωε″ describes the dielectric heating component, while σ quantifies the ohmic energy loss from free charge (e.g., electron, ion) oscillation.Reference Chen, Ong, Neo, Varadan and Varadan24 For more information on how microwave heating is utilized in materials synthesis, the reader is directed to review articles by Tompsett et al.Reference Tompsett, Conner and Yngvesson25 and Rybakov et al.Reference Rybakov, Olevsky and Krikun16
Schematic of MWR-assisted synthesis. MWR-assisted synthesis has been demonstrated for a variety of syntheses, including nanoparticle and thin film growth. The predominant modes of microwave heating, ohmic and dielectric heating, are also represented. Open questions remain in the field of MWR-assisted synthesis regarding if these heating mechanisms are the sole driving force behind the rapid, low-temperature crystallization observed during MWR-assisted synthesis or if potential non-thermal, MWR-driven effects exist.

The volumetric heating provided by dielectric and ohmic losses can be advantageous, leading to rapid heating rates and the potential for selective microwave heating of specific components in the reaction.Reference de la Hoz, Díaz-Ortiz and Moreno26–Reference Mochizuki, Sasaki, Maitani, Okamoto, Suzuki and Wada28 However, in many cases, the results observed during microwave synthesis are not easily explained by these thermal mechanisms, leading to speculation regarding potential MWR-driven non-thermal effects.Reference Rybakov, Olevsky and Krikun16,Reference de la Hoz, Díaz-Ortiz and Moreno26,Reference Stuerga and Gaillard29,Reference Herrero, Kremsner and Kappe30 These potential non-thermal effects include enhanced mass transport due a ponderomotive force,Reference Rybakov, Olevsky and Semenov6 reduced activation energies,Reference Lopez and Mangolini31 and improved reaction kinetics.Reference Binner, Hassine and Cross32 Expanding the techniques available to characterize MWR-grown materials is critical to furthering our understanding of these effects. In the following sections, we review reports utilizing synchrotron radiation to study MWR-assisted synthesis both ex situ and in situ, providing details into the experimentation required to conduct such studies and the insights that can be obtained.
III. EX SITU SYNCHROTRON X-RAY STUDIES OF MWR-ASSISTED SYNTHESIS
There are only a handful of synchrotron-based studies characterizing MWR-synthesized materials ex situ. While the debate about MWR-driven non-thermal effects is centered predominantly around ceramic materials, particularly oxides, insight can still be gained from the experimental techniques used and conclusions obtained from studies on other material systems. Two such recent reports will be reviewed in this section, covering MWR-assisted synthesis of TiNiSn and TiCoSb half-Heusler compoundsReference Birkel, Zeier, Douglas, Lettiere, Mills, Seward, Birkel, Snedaker, Zhang, Snyder, Pollock, Seshadri and Stucky33 and titanium dioxide (TiO2) thin films.Reference Nakamura, Terban, Billinge and Reeja-Jayan5
Birkel et al. used a domestic microwave oven (LG Goldstar, Seoul, South Korea) operating at 700 W to synthesize TiNiSn and TiCoSb half-Heusler compounds at significantly reduced reaction times.Reference Birkel, Zeier, Douglas, Lettiere, Mills, Seward, Birkel, Snedaker, Zhang, Snyder, Pollock, Seshadri and Stucky33 The reaction time was reduced from more than a week (conventional) to 1 min (microwave). It was found that MWR-grown TiNiSn had improved thermoelectric properties relative to the conventional sample, while MWR-grown TiCoSb had significantly diminished thermoelectric properties relative to conventionally made TiCoSb. Synchrotron X-ray diffraction (XRD) data were collected at the Advanced Photon Source (APS), Argonne National Laboratory, and used to compare the crystalline structure of MWR and conventionally grown compounds. For the TiNiSn compound, the phase composition present was the same in both MWR and conventional samples. However, the compound exposed to MWR exhibited a lower thermal conductivity and thus a higher Seebeck coefficient. This was attributed to increased phonon scattering by the nanocrystalline grains induced by the MWR-assisted synthesis process and provides a beneficial examples of how MWR exposure can influence structure and resultant material properties.
In the TiCoSb compound, the low Seebeck coefficient observed in MWR-grown samples was attributed to the formation of a secondary metallic impurity phase, CoSb, in the material. This impurity phase led to metallic-like behavior in the thermal and electrical transport properties, thus hindering the thermoelectric properties of MWR-grown TiCoSb. This impurity phase was observed only in MWR-grown samples and was characterized by additional peaks observed in the synchrotron XRD data. The TiCoSb example discussed in this report provides an example of an MWR-driven effect on the resultant phase composition of the material. However, little discussion is given to how the application of MWR may have induced this secondary phase, making it difficult to clearly distinguish the role of MWR in the formation of half-Heusler compounds. Additionally, no information was given regarding the reaction temperature in the microwave compared with conventional methods, making a direct comparison of phase formation difficult. While this study provides an example of how MWR can influence microstructure, atomic structure, and the resultant material properties, it does not further investigate potential mechanisms of how MWR may influence phase transitions in materials.
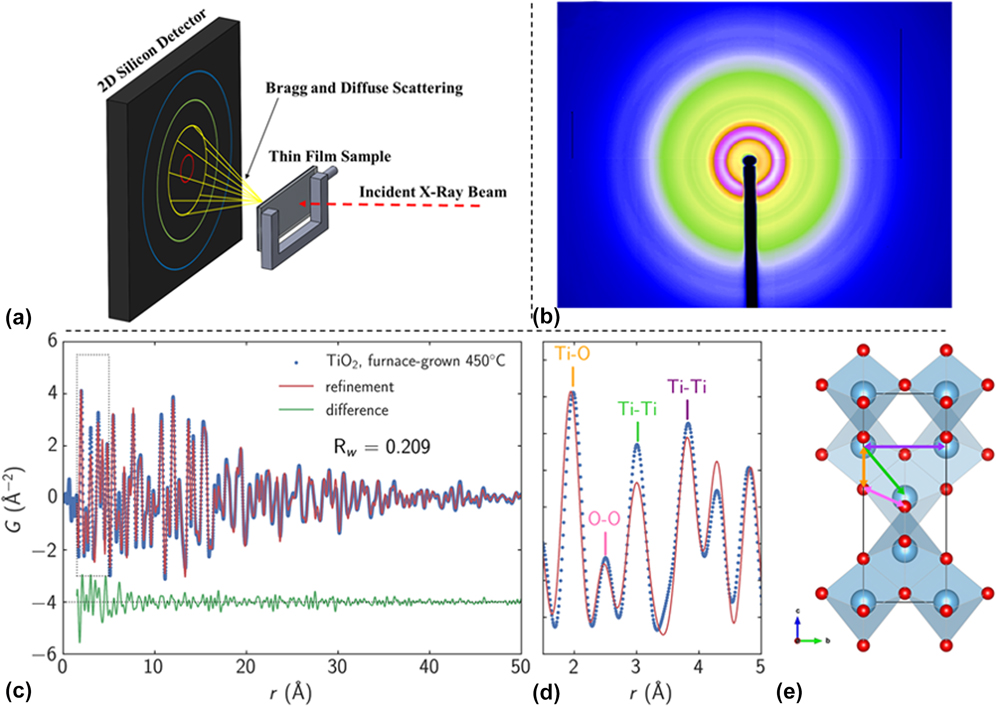
By using synchrotron X-ray pair distribution function (PDF) analysis, our work (Nakamura et al.), also reported differences in phase composition relative to conventional processes in TiO2 films synthesized by MWR-assisted synthesis.Reference Nakamura, Terban, Billinge and Reeja-Jayan5 Unlike XRD, which uses Bragg reflections and characterizes only long-range atomic order (crystalline phases), PDF analysis is capable of quantitatively characterizing both local and long-range atomic order, thus giving information on crystalline and amorphous or locally disordered components in the material.Reference Egami and Billinge34 By incorporating both Bragg and diffuse scattering information, PDF analysis provides a powerful new tool to study deviations from the symmetry (e.g., changes in short-range atomic ordering) that is frequently observed when external fields like MWR are applied.Reference Nakamura, Terban, Billinge and Reeja-Jayan5 Figures 2(a) and 2(b) illustrate the ex situ PDF data collection process for a TiO2 thin film sample. The resultant PDF gives the scaled probability of finding atomic pairs a certain distance apart. Therefore, PDF analysis yields a direct, real-space measurement of interatomic distances in a material [Figs. 2(c) and 2(d)]. Using a starting reference structure, least squares fitting can be performed to extract quantitative information in addition to bond distances, including phase percentages, lattice parameters, and atomic displacement parameters [Fig. 2(e)].Reference Farrow, Juhas, Liu, Bryndin, Božin, Bloch, Proffen and Billinge35 For more details regarding PDF data collection and analysis, the reader is directed to the textbook by Egami and Billinge.Reference Egami and Billinge34
(a) Schematic of PDF data collection. (b) The resultant 2D diffraction pattern, which includes contributions from both the TiO2 thin film and the substrate. Dead pixels and the beamstop (seen as black regions in the image) are masked out before integration to a 1D intensity. (c) PDF data for a furnace-grown TiO2 thin film at 450 °C (blue), shown with a phase refinement to crystalline anatase TiO2 (red). The difference is shown below offset in green and is quantified by the goodness-of-fit parameter R w, where lower R w values correspond to a better fit to the data. (d) Low-r PDF data, which corresponds to the local atomic order in the material. Specific PDF peaks are labeled in (d), with their corresponding interatomic distances in the anatase unit cell shown in (e).
In the study by Nakamura et al., TiO2 thin films were synthesized on electrically conducting layers using MWR-assisted synthesis. The conducting layer facilitates preferential MWR absorption by focusing the MWR like an antenna. This experimental design promotes localized crystallization and growth of TiO2 films on the conducting layer. Utilizing thin film PDF data acquisition and analysis methodsReference Jensen, Blichfeld, Bauers, Wood, Dooryhée, Johnson, Iversen and Billinge36 at the National Synchrotron Light Source II (NSLS-II) at Brookhaven National Laboratory, it was found that TiO2 films grown by MWR-assisted synthesis at a solution temperature of 160 °C contained long-range crystalline anatase phase TiO2 mixed with a locally ordered amorphous component. PDF fitting revealed that this amorphous component could be estimated by a 77:23 brookite:anatase ratio. In contrast, TiO2 films synthesized in the furnace without MWR exposure at similar low temperatures (150–160 °C) using the same substrate and precursor were found to be fully amorphous, with a local atomic structure estimated by a 80:7:13 brookite:anatase:rutile ratio. These results indicate a clear influence of MWR exposure on both crystalline phase formation and local atomic ordering in TiO2 even at such low temperatures. Regular XRD alone could not discriminate these subtle structural changes, which suggest that MWR can influence atomic structure in ways not attainable via conventional, furnace-based synthesis routes.
However, further work is necessary to better explain the mechanisms by which MWR induces phase transformations. For example, the impact of field absorption by the electrically conducting layer on local reaction temperature is not known, making the differentiation of potential thermal or non-thermal effects difficult. Additionally, the observation that MWR can influence phase transitions is not supported by a hypothesis to explain how MWR may drive these transitions. Clearly, more work is needed to differentiate thermal and non-thermal effects of MWR and to better develop an underlying theory as to how MWR influences phase formation in ceramic oxides. The implementation of in situ experimentation to monitor MWR-assisted synthesis will be critical for expanding upon these early ex situ investigations and working toward development of such a theory.
IV. IN SITU SYNCHROTRON X-RAY STUDIES OF MWR-ASSISTED SYNTHESIS
An important component of uncovering the mechanisms underlying MWR-assisted synthesis is the ability to monitor structural changes in the irradiated material as MWR is being applied. In this regard, the development of in situ instrumentation to study field-assisted reaction is critical. The application of in situ synchrotron techniques during MWR exposure will enable detailed characterization of phase transitions, intermediate phase formation, and other transient processes to directly relate applied fields to changes in structure. The following section discusses recent advances in in situ instrumentation capable of monitoring MWR-assisted reactions using synchrotron-based techniques.
A. In situ XRD
XRD yields information on crystalline phases in a material. Utilizing synchrotron radiation for XRD studies is particularly useful, as the high-energy X-rays allow data collection over a large 2θ range and improves penetration through the sample, which limits interference from the background (e.g., precursor solution) during in situ studies.
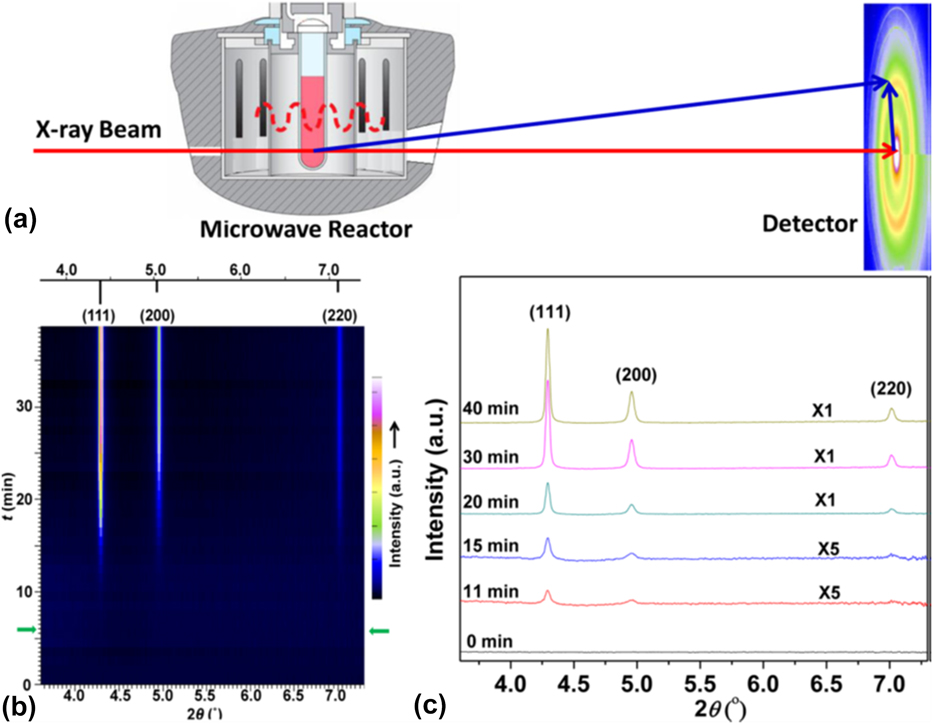
In a study by Liu et al., a Monowave 300 microwave reactor (Anton Paar, Graz, Austria) operating at 2.45 GHz was modified to enable in situ XRD experiments at the 1 ID-E beamline at the APS [Fig. 3(a)].Reference Liu, Gao, Liu, Okasinski, Ren and Sun37 The MWR-assisted growth of Ag nanoparticles was then monitored, and it was found that the reaction kinetics of Ag nanoparticle growth when exposed to MWR are significantly enhanced compared with synthesis using conventional oil bath heating [Figs. 3(b) and 3(c)]. While no conventional oil bath experiments were presented in the above report, results from MWR-assisted synthesis were compared with prior publications from the authors on conventional oil-bath Ag nanoparticle synthesis. The rapid growth was attributed in part to oriented attachment of Ag nanoparticles in the solution. Indeed, it was shown that the growth kinetics differed along various crystallographic directions, with the (111) direction having a higher rate constant than the (200) direction. This indicates that MWR-assisted growth of Ag may be anisotropic and that surfaces of the Ag are terminated with {111} facets. Despite these results, the authors do not discuss why the Ag nanoparticles may prefer to terminate with a particular orientation or how the MWR may be influencing which orientation is preferred.
(a) Anton Paar Monowave 300 microwave reactor modified to enable in situ XRD. (b) Plot of XRD patterns from Ag nanoparticle growth over time. Green arrows indicate when the reaction reached its final temperature of 140 °C, and the standard Ag XRD pattern is plotted above for reference. (c) XRD patterns from a few specific times during the reaction. Reprinted with permission from Ref. Reference Liu, Gao, Liu, Okasinski, Ren and Sun37. Copyright 2016 American Chemical Society.
The preferred orientation observed in situ during MWR exposure is interesting, as it suggests that preferential alignment may occur along the direction of the E-field vector when exposed to MWR. For example, prior work on MWR-assisted sintering found that pores in ZrO2 align preferentially with the applied MWR.Reference Rybakov, Semenov, Link and Thumm38 Direct E-field–assisted sintering experiments (e.g., flash sintering) have also reported field-induced texture in TiO2 samples.Reference Jha, Lebrun, Seymour, Kriven and Raj39 While the processes of synthesis and sintering differ, the theme of preferred orientation induced by externally applied fields appears to be consistent. As pointed out by Liu et al., within the context of synthesis, this preferential orientation and attachment may be a driving factor in the rate enhancement observed during MWR-assisted synthesis.
In another report, Nicula et al. utilized a single-mode microwave applicator with a rectangular cavity to study E (electric) and H (magnetic) field–assisted heating separately, including phase transitions during the reduction of magnetite (Fe3O4) to iron,Reference Ishizaki, Stir, Gozzo, Catala-Civera, Vaucher and Nicula40,Reference Stir, Ishizaki, Vaucher and Nicula41 intermetallic synthesis,Reference Vaucher, Nicula, Català-Civera, Schmitt and Patterson42,Reference Vaucher, Stir, Ishizaki, Catala-Civera and Nicula43 and crystallization of amorphous materials.Reference Nicula, Ishizaki, Stir, Catala-Civera and Vaucher44–Reference Nicula, Stir, Ishizaki, Català-Civera and Vaucher46 We will focus our discussion here on the reduction of the ceramic oxide system of Fe3O4. The reduction of magnetite Fe3O4 was studied by in situ XRD during MWR exposure in both an E-field maximumReference Stir, Ishizaki, Vaucher and Nicula41 and an H-field maximumReference Ishizaki, Stir, Gozzo, Catala-Civera, Vaucher and Nicula40 and during conventional furnace heating.Reference Ishizaki, Stir, Gozzo, Catala-Civera, Vaucher and Nicula40 Fe3O4 was mixed with carbon black and exposed to MWR at a frequency of 2.45 GHz and a forward power of 500 W. When in an E-field maximum, the powder was heated to 1100 °C and Fe3O4 was reduced to Fe metal. The transition occurred by first reducing Fe3O4 to a nonstoichiometric Fe0.88O phase, then to a nearly stoichiometric Fe0.94O composition, and finally to Fe metal [Fig. 4(a)]. When the same reaction was carried out in an H-field maximum, the sample heated to only 770 °C, and the yield of Fe metal was only 32.6% (compared with 58.8% in the E-field maximum). Conventional furnace heating at 1000 °C again reduced Fe3O4 to Fe0.88O and Fe0.94O, but it was unable to further reduce the oxide to pure Fe metal [Fig. 4(b)]. Additionally, the reaction was much slower using conventional heating, indicating that MWR increases the reaction kinetics.
(a) Variation in weight percent of Fe3O4 (magnetite), Fe0.88O (W1), Fe0.94O (W2), and Fe over time when the Fe3O4/carbon black mixture is heated in an E-field maximum. Wustite refers to the total amount of FexO phase present. KJMA fit refers to a fit to the Kolmogorov-Johnson-Mehl-Avrami equation. (b) Variation in the amount of phase present under conventional furnace heating. Note that pure Fe metal never forms, despite a significant increase in the reaction time. (a) Reprinted from Ref. Reference Stir, Ishizaki, Vaucher and Nicula41, with the permission of AIP Publishing. (b) Reprinted from Ref. Reference Ishizaki, Stir, Gozzo, Catala-Civera, Vaucher and Nicula40, with the permission of Elsevier.
The results observed in the above study on MWR-assisted Fe3O4 reduction were attributed to multiple mechanisms, including a lowered activation energy for the reaction, enhanced mass transport induced by MWR, and enhanced volumetric heating by MWR due to a large concentration of defects in the FexO phases. The underlying cause of a potential decrease in activation energy or enhanced mass transport was not discussed, but similar ideas have been proposed previously in MWR-assisted synthesis and sintering processes.Reference Rybakov, Olevsky and Semenov6,Reference Lopez and Mangolini31 MWR was hypothesized to enhance heating due to the high concentration of defects in FexO phases, which would enhance local energy losses. An interesting observation can be made from the experimental results showing that the E-field maximum led to higher sample temperatures and more Fe3O4 reduction. This result suggests that the increase in the E-field component led to either improved heating around these defects or the generation of an increased amount of oxygen defects in the material. As the furnace sample was also heated to a similar temperature and held for a long period of time, this could suggest that E-field–induced defect generation or MWR-driven defect clustering may have been one of the driving forces for the reduction reaction. If the effects were indeed due only to a volumetric heating component, the long furnace hold times should have given ample time to dissipate heat throughout the Fe3O4 sample and produce similar reduction results. A similar debate exists in the direct E-field–assisted/flash sintering community, where enhanced densification has been attributed to both enhanced local heating at grain boundariesReference Narayan19,Reference Chaim20 and enhanced oxygen defect generation in the bulk of the material.Reference Cologna, Rashkova and Raj7,Reference Naik, Sglavo and Raj22 However, both in the above study and within the broader field-assisted community, no quantitative explanation can be given for why MWR may lower defect formation energy or enhance defect clustering, making it difficult to attribute MWR-based effects to non-thermal defect generation. The low energy of the 2.45 GHz MWR applied further strengthens this argument.
Energy-dispersive XRD (EDXRD) has also been used to study MWR-assisted synthesis in situ. EDXRD gives similar information to conventional XRD. However, EDXRD uses a polychromatic incident beam and holds the detector angle 2θ constant, while XRD uses a monochromatic beam of constant energy and scans over a range of 2θ values. Wragg et al. have used EDXRD to study the synthesis of AlPO4 frameworks in situ under both MWR and conventional heating.Reference Wragg, Byrne, Giriat, Ouay, Gyepes, Harrison, Whittaker and Morris47 They find that the synthesis rate in the microwave is 10 times faster than when grown conventionally, again indicating an enhancement in reaction kinetics due to MWR. When synthesized using conventional heating, an intermediate phase is observed prior to the final AlPO4 framework. However, in MWR-assisted synthesis, the final AlPO4 structure is observed directly with no indication of intermediate phase formation. This suggests that the application of MWR can influence phase formation pathways during materials synthesis. This study was unable to identify the composition or structure of the intermediate phase that formed during conventional synthesis, but the lack of an intermediate phase in the MWR-grown sample was attributed to the fast nucleation rate and rapid heating associated with MWR.
B. In situ small- and wide-angle scattering
In addition to XRD, small-angle X-ray scattering (SAXS) and wide-angle X-ray scattering (WAXS) have been used for in situ monitoring of MWR-assisted synthesis. SAXS involves collecting only low-angle 2θ values, generally by moving a 2D large-area plate detector far from the sample of interest. SAXS thus collects only the small-angle scattering and can be used to monitor particle size distributions and interactions. WAXS, on the other hand, involves collecting the high-angle 2θ scattering and can monitor the dynamics of long-range ordering in materials and growth of crystalline phases.
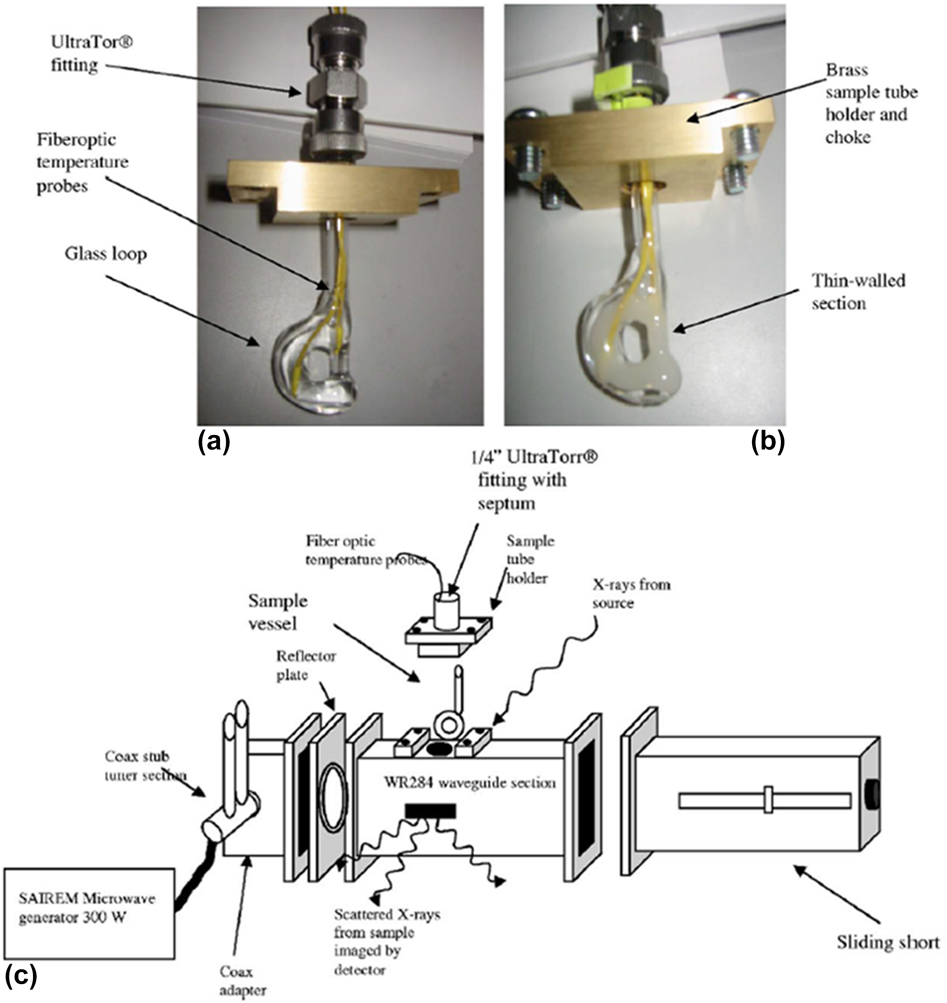
A custom-built microwave reactor was used to monitor MWR-assisted silicate zeolite synthesis.Reference Tompsett, Panzarella, Conner, Yngvesson, Lu, Suib, Jones and Bennett48,Reference Panzarella, Tompsett, Conner William and Jones49 This reactor operated at 2.45 GHz and featured a rectangular waveguide, coaxial stub tuners, and a sliding short (Fig. 5). This design allows the frequency to be tuned to promote maximum heating in the chamber. The microwave power was supplied via a coaxial cable attached to a SAIREM type GMP 03 KS/M generator with a forward power of 300 W. Rectangular slots were machined in the side of the waveguide to allow the X-rays to pass through. This experimental setup was then used to study the role of precursor solution on silicate zeolite synthesis.Reference Panzarella, Tompsett, Conner William and Jones49 Panzarella et al. found that MWR enhanced the rate of zeolite crystallization regardless of the precursor used. Despite the rate increase, certain precursor concentrations had no effect on the mechanisms of zeolite formation, as SAXS data indicated that the nanoparticle reorganization leading to crystallization is similar. However, other chemistries produced a clear effect of MWR on the material formed. For example, when a precursor solution containing a mixture of NaA zeolite, NaX zeolite, and sodalite was used, MWR was found to selectively promote different phases relative to conventional heating. Conventional heating led to a nearly pure sodalite phase, while MWR exposure induced high NaA and NaX content. This example thus demonstrates the ability of MWR to shift the selectivity of certain reactions.
(a and b) Glass reaction vial used for in situ SAXS/WAXS data collection. (c) Custom waveguide for in situ SAXS/WAXS measurements, consisting of coaxial stub tuners and a sliding short apparatus. Reprinted from Ref. Reference Tompsett, Panzarella, Conner, Yngvesson, Lu, Suib, Jones and Bennett48, with the permission of AIP Publishing.
The above results, however, were not discussed in the context of any underlying MWR-based mechanisms, making it difficult to draw conclusions regarding how MWR exposure may have influenced selective phase formation during the silicate zeolite synthesis. However, the outline for the custom microwave reactor designed here should be applicable to other synchrotron X-ray characterization techniques, as the only the sample holder and location of outlet ports would need to be modified to accommodate specific experiments. Additionally, the ability of SAXS to characterize particle size distributions and interactions provides the opportunity for future SAXS studies to yield valuable information regarding MWR-induced particle reorientation and oriented attachment in solution.
C. In situ X-ray absorption spectroscopy
In situ studies of MWR-assisted synthesis have not been limited to X-ray scattering methods. X-ray absorption spectroscopy (XAS), specifically extended X-ray absorption fine spectrum analysis (EXAFS), has also been recently demonstrated.Reference Cozzo, Ishizaki, Pouchon and Vaucher50 XAS involves scanning the incident X-ray energy around an absorption edge of a particular atom, with a large increase in X-ray absorption occurring at the edge. The corresponding interaction of the ejected photoelectron with its surrounding environment then affects the measured absorption coefficient after the edge and can be related to the local coordination environment around the atom of interest. EXAFS is thus a chemical-specific structural probe, capable of providing information regarding the local atomic environment around a specific atom type of interest.Reference Teo and Joy51
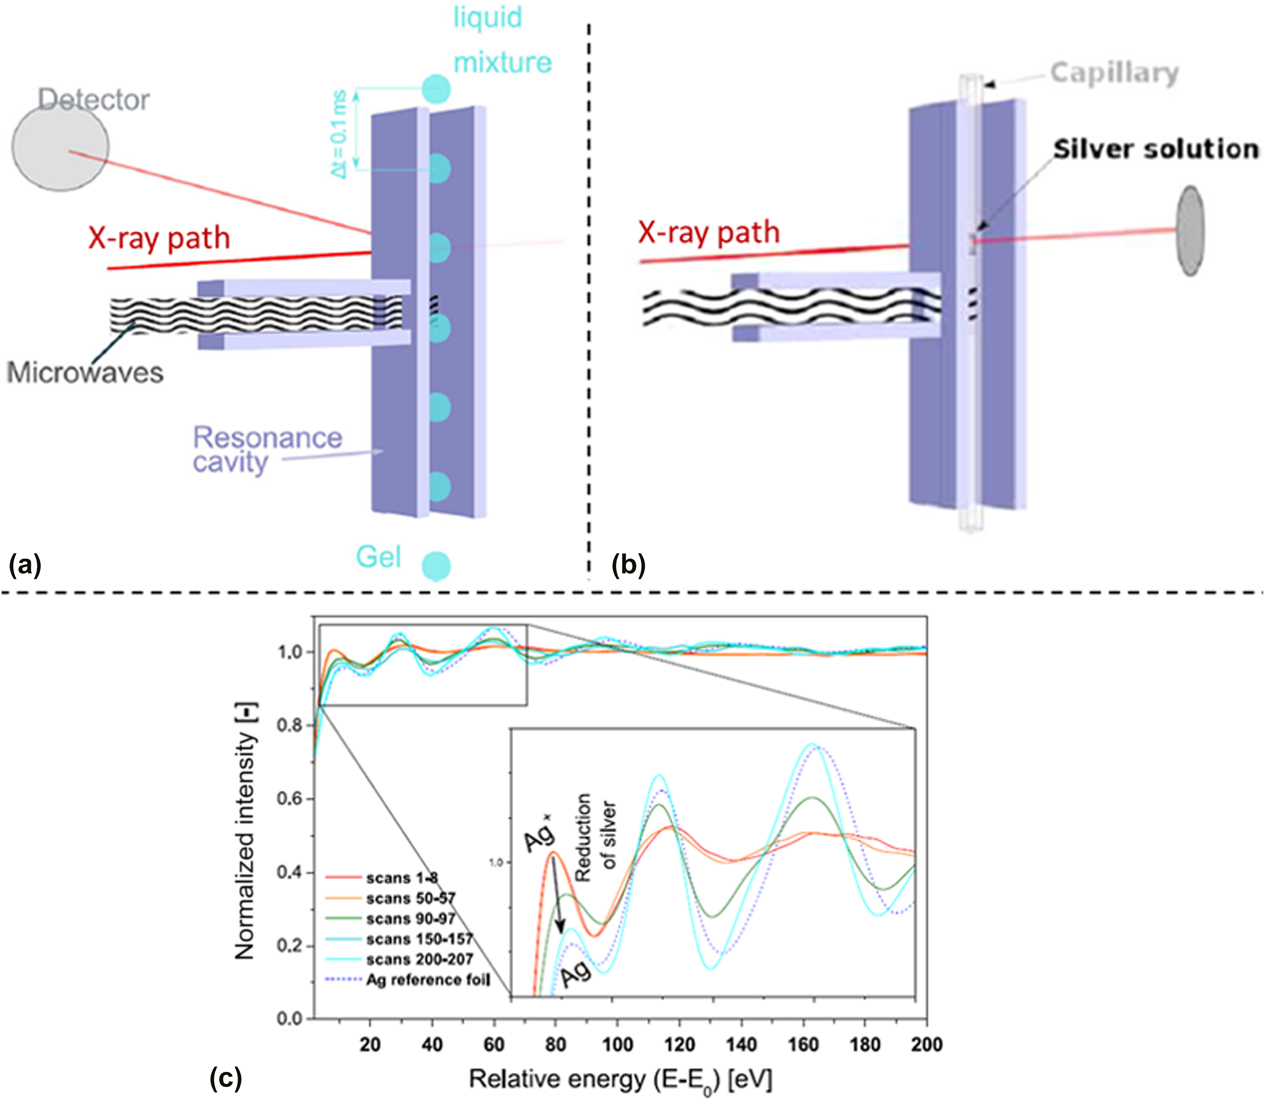
Cozzo et al. demonstrated that time-resolved in situ EXAFS data could be collected to monitor the evolution of gelation reactions.Reference Cozzo, Ishizaki, Pouchon and Vaucher50 The experimental setup was tested in two experiments: (i) flow of droplets of a Ce(NO3)3 solution through a waveguide with EXAFS data collected in fluorescence mode [Fig. 6(a)] and (ii) precipitation of Ag from an AgNO3 solution with data collected in transmission mode [Fig. 6(b)]. This was a proof-of-concept study to demonstrate the feasibility of collecting XAS data on a discontinuous signal [from the falling Ce(NO3)3 droplets] and to determine if rapid data collection techniques provided usable EXAFS spectra. The SuperXAS beamline at the Swiss Light Source was used, which has a Quick EXAFS monochromator capable of rapid XAS data collection.Reference Abdala, Safonova, Wiker, van Beek, Emerich, van Bokhoven, Sá, Szlachetko and Nachtegaal52 Rather than starting from below the absorption edge and scanning upward in energy for each scan, this method alternatively scanned the energy from below the absorption edge to above the edge and then reversed direction to collect a new scan moving from high energy to low energy. This allowed for rapid data collection, with two full spectra collected every second. This report demonstrated that rapid XAS data collection on a discontinuous solution under MWR exposure was feasible and that the rapid Ag precipitation occurring during MWR-assisted synthesis could be effectively monitored using the SuperXAS beamline [Fig. 6(c)].
(a) Schematic of XAS data collection on falling droplets in a microwave cavity, with XAS data collected in fluorescence mode. (b) XAS data collection in transmission mode on an AgNO3 solution, using the same microwave cavity. (c) Resultant absorption spectra plotted against beam energy using the experiment arrangement in (b). Clear changes in the absorption correspond to the reduction of silver occurring due to MWR exposure. Reprinted from Ref. Reference Cozzo, Ishizaki, Pouchon and Vaucher50, with the permission of Springer Nature.
As this study was meant as a feasibility test in preparation for future in situ XAS experiments, no discussion was presented on the mechanisms underlying the synthesis performed. It is additionally worth noting that such rapid data collection is not always possible at XAS beamlines due to limitations on monochromator movement, pushing the data collection time for individual spectra to the order of minutes rather than seconds. For more rapid MWR-assisted reactions, this longer time scale may not be feasible for effectively monitoring local structural changes and reaction kinetics. However, given a long enough reaction or the ability to use similar rapid data acquisition tools as presented here, monitoring the local atomic order and chemical specific coordination environment as a function of MWR exposure would be very beneficial. This information regarding local atomic order is not available using XRD or SAXS methods, and the atom-specific nature of XAS data provides the opportunity to investigate the response of specific atomic coordination environments, such as how cations of differing oxidation states respond to MWR exposure. The role of local structural probes such as XAS is discussed further in Sec. V.
V. SUMMARY AND FUTURE OUTLOOK
The use of EM fields, such as MWR, during materials synthesis holds tremendous promise for engineering novel materials at significantly lower temperatures and reaction times than conventionally required. To realize this potential, it is critical to address open questions in the community surrounding the underlying mechanisms of MWR and field-assisted synthesis methods.Reference Raj, Cologna and Francis John10,Reference Jha, Phuah, Luo, Grigoropoulos, Wang, García and Reeja-Jayan23 Many of the synchrotron-based characterization tools presented above provide valuable insight into these mechanisms, but there is still no clear consensus regarding how EM fields promote these rapid, low-temperature processes. For example, is the rapid rate enhancement driven purely by enhanced heating rates or more efficient volumetric heating, or can applied fields influence mass transport or defect generation in ways not possible via thermal mechanisms alone? Synchrotron X-ray sources and their corresponding characterization tools provide a new pathway for investigating such mechanisms, and this work reviews recent developments in both ex situ and in situ studies using synchrotron tools to study MWR-assisted synthesis. Ex situ studies have provided valuable information regarding the effects of MWR on atomic structure, phase formation, and resultant properties but are inherently limited in that they are unable to directly observe field-mediated effects as they occur. Ex situ experiments thus fail to capture the dynamic, time-dependent nature of field-mediated chemical reactions. Experimental arrangements capable of in situ X-ray characterization of MWR-assisted growth are therefore critical to understanding how MWR exposure influences nucleation, growth, and crystallization relative to conventional synthesis processes.
Moving forward, several areas of development can be identified to further improve our understanding of the mechanisms underlying field-assisted processes. It is important to apply the characterization methods discussed here to a broader range of ceramic and other materials of interest to develop a more comprehensive framework describing MWR-based effects as a function of intrinsic material properties. Additionally, coupling accurate localized temperature measurements with in situ X-ray characterization will help distinguish between the role of purely thermal and non-thermal effects. While infrared imaging tools have steadily improved in spatial resolution, the exact local temperatures when external fields such as MWR couple with materials remains unknown. Finally, it is critical to expand the scope of in situ characterization beyond XRD. While in situ XRD studies will continue to provide valuable information regarding crystalline phase formation and the reaction kinetics of MWR-assisted synthesis, they are unable to quantify the effect of MWR exposure on local atomic order (e.g., changes in bond distances or coordination environments, defect generation).
Expanding the implementation of XAS measurements can provide information regarding how MWR exposure influences atomic coordination environments and will provide insight into how MWR influences the environment of specific cations. This can help distinguish MWR effects across different ceramic materials and inspire future studies on how the valence state of cations or changes in local coordination environment influence interactions with an applied field. Expanding the scope of X-ray PDF studies will also be of importance in future investigations. While in situ experimentation to acquire PDF data during MWR-assisted synthesis has yet to be implemented, it would provide a means to monitor changes in both local atomic order and long-range crystalline phase formation simultaneously. In situ PDF studies would also provide direct information regarding changes in bond lengths and local interatomic distances as a function of field exposure. The increased use of local structural probes such as XAS and PDF analysis will be instrumental in studying the potential role of defects in MWR-assisted reactions, as such short-range structural perturbations are not observable via XRD. In situ XRD can also be complimented by increased usage of SAXS, which can provide information on particle size and orientation distributions in solution, thus investigating the role of preferential alignment with the applied field as well as potential MWR-induced oriented attachment of particles.
Uncovering the mechanisms underlying MWR-assisted synthesis may also require a broad viewpoint, taking into account observations from other field-assisted synthesis and sintering methods to investigate how mechanisms may be connected across field-driven techniques. As discussed previously, many of the proposed thermal and non-thermal mechanisms, such as rapid heating rates, localized heating, and potential field-induced defect generation, are consistent across both MWR-assisted synthesis and E-field–assisted sintering (e.g., flash sintering).Reference Raj, Cologna and Francis John10,Reference Jha, Phuah, Luo, Grigoropoulos, Wang, García and Reeja-Jayan23 In particular, in situ synchrotron-based studies of flash sintering in ceramic oxides have been useful in identifying potential non-thermal effects of E-field exposure, such as field-induced texture,Reference Jha, Lebrun, Seymour, Kriven and Raj39 non-thermal anisotropic lattice expansion,Reference Lebrun, Hellberg, Jha, Kriven, Steveson, Seymour, Bernstein, Erwin and Raj53 formation of field-stabilized phases,Reference Lebrun, Morrissey Timothy, Francis John, Seymour Kevin, Kriven Waltraud and Raj54 and increased disorder on the oxygen sublattice relative to the cation sublattice.Reference Yoon, Yadav, Raj, Sortino, Ghose, Sarin and Shoemaker55 These observations, particularly with regard to field-mediated texture, phase formation, and oxygen defects, appear to have a high degree of similarity to the observed experimental results on MWR-assisted synthesis presented in this review.
Identifying the mechanisms underlying field-assisted materials synthesis techniques is of fundamental importance to realizing the full economic potential of these methods. The reduced temperatures and processing times observed under external fields can have significant impact in diverse areas, such as energy-efficient manufacturing. Future expansion of in situ synchrotron-based characterization tools for the study of MWR-assisted synthesis, as well as integration of these results with observations from the broader field-assisted processing (e.g., sintering) community, will be instrumental in identifying these mechanisms and differentiating between potential thermal and field-driven non-thermal effects. Continued improvement of instrumentation and analysis tools, as well as development of fourth-generation synchrotron sources and X-ray free-electron lasers, will further enhance in situ studies and enable characterization at length and time scales not previously possible.
ACKNOWLEDGMENTS
Microwave-assisted synthesis work in the Jayan group was supported by the U.S. Department of Defense (DoD), Air Force Office of Scientific Research (AFOSR), under award number FA9550-17-1-0120, directed by Dr. Ali Sayir. Nakamura was supported by the U.S. Department of Defense (DoD) through the National Defense Science & Engineering Graduate Fellowship (NDSEG) Program.


 Open access