


1. Introduction
The flow past circular cylinders is a widely studied canonical model for flows past bluff bodies (Williamson Reference Williamson1996b; Zdravkovich Reference Zdravkovich1997, Reference Zdravkovich2003; Forouzi Feshalami et al. Reference Forouzi Feshalami, He, Scarano, Gan and Morton2022). One aspect of particular interest is the increasing complexity of the flow as the Reynolds number  $Re$ (formed with the free stream velocity, $U_\infty$, the cylinder diameter, $d$, and the kinematic viscosity, $\nu$) increases, ultimately leading to the laminar–turbulent transition of the flow in the wake. In the current paper, we focus on one particular stage of the transition through the different flow regimes and examine the mechanisms responsible for the development of three-dimensional vortical structures in the flow. The two-dimensional time-periodic flow behind a circular cylinder (the von Kármán vortex street) is linearly unstable to two modes of three-dimensional perturbations – modes A and B – arising at critical Reynolds numbers $Re_A\approx 190$ and $Re_B\approx 260$, and critical wavelengths $\lambda _A\approx 4$ and $\lambda _B\approx 0.8$ diameters of the cylinder, respectively (Barkley & Henderson Reference Barkley and Henderson1996). Since $Re_A< Re_B$, three-dimensional perturbations of mode A appear earlier than mode B as the Reynolds number is increased. Nevertheless, after an interval of mode A domination for $Re\lesssim 230$, a transition between the two modes is observed in the range $230 \lesssim Re \lesssim 260$ (Williamson Reference Williamson1988, Reference Williamson1996a). This transition has an intermittent nature with continuous energy transfer from mode A to mode B as $Re$ increases. We refer, e.g., to Williamson (Reference Williamson1996b), Henderson (Reference Henderson1997), Barkley, Tuckerman & Golubitsky (Reference Barkley, Tuckerman and Golubitsky2000) and Jiang et al. (Reference Jiang, Cheng, Draper, An and Tong2016) for an analysis of these mode interactions. A further increase in $Re$ then results in the dominance of short-wavelength structures of mode B type, and it is this type of instability that we focus on in this paper.
The study of ‘pure’ mode B instabilities is also relevant because the order in which the different types of instabilities arise with an increase in Reynolds number depends on the shape of the bluff body and on the boundary conditions applied on its surface. For example, studies of the flow around a square cylinder (Sheard, Fitzgerald & Ryan Reference Sheard, Fitzgerald and Ryan2009), a rotating cylinder (Rao et al. Reference Rao, Radi, Leontini, Thompson, Sheridan and Hourigan2015), a transversely oscillating cylinder (Leontini, Thompson & Hourigan Reference Leontini, Thompson and Hourigan2007) and an elliptic cylinder (Leontini, Lo Jacono & Thompson Reference Leontini, Lo Jacono and Thompson2015; Rao et al. Reference Rao, Leontini, Thompson and Hourigan2017) show that the onset of three-dimensionality can occur through different modes. Specifically, in the last two examples, the inception of three-dimensionality can occur through modes B and  $\hat {\text {B}}$, respectively. (Here, mode $\hat {\text {B}}$ perturbations have a wavelength approximately three times larger than that of mode B, but otherwise have a similar spatio-temporal structure.)
In numerical simulations of flows past circular cylinders, ‘pure’ mode B instabilities can be computed by limiting the spanwise size of the computational domain and enforcing periodic or symmetry boundary conditions in the spanwise direction. This allows a detailed analysis of the nonlinear stages by excluding the (here undesired) unstable large-wavelength perturbations of mode A. Such studies revealed that mode B instabilities arise via a supercritical bifurcation (Henderson Reference Henderson1997) and showed that, unlike the perturbations arising through the mode A instability, the mode B perturbations maintain their characteristic spatio-temporal structure even in the nonlinear finite-amplitude regime (Henderson Reference Henderson1997; Jiang et al. Reference Jiang, Cheng, Draper, An and Tong2016; Aleksyuk & Shkadov Reference Aleksyuk and Shkadov2018).
Barkley (Reference Barkley2005) performed a confined Floquet stability analysis, which showed that the source of the mode B instability is located in the vortex formation region just downstream of the cylinder. This was later confirmed by a structural sensitivity analysis (Giannetti, Camarri & Luchini Reference Giannetti, Camarri and Luchini2010) and agrees with an earlier experimental study by Williamson (Reference Williamson1996a), which suggested that the mode B instability is related to an instability of the braid shear layers. The region in which the mode B instability develops is, therefore, reasonably well known, but the unsteady nature of the vortex formation process and the presence of complex interactions between perturbations during their development make it difficult to clearly identify the mechanism(s) responsible for the onset of the instability. Possible mechanisms include the hyperbolic instability (Leweke & Williamson Reference Leweke and Williamson1998), the centrifugal instability (Ryan, Thompson & Hourigan Reference Ryan, Thompson and Hourigan2005; Aleksyuk & Shkadov Reference Aleksyuk and Shkadov2019) and the development of a local instability on closed trajectories in the vortex formation region (Giannetti et al. Reference Giannetti, Camarri and Luchini2010; Giannetti Reference Giannetti2015; Jethani et al. Reference Jethani, Kumar, Sameen and Mathur2018). All of these hypotheses are based on strongly simplifying assumptions and typically ignore certain features of the complex underlying flow. In particular, the ‘feedback’ mechanism, i.e. the process that causes perturbations to amplify after each cycle of vortex shedding, is often disregarded. In fact, only the studies by Giannetti et al. (Reference Giannetti, Camarri and Luchini2010), Giannetti (Reference Giannetti2015) and Jethani et al. (Reference Jethani, Kumar, Sameen and Mathur2018), which analyse the growth of perturbations on certain closed trajectories in the base flow and regard them as signatures of the mode B instability, explicitly incorporate this effect.
Giannetti et al. (Reference Giannetti, Camarri and Luchini2010) discovered three closed trajectories (referred to as orbits 1–3) of fluid particles in the vortex formation region and showed that throughout their motion, these particles remain near areas where the Floquet exponents for modes A and B exhibit high sensitivity to structural perturbations. This led to the hypothesis that mode A and B arise through ‘local’ instabilities on fluid particles moving along these orbits. Giannetti et al. (Reference Giannetti, Camarri and Luchini2010) and Giannetti (Reference Giannetti2015) investigated this hypothesis by means of a WKBJ analysis (Lifschitz & Hameiri Reference Lifschitz and Hameiri1991) which considered the evolution of localised zero-wavelength inviscid perturbations (governed by the linearised Euler equations) to a time-periodic two-dimensional viscous base flow to show that at  $Re=190$ and $260$, only orbit 3 exhibits a synchronous instability, i.e. an instability in which perturbations have the same period as the base flow. This led to the conjecture that orbit 3 is ‘responsible for the generation of synchronous instabilities, like modes A and B’. In more recent work on the subject, Jethani et al. (Reference Jethani, Kumar, Sameen and Mathur2018) found three additional closed trajectories (orbits 4–6) and also showed that the growth rate on orbits 1 and 2 (which are identical up to a reflection about the $x$-axis; see figure 1(c) for plots of these orbits) switches from being complex (implying an asynchronous instability) to real (corresponding to a synchronous instability) at $Re\approx 250$, which is surprisingly close to $Re_B$. This fact led to the conjecture that the instability on orbits 1 and 2 is ‘a local signature of the emergence of mode B secondary instability’, in contrast to the findings of Giannetti (Reference Giannetti2015).
Examples of dominant Floquet modes: (a) the Floquet multiplier  $\mu$ for $240\leqslant Re\leqslant 300$ and comparison with the data by Barkley & Henderson (Reference Barkley and Henderson1996) and Carmo et al. (Reference Carmo, Sherwin, Bearman and Willden2008); (b) the modified growth rate $\sigma ' = \sigma +\gamma ^2/Re$ in the absence of spanwise viscous diffusion; (c) evolution of in-plane perturbation velocity $\boldsymbol {u}_{p}$ (arrows) and its magnitude $|\boldsymbol {u}_{p}|$ (greyscale colour contours: the darker the colour, the greater the value) at $Re=260$ and $\gamma =7.5$. In panel (c), cyan lines show closed trajectories in the base flow; solid black lines are isolines $\kappa = 1$ (the boundaries of the elliptic regions). The time $t=0$ corresponds to the maximum of the lift coefficient.

The studies discussed above involve various plausible, but nevertheless ad hoc assumptions, such as the assumption that the problem can be studied in the limit of a zero wavelength and by considering only inviscid perturbations. This makes it difficult to resolve the conflicting conclusions arising from those studies. The goal of our current study is to elucidate the key mechanisms (including the ‘feedback’ process) that govern the development of the mode B instability in a rational manner, starting from direct numerical simulations in which no physical effects are neglected a priori. We then employ scaling arguments to derive simplified equations that characterise the various physical mechanisms in the limit of short spanwise wavelength. Comparisons against the full numerical solutions allow us to confirm that the simplified equations correctly capture the behaviour of the flow.
The paper is organised as follows. In § 2, we present the problem formulation and the methodology used to obtain numerical results. In § 3, we review the general mechanisms affecting the growth/decay of perturbations and show that the short-wavelength limit contains all the key physical ingredients required to explain the mechanisms involved in the mode B instability. In § 4, we analyse these mechanisms in the limit of short wavelength; we evaluate the role of viscous diffusion and explore how it affects the instability mechanism associated with the presence of closed trajectories in the base flow. In § 5, we introduce a simple criterion for predicting the local amplification of perturbations due to the stretching mechanism, one of the essential components discussed earlier. Finally, in § 6, we summarise our findings and discuss their wider applicability.
2. Simulation of mode B perturbations
2.1. Problem formulation
We perform a linear stability analysis of the two-dimensional flow of an incompressible viscous fluid around a circular cylinder. In the Cartesian coordinate system  ${\boldsymbol {x}=(x, y, z)}$, the base-flow velocity vector $\boldsymbol {U}(\boldsymbol {r},t)=(U,V,0)$ and pressure $P(\boldsymbol {r},t)$ satisfy the Navier–Stokes equations:
 \begin{cases} \boldsymbol{\nabla}\boldsymbol{\cdot}\boldsymbol{U}=0, \\ \dfrac{\mathcal{D}\boldsymbol{U}}{ \mathcal{D}t}={-}\boldsymbol{\nabla} P+\frac{1}{Re}\nabla^2\boldsymbol{U}, \end{cases}
subject to the no-slip boundary condition  $\boldsymbol {U}(\boldsymbol {r},t)=(0,0,0)$ on the surface of the cylinder $|\boldsymbol {r}|=1/2$ and $\boldsymbol {U}(\boldsymbol {r},t)\rightarrow (1,0,0)$ as $\boldsymbol {r}\rightarrow \infty$, where we have used the notation $\boldsymbol {r}$ for the in-plane coordinates, so $\boldsymbol {r}=(x,y)$. Here, $t$ is time and $\mathcal {D}/\mathcal {D}t=\partial /\partial t + (\boldsymbol {U}\boldsymbol {\cdot }\boldsymbol {\nabla })$ is the base-flow-based substantial derivative.
We are interested in the  $T$-periodic near-wake flow at $Re\sim Re_B$, for which ${\boldsymbol {U}(\boldsymbol {r},t+T)=\boldsymbol {U}(\boldsymbol {r},t)}$ and $P(\boldsymbol {r},t+T)=P(\boldsymbol {r},t)$. Hence, according to Floquet theory, we seek small three-dimensional perturbations of the velocity $\boldsymbol {u}'(\boldsymbol {x},t)=(u' , v' , w')$ and the pressure $p'(\boldsymbol {x},t)$ in the form
 \begin{align} \boldsymbol{u}'(\boldsymbol{x},t)&=\tau(t)\left[\boldsymbol{u}_{p}(\boldsymbol{r},t)\cos(\gamma z)+ \boldsymbol{w}_{p}(\boldsymbol{r},t)\sin(\gamma z)\right],\notag\\ p'(\boldsymbol{x},t)&=\tau(t)p_{p}(\boldsymbol{r},t)\cos(\gamma z). \end{align}
To ensure the validity of a linear analysis, we assume that  $\tau (t)=\tau _0\exp (\sigma t)\ll 1$, $\tau _0=\mathrm {const.}$; and $\boldsymbol {u}_{p}(\boldsymbol {r},t)=(u_{p}, v_{p},0)$, $\boldsymbol {w}_{p}(\boldsymbol {r},t)=(0, 0, w_{p})$ and $p_{p}(\boldsymbol {r},t)$ are $T$-periodic functions, which satisfy the linearised Navier–Stokes equations:
 \begin{cases} \boldsymbol{\nabla}\boldsymbol{\cdot}\boldsymbol{u}_{p}+\gamma w_{p}= 0, \\ \dfrac{\mathcal{D}\boldsymbol{u}_{p}}{ \mathcal{D}t}={-}{{\boldsymbol{\mathsf{E}}}} \boldsymbol{\cdot} \boldsymbol{u}_{p}-\dfrac{1}{2}\boldsymbol{\varOmega}\times\boldsymbol{u}_{p} -\boldsymbol{\nabla}p_{p}+\dfrac{1}{Re} \nabla^2\boldsymbol{u}_{p} - \left(\sigma+\dfrac{\gamma^2}{Re}\right) \boldsymbol{u}_{p}, \\ \dfrac{\mathcal{D}w_{p}}{ \mathcal{D}t} = \gamma p_{p}+\dfrac{1}{Re}\nabla^2w_{p} -\left(\sigma+\frac{\gamma^2}{Re}\right) w_{p}. \end{cases}
Here,  $\sigma =\sigma _{r}+\mathrm {i}\sigma _{i}$; ${{\boldsymbol{\mathsf{E}}}}(\boldsymbol {r},t)$ and $\boldsymbol {\varOmega }(\boldsymbol {r},t) = \varOmega (\boldsymbol {r},t) \boldsymbol {e}_z$ are the base-flow strain rate tensor and vorticity vector, respectively; we also used the relation $(\boldsymbol {u}_{p}\boldsymbol {\cdot }\boldsymbol {\nabla })\boldsymbol {U}={{\boldsymbol{\mathsf{E}}}}\boldsymbol {\cdot }\boldsymbol {u}_{p}+ (\boldsymbol {\varOmega }/2)\times \boldsymbol {u}_{p}$. Note that the operator $\nabla ^2$ here is effectively two-dimensional because all the functions involved are independent of $z$, and the spanwise diffusion of momentum ( $Re^{-1}\partial ^2\boldsymbol {u}'/\partial z^2$) is represented by the terms $-\gamma ^2Re^{-1}\boldsymbol {u}_{p}$ and $-\gamma ^2Re^{-1}w_{p}$. Perturbations are assumed to satisfy homogeneous boundary conditions.
To explore the behaviour of the perturbations in the short-wavelength limit, we expand the solution of (2.3) in inverse powers of  $\gamma$ at $\gamma \gg 1$, using the fact that the solution must be invariant to changes in the sign of $\gamma$:
 $$\begin{align} \boldsymbol{u}_{p}(\boldsymbol{r},t)&=\boldsymbol{u}_0(\boldsymbol{r},t) +\gamma^{{-}2}\boldsymbol{u}_2(\boldsymbol{r},t)+ O(\gamma^{{-}4}), \end{align}$$
 $$\begin{align}w_{p}(\boldsymbol{r},t)&= \gamma^{{-}1} w_1(\boldsymbol{r},t) + \gamma^{{-}3} w_3(\boldsymbol{r},t) + O(\gamma^{{-}5}), \end{align}$$
 $$\begin{align}p_{p}(\boldsymbol{r},t) &=p_0(\boldsymbol{r},t) +\gamma^{{-}2} p_2(\boldsymbol{r},t) +O(\gamma^{{-}4}), \end{align}$$
 $$\begin{align}\sigma' &=\sigma+\frac{\gamma^2}{Re}=\sigma_{0} +\gamma^{{-}2}\sigma_{2}+ O(\gamma^{{-}4}). \end{align}$$
(This expansion is motivated by the relative behaviour of different components of the perturbation velocity at large  $\gamma$ and discussed in § 2.2.) The spanwise momentum equation (2.3c) implies that $p_0(\boldsymbol {r},t)=0$. Thus, for $\gamma \gg 1$, the leading-order terms satisfy the system
 \begin{cases} \boldsymbol{\nabla}\boldsymbol{\cdot}\boldsymbol{u}_{0}+w_{1}= 0, \\ \dfrac{\mathcal{D}\boldsymbol{u}_{0}}{ \mathcal{D}t}={-}{{\boldsymbol{\mathsf{E}}}} \boldsymbol{\cdot} \boldsymbol{u}_0-\dfrac{1}{2}\boldsymbol{\varOmega}\times\boldsymbol{u}_0 +\dfrac{1}{Re}\nabla^2\boldsymbol{u}_{0}- \sigma_0 \boldsymbol{u}_{0}, \\ \dfrac{\mathcal{D}w_{1}}{ \mathcal{D}t} = p_{2}+\dfrac{1}{Re}\nabla^2w_{1} -\sigma_0 w_{1}. \end{cases}
Note that (2.5b) for the in-plane velocity  $\boldsymbol {u}_0$ and the growth rate $\sigma _0$ are uncoupled from the other equations in (2.5). Furthermore, the spanwise flow, $w_1$, can be seen to be generated by $\boldsymbol {u}_0$ through the continuity equation (2.5a); the pressure distribution $p_2$ is then explicitly given as a function of $w_1$ in (2.5c). We note that this is a key difference to the case of the mode A instability at $\gamma \ll 1$, where the equation for the spanwise velocity is uncoupled and is mainly driven by the base-flow pressure fluctuations (Aleksyuk & Heil Reference Aleksyuk and Heil2023).
2.2. Dominant Floquet modes
We computed the base flow  $(\boldsymbol {U},P)$ and the small perturbations $(\boldsymbol {u}',p')$ using a second-order stabilised finite-element method on a triangulated domain $[-30, 50]\times [-30,30]$. The dominant Floquet modes $\hat {\boldsymbol {u}}(\boldsymbol {r},t)=\tau (t)\boldsymbol {u}_{p}(\boldsymbol {r},t)$, $\hat {w}(\boldsymbol {r},t)=\tau (t)w_{p}(\boldsymbol {r},t)$ and $\hat {p}(\boldsymbol {r},t)=\tau (t)p_{p}(\boldsymbol {r},t)$, and the growth rate $\sigma$ were sought as a solution of the system
 \begin{cases} \boldsymbol{\nabla}\boldsymbol{\cdot}\hat{\boldsymbol{u}}+\gamma \hat{w}= 0, \\ \dfrac{\mathcal{D}\hat{\boldsymbol{u}}}{ \mathcal{D}t}={-}{{\boldsymbol{\mathsf{E}}}} \boldsymbol{\cdot} \hat{\boldsymbol{u}}-\dfrac{1}{2}\hat{\boldsymbol{\varOmega}}\times\hat{\boldsymbol{u}} -\boldsymbol{\nabla} \hat{p}+\dfrac{1}{Re} \nabla^2\hat{\boldsymbol{u}} - \dfrac{\gamma^2}{Re} \hat{\boldsymbol{u}},\\ \dfrac{\mathcal{D}\hat{w}}{ \mathcal{D}t} = \gamma \hat{p}+\dfrac{1}{Re}\nabla^2\hat{w} -\dfrac{\gamma^2}{Re} \hat{w}, \end{cases}
with homogeneous boundary conditions, using Arnoldi iterations (Barkley & Henderson Reference Barkley and Henderson1996). Details of the algorithms, computational parameters and validation are given by Aleksyuk & Heil (Reference Aleksyuk and Heil2023). To prevent numerical issues that may arise at high values of  $\gamma$ due to the $\gamma ^2$ factor in the last terms of (2.6b) and (2.6c), we exploit that the solution of (2.6) has the same periodic parts $\boldsymbol {u}_{p}$, $w_{p}$ and $p_{p}$ (up to a constant factor) as the solution of the equations
 \begin{cases} \boldsymbol{\nabla}\boldsymbol{\cdot}\hat{\boldsymbol{u}}+\gamma \hat{w}= 0, \\ \dfrac{\mathcal{D}\hat{\boldsymbol{u}}}{ \mathcal{D}t}={-}{{\boldsymbol{\mathsf{E}}}} \boldsymbol{\cdot} \hat{\boldsymbol{u}}-\dfrac{1}{2}\hat{\boldsymbol{\varOmega}}\times\hat{\boldsymbol{u}} -\boldsymbol{\nabla} \hat{p}+\dfrac{1}{Re} \nabla^2\hat{\boldsymbol{u}},\\ \dfrac{\mathcal{D}\hat{w}}{ \mathcal{D}t} = \gamma \hat{p}+\dfrac{1}{Re}\nabla^2\hat{w}, \end{cases}
in which this term has been omitted. Physically, the change from (2.6) to (2.7) removes the stabilising effect of the spanwise viscous diffusion (represented by the term  $-\gamma ^2Re^{-1}\hat {\boldsymbol {u}}$) and results in a change of the actual growth rate $\sigma$ to $\sigma '=\sigma +\gamma ^2/Re$. (Since the functions involved in these equations are independent of $z$, the operator $\nabla ^2$ does not produce terms with $z$-derivatives.)
As an example, figure 1(a) shows the dependence of the dominant Floquet multiplier  $\mu =\exp (\sigma T)$ (which is real for mode B) on the wavelength $\lambda =2{\rm \pi} /\gamma$ at ${Re = 240}, 260, 280$ and $300$. Since our focus is on mode B instability, we omit Floquet multipliers associated with other modes, including large-wavelength mode A and quasi-periodic modes; see, e.g., Barkley & Henderson (Reference Barkley and Henderson1996). Figure 1(a) also compares $\mu$ with the data by Barkley & Henderson (Reference Barkley and Henderson1996) and Carmo et al. (Reference Carmo, Sherwin, Bearman and Willden2008). If, for a given $Re$, there is at least one $\lambda$ with $|\mu |>1$, the flow is unstable. Over the range of wavelengths considered here, the flow can be seen to be stable at $Re=240$, (approximately) neutrally stable at $Re \approx 260$ and unstable at $Re=280$ and $300$.
The corresponding plot of the modified growth rate  $\sigma '$ in figure 1(b) shows that the flow stabilisation at small wavelengths is solely due to the action of spanwise viscous diffusion – without this effect, the flow would remain unstable as $\lambda \to 0$.
The behaviour of the eigenfunction over half of the period is illustrated in figure 1(c) for  $Re=260$ and $\gamma =7.5$. The boundary between stretching- and rotation-dominated regions (also called hyperbolic and elliptic regions) is shown by the solid black line, which corresponds to the isoline $\kappa = 1$, where $\kappa = 2S/|\varOmega |$, $S$ being the positive eigenvalue of the base flow strain rate tensor ${{\boldsymbol{\mathsf{E}}}}$. The magnitude $|\boldsymbol {u}_{p}|$ shows that the perturbations mainly concentrate in stretching-dominated regions. After each cycle of the base-flow oscillation, the pattern of the perturbations is repeated, while their magnitude is changed by a constant factor, the Floquet multiplier $\mu$; see (2.2). In figure 1(c), we also show the closed trajectories 1, 2, 3 and 6 in the base flow using the enumeration adopted by Giannetti et al. (Reference Giannetti, Camarri and Luchini2010), Giannetti (Reference Giannetti2015) and Jethani et al. (Reference Jethani, Kumar, Sameen and Mathur2018). (We omitted orbits 4 and 5 (located closer to the body) to ensure a clearer visualisation.) The figure shows that particles that move along trajectories 2 and 3 are passing through the braid regions where perturbations are known to undergo significant amplification (Williamson Reference Williamson1996a; Leweke & Williamson Reference Leweke and Williamson1998; Thompson, Leweke & Williamson Reference Thompson, Leweke and Williamson2001; Aleksyuk & Shkadov Reference Aleksyuk and Shkadov2018). In figure 1(c), this amplification is evidenced by the intensive darkening of the greyscale contours, representing the magnitude of the in-plane perturbation velocity $|\boldsymbol {u}_{p}|$ over the interval $0.1\lesssim t\lesssim 0.4$.
Our numerical results allow us to check the consistency of the expansion (2.4). For this purpose, we show in figure 2 that the ratio  $\chi ={\left \lVert w _{p}\right \rVert }/{\left\lVert{u_{p}}\right\rVert}$ does behave as a linear function of $\lambda$ as $\lambda \rightarrow 0$, as implied by (2.4a) and (2.4b) ( $\left \lVert \cdot \right \rVert$ is the $L^2$-norm calculated in the rectangle $[0.5, 2]\times [-1.5,1.5]$, the region where the perturbations grow most rapidly). This is of particular interest since in the inviscid centrifugal instability mechanism, which is one of the existing hypotheses for the onset of the mode B instability, the perturbations are predicted to have a different asymptotic behaviour, namely $\left \lVert w '\right \rVert /\left \lVert u '\right \rVert =O(\gamma ^{-1/2})$ and $\sigma '=\sigma _0+\sigma _1\gamma ^{-1}+\ldots$ as $\gamma \rightarrow \infty$; see Bayly (Reference Bayly1988) and Sipp, Lauga & Jacquin (Reference Sipp, Lauga and Jacquin1999).
The ratio  $\chi ={\left \lVert w _{p}\right \rVert }/{\left \lVert u _{p}\right \rVert }$ at $Re=260$: the circles represent the values obtained from the numerical simulations; the solid line is the linear fit to the first three non-zero points, $\chi ^{[fit]}=1.764\lambda +0.003$.

3. Key mechanisms governing the development of mode B perturbations
3.1. Overview of basic mechanisms
We discuss the physical mechanisms that govern the development of small three-dimensional perturbations in terms of the in-plane perturbation vorticity  $\boldsymbol {\zeta }$. For this purpose, we represent the three-dimensional perturbation velocity, $\boldsymbol {u}'$, and its vorticity ( $\boldsymbol {\omega }'=\boldsymbol {\nabla }\times \boldsymbol {u}'$) as
 $$\begin{gather} \boldsymbol{u}'\left(\boldsymbol{x}, t\right)=\tau_0\left[\boldsymbol{v}\cos(\gamma z)+\gamma^{{-}1} \boldsymbol{v}_z\sin(\gamma z)\right]\exp\left(-\frac{\gamma^2}{Re}t\right), \end{gather}$$
 $$\begin{gather}{}\boldsymbol{\omega}'\left(\boldsymbol{x}, t\right)= \tau_0\left[\gamma\boldsymbol{\zeta}\sin(\gamma z)+ \left(\boldsymbol{\nabla}\times\boldsymbol{v}\right)\cos(\gamma z)\right] \exp\left(-\frac{\gamma^2}{Re}t\right), \end{gather}$$
where  $\boldsymbol {v}(\boldsymbol {r},t)=(v_x,v_y,0)$, $\boldsymbol {v}_z(\boldsymbol {r},t)=(0,0,v_z)$ and $\boldsymbol {\zeta }(\boldsymbol {r},t)=(\zeta _x,\zeta _y,0)$. The $\gamma$-factors are introduced to reflect the expected order of the terms for $\gamma \gg 1$, so that the vectors $\boldsymbol {v}$, $\boldsymbol {v}_z$ and $\boldsymbol {\zeta }$ are of order $O(1)$ (see § 2.1). According to the relations in (2.2), these vectors can also be expressed as a product of time-periodic functions and the exponential function $\exp {(\sigma ' t)}$. Note that we use the modified growth rate $\sigma '$ since the factor $\exp (-\gamma ^2t/Re)$ in (3.1) and (3.2) already accounts for the effect of spanwise viscous diffusion, effectively eliminating the corresponding terms from the equations below (similar to the change from (2.6) to (2.7) above).
The perturbations to the in-plane vorticity,  $\boldsymbol {\zeta }$, and velocity, $\boldsymbol {v}$, satisfy the vorticity transport equation
 \begin{equation} \dfrac{\mathcal{D}\boldsymbol{\zeta}}{ \mathcal{D}t}=\underbrace{{{\boldsymbol{\mathsf{E}}}} \boldsymbol{\cdot} \boldsymbol{\zeta}}_{stretching}\underbrace{+\frac{1}{2}\boldsymbol{\varOmega}\times\boldsymbol{\zeta}}_{rigid~rotation} \underbrace{+\frac{1}{Re}\nabla^{2} \boldsymbol{\zeta}}_{viscous~diffusion} \underbrace{-\varOmega \boldsymbol{v}}_{tilting} \end{equation}
and the relation
 \begin{equation} \boldsymbol{\zeta}=(v_y,-v_x,0)+\gamma^{{-}2}\boldsymbol{\nabla}\times\boldsymbol{v}_z, \end{equation}
which follows from the definition of the vorticity. Each term on the right-hand side of (3.3) has a clear physical interpretation: vortex stretching by the base flow strain field  ${{\boldsymbol{\mathsf{E}}}}$; a rigid body rotation of a fluid particle by (half of) the base flow vorticity $\boldsymbol {\varOmega }$; in-plane viscous diffusion of the perturbation vorticity; and base flow vortex tilting due to spanwise shear.
One can interpret the linearised equation using a Lagrangian point of view: specifically, (3.3) describes the physical mechanisms which contribute to perturbations of the vorticity of a fluid particle. The action of the first two mechanisms (stretching and rigid rotation) are purely local. Spatial interactions between perturbations only arise through the viscous diffusion and tilting mechanisms. The former depends on the local distribution of perturbations, while the latter describes non-local interactions since  $\boldsymbol {v}$ is affected by $\boldsymbol {\zeta }$ everywhere in the flow (in a manner similar to Biot–Savart induction; see Aleksyuk & Heil (Reference Aleksyuk and Heil2023) and § 3.2 below).
Among the mechanisms governing the evolution of perturbations, only the spanwise viscous diffusion and the tilting mechanism explicitly depend on  $\gamma$. The stabilising effect of the spanwise viscous diffusion is taken into account by the relations (3.1) and (3.2). Consequently, the dependence of $\sigma '$ on the wavelength $\lambda =2{\rm \pi} /\gamma$ in figure 1(b) is determined exclusively by the tilting mechanism. As already discussed, without the spanwise viscous diffusion, the flow would be unstable ( $\sigma '>0$) for the whole range of $\lambda$ and $Re$ considered, and would, in fact, tend to be more unstable at shorter wavelengths; see figure 1(b). Hence, the suppression of short-wavelength perturbations can be attributed solely to the stabilising contribution of the spanwise diffusion, which tends to infinity as $\lambda \rightarrow 0$. Conversely, for larger wavelengths ( $\lambda >\lambda _B$), the tilting mechanism contributes to the stabilisation of the flow: $\sigma '$ decreases with an increase in $\lambda$; see figure 1(b).
3.2. Short-wavelength limit
Figure 3 shows snapshots of the distribution of the in-plane perturbation velocity at  ${Re=260}$ for various $\lambda$. We note that, despite the profound variation of the Floquet multiplier $\mu$ with $\lambda$, the spatial pattern of perturbations remains similar over the whole range of $\lambda$ where mode B dominates, including the limiting case $\lambda =0$. This is partially explained by the fact that, as discussed above, the spanwise viscous diffusion, which we have just shown to be a key factor influencing $\mu$ in the limit as $\lambda \to 0$, does not affect the spatial distribution of the perturbations. The change in wavelength only has a modest effect on the distribution of the perturbations immediately downstream of the cylinder; the main effect of a reduction in $\lambda$ is to make the perturbations slightly more localised. However, the overall pattern remains remarkably insensitive to changes in $\lambda$, particularly in the region highlighted with the yellow box within which the perturbations are intensively amplified.
The spatial distribution of mode B perturbations at  $Re=260$ and $0\leqslant \lambda <1$: in-plane ( $z=0$) perturbation velocity $\boldsymbol {v}$ (arrows) and its magnitude $v$ (greyscale colour contours: the darker the colour, the greater the value). Solid lines are isolines $\kappa = 1$ (the boundaries of the elliptic regions). The perturbation velocity is normalised so that the maximum of $v$ equals one. All plots are snapshots at $t=0.1T$.

The fact that the spatial distribution of the perturbations changes very little as  ${\lambda \to 0}$ suggests that the limiting solution $\boldsymbol {v}_0$ can be used to explain the key mechanisms driving the instability. According to (2.5b) (and the connection $\boldsymbol {u}_0=\boldsymbol {v}_0\exp {(-\sigma _0t)}$), $\boldsymbol {v}_0$ is governed by the equation
 \begin{equation} \dfrac{\mathcal{D}\boldsymbol{v}_{0}}{ \mathcal{D}t}={-}{{\boldsymbol{\mathsf{E}}}} \boldsymbol{\cdot} \boldsymbol{v}_0-\frac{1}{2}\boldsymbol{\varOmega}\times\boldsymbol{v}_0 +\frac{1}{Re}\nabla^2\boldsymbol{v}_{0}. \end{equation}
Using the fact that  $\boldsymbol {\zeta }_0=(v_{0y},-v_{0x},0)$ (see (3.4)), we can rewrite this in terms of the in-plane vorticity $\boldsymbol {\zeta }_0$ as
 \begin{equation} \dfrac{\mathcal{D}\boldsymbol{\zeta}_0}{ \mathcal{D}t}= {{\boldsymbol{\mathsf{E}}}} \boldsymbol{\cdot} \boldsymbol{\zeta}_0-\frac{1}{2}\boldsymbol{\varOmega}\times\boldsymbol{\zeta}_0 +\frac{1}{Re}\nabla^{2} \boldsymbol{\zeta}_0. \end{equation}
Comparing this equation with (3.3) for finite values of  $\gamma$ shows that in the limit ${\gamma \rightarrow \infty}$, there are no non-local interactions due to tilting: the tilting mechanism becomes completely localised and results in a switch in the direction of the rigid rotation, i.e. the sign of $\boldsymbol {\varOmega }$ in the second term on the right-hand side changes.
We can visualise the disappearance of the tilting-related non-local interactions with increasing  $\gamma$ by considering the equation describing the variation of $\zeta ^2=\boldsymbol {\zeta }\boldsymbol {\cdot }\boldsymbol {\zeta }$,
 \begin{equation} \frac{1}{2}\dfrac{\mathcal{D}\zeta^2}{ \mathcal{D}t}= \underbrace{\boldsymbol{\zeta}\boldsymbol{\cdot}{{\boldsymbol{\mathsf{E}}}} \boldsymbol{\cdot} \boldsymbol{\zeta}}_{stretching} \underbrace{+\frac{1}{Re}\left(\boldsymbol{\zeta}\boldsymbol{\cdot}\nabla^{2} \boldsymbol{\zeta}\right)}_{viscous\ diffusion} \underbrace{+ \int_{D}\mathcal{T}(\boldsymbol{r},\boldsymbol{r}', t)\,{\rm d}\boldsymbol{r}'}_{tilting}, \end{equation}
which follows from (3.3). Here, we expressed the action of the tilting mechanism ( $-\varOmega \boldsymbol {\zeta }\boldsymbol {\cdot }\boldsymbol {v}$) using the function $\mathcal {T}(\boldsymbol {r},\boldsymbol {r}',t)$,
 \begin{equation} \mathcal{T}(\boldsymbol{r},\boldsymbol{r}',t) ={-}G_\gamma(\boldsymbol{r}, \boldsymbol{r}') \varOmega(\boldsymbol{r}, t)\boldsymbol{\zeta}(\boldsymbol{r}, t)\boldsymbol{\cdot}\left[\gamma^2 \boldsymbol{\zeta}_{\bot}\left(\boldsymbol{r}',t\right)+\boldsymbol{\zeta}_{\varDelta}\left(\boldsymbol{r}',t\right)\right], \end{equation}
which depends on Green's function  $G_\gamma (\boldsymbol {r}, \boldsymbol {r}')$ of the screened Poisson equation
 \begin{equation} \nabla^2\boldsymbol{v}-\gamma^2\boldsymbol{v}=\gamma^2\boldsymbol{\zeta}_{\bot}+\boldsymbol{\zeta}_{\varDelta}, \end{equation}
where
 \begin{align} \boldsymbol{\zeta}(\boldsymbol{r},t)=(\zeta_x,\zeta_y,0),\quad \boldsymbol{\zeta}_{\bot}(\boldsymbol{r}, t)=\left(\zeta_{y},-\zeta_{x},0 \right),\quad \boldsymbol{\zeta}_{\varDelta}(\boldsymbol{r}, t)=\left(-\boldsymbol{\nabla}\boldsymbol{\cdot} \frac{\partial\boldsymbol{\zeta}}{\partial y}, \boldsymbol{\nabla} \boldsymbol{\cdot}\frac{\partial\boldsymbol{\zeta}}{\partial x},0\right); \end{align}
see Aleksyuk & Heil (Reference Aleksyuk and Heil2023) for details. Equation (3.7) shows that at fixed  $t$, the function $\mathcal {T}(\boldsymbol {r},\boldsymbol {r}',t)$ describes the contribution that perturbations at point $\boldsymbol {r}'$ make to the growth or decay of the magnitude of the perturbations $\boldsymbol {\zeta }$ at point $\boldsymbol {r}$.
We can, therefore, use (3.8) to elucidate how the non-local tilting mechanism affects the magnitude of  $\boldsymbol {\zeta }$ at fluid particles that move along the closed trajectories $\boldsymbol {\varGamma }_i(t)$ ( $i=1,2,\ldots$) in the base flow. (Recall that in the inviscid analysis of Giannetti et al. (Reference Giannetti, Camarri and Luchini2010), Giannetti (Reference Giannetti2015) and Jethani et al. (Reference Jethani, Kumar, Sameen and Mathur2018), some of these orbits are interpreted as a signature of the instability.) We do this in figure 4 for the particle (shown by the cyan symbol) that moves along the trajectory $\boldsymbol {\varGamma }_3(t)$, for a Reynolds number of $Re=300$. The black lines in figure 4 show the isoline of the periodic part of the perturbations to the vorticity, $\zeta /\exp {(\sigma ' t)}$, for $\gamma = 7.5$. The five snapshots (covering half a period of the time-periodic base flow) in figure 4(a) show the spatial distribution of $\mathcal {T}(\boldsymbol {\varGamma }_3(t),\boldsymbol {r}',t)$ as a function of $\boldsymbol {r}'$, using red/blue contours for positive/negative values of $\mathcal {T}$. The plot shows that the regions from which the tilting mechanism significantly affects the growth of $\zeta ^2/2$ at point $\boldsymbol {\varGamma }_3(t)$ are close to that point; regions of positive and negative influence alternate, and both regions are elongated and aligned with the narrow region in which the perturbations are largest.
The contribution of perturbation to their growth or decay at a given fluid particle (point  $\boldsymbol {r}$ marked by a white circle) through the non-local tilting mechanism at $Re=300$: (a) time evolution at $\gamma =7.5$; (b) effect of $\gamma$ at $t=0.1T$. Black lines are isolines of the periodic part of perturbations to the vorticity, i.e. $\zeta /\exp {(\sigma ' t)}$; blue and red colour contours show the periodic part of the contribution due to tilting, i.e. $\mathcal {T}(\boldsymbol {r},\boldsymbol {r}',t)/\exp {(2\sigma ' t)}$ (red/blue colour indicates positive/negative contribution). Red lines highlight the isolines of Green's function $G_\gamma (\boldsymbol {r}, \boldsymbol {r}')=-2\times 10^{-3}$ and $-2\times 10^{-5}$; the cyan line shows orbit 3.

The fact that only perturbations in the neighbourhood of  $\boldsymbol {\varGamma }_3(t)$ significantly affect the growth of perturbations at that point can be attributed to the rapid decay of Green's function $G_\gamma (\boldsymbol {r}, \boldsymbol {r}')$ with the distance $|\boldsymbol {r}- \boldsymbol {r}'|$ in (3.8). This is illustrated by the red lines in figure 4, which represent isolines $G_\gamma (\boldsymbol {\varGamma }_3(t),\boldsymbol {r}') = c$ for $c=-2\times 10^{-3}$ (inner line) and $c=-2\times 10^{-5}$ (outer line), respectively. The isolines are nearly circular and approximately centred at $\boldsymbol {\varGamma }_3(t)$; their spacing shows that, for the parameter values chosen here, a doubling of the distance from $\boldsymbol {\varGamma }_3(t)$ reduces the strength of the tilting effect by two orders of magnitude.
To assess the effect of variations in  $\gamma$, the plots in figure 4(b) show the same information as in figure 4(a); however, we now show the snapshots at the same fixed time ( $t = 0.1T)$, but for different values of $\gamma$. As $\gamma$ increases, the magnitude of $\mathcal {T}$ decreases, and the isolines can be seen to contract. This indicates a stronger localisation of the tilting effect, which ultimately leads to the disappearance of the non-local interactions, consistent with our predictions from the limiting case for $\gamma \rightarrow \infty$, where tilting acts as a rigid rotation and does not contribute to the change in the magnitude of the perturbations.
4. The role of in-plane viscous diffusion
We have now established that the pattern of the perturbations can be understood using the limiting solution  $\boldsymbol {v}_0$ as $\gamma \rightarrow \infty$. In this limit, the non-local spatial interactions are absent, and only stretching and in-plane viscous diffusion can cause the growth of perturbations in the flow. While it is well known (Williamson Reference Williamson1996a; Leweke & Williamson Reference Leweke and Williamson1998; Thompson et al. Reference Thompson, Leweke and Williamson2001; Aleksyuk & Shkadov Reference Aleksyuk and Shkadov2018) that stretching plays a vital role in amplifying mode B perturbations in braid shear layers, the role of in-plane viscous diffusion remains unclear.
Equation (3.5) shows that, in the limit  $\gamma \rightarrow \infty$, viscous diffusion is solely responsible for the interaction of perturbations in different fluid particles. This is because in the absence of viscous diffusion, i.e. when the in-plane perturbations to the velocity satisfy the equation
 \begin{equation} \dfrac{\mathcal{D}\boldsymbol{v}_{0}}{ \mathcal{D}t}={-}{{\boldsymbol{\mathsf{E}}}} \boldsymbol{\cdot}\boldsymbol{v}_0-\frac{1}{2}\boldsymbol{\varOmega}\times\boldsymbol{v}_0, \end{equation}
the perturbations in each individual particle develop independently. Given the convective nature of the flow, all initial perturbations are then swept downstream, except those developing on fluid particles that are advected along closed trajectories in the base flow, where they can continue to grow – this is the essence of the analyses by Giannetti (Reference Giannetti2015) and Jethani et al. (Reference Jethani, Kumar, Sameen and Mathur2018).
While the presence of closed trajectories in the base flow thus allows the development of short-wavelength instabilities in the absence of viscous diffusion, it is not clear if the reverse is true too. To assess this possibility, we analyse the growth of perturbations employing a variant of Barkley's (Reference Barkley2005) confined Floquet stability analysis in which we solve (2.7) in a finite domain containing the region of interest – here, the region immediately downstream of the cylinder. For this purpose, we perform the Floquet analysis of (2.7) using the pre-computed numerical solution for the base flow, but only analyse the development of perturbations in the subdomain shown by the blue boundaries in figure 5(b) along which we impose homogeneous boundary conditions for the perturbations, thus isolating this region from perturbations generated elsewhere in the domain. To assess the importance of the closed trajectories in the development of perturbations, we introduce two artificial splitter plates (of non-dimensional thickness 0.05, located on the symmetry line  $y=0$) that only act on the perturbations by imposing $\boldsymbol {v}_0=\boldsymbol {0}$ on their surface, thus suppressing the advection and diffusion of perturbations across them. We position the splitter plates such that they leave a gap between the upper and lower halves of the fluid domain, but place them so that they intersect the orbits. The equation for the rate at which the magnitude of the perturbation velocity, $v_0 = |\boldsymbol {v}_0|$, changes follows from (3.5) and is given by
 \begin{equation} \underbrace{\frac{\mathcal{D}\ln v_0}{\mathcal{D} t}}_{{advection}} =\underbrace{-\frac{\boldsymbol{v}_0 \boldsymbol{\cdot}\boldsymbol{E} \boldsymbol{\cdot}\boldsymbol{v}_0}{{v}_0^2}}_{{stretching}} \underbrace{+\frac{1}{Re} \frac{\boldsymbol{v}_0\boldsymbol{\cdot}\nabla^2\boldsymbol{v}_0}{{v}_0^2}}_{{viscous\ diffusion}}. \end{equation}
It shows that in the limit as  $\gamma \to \infty$, only viscous diffusion remains as the mechanism by which growing perturbations can remain localised near the cylinder, rather than being advected downstream.
Floquet stability analysis in the (a) entire and (b) confined domains at  $Re=260$ and $\gamma \rightarrow \infty$: greyscale colour contours show the magnitude of the periodic part of the perturbation velocity ${|\boldsymbol {u}_0|=|\boldsymbol {v}_0|\exp (-\sigma _0t)}$ (the darker the colour, the greater the value); orange lines show an isoline $|\boldsymbol {u}_0|=\textrm {const}$ obtained with the Floquet analysis in the entire domain. The actual boundaries of the computational domains are shown by blue lines — in panel (b), the Floquet analysis is carried out in the region $[0.5,5]\times [-1.5,1.5]$ with two perturbation splitter plates $[0.5,1.0]\times [-0.025, 0.025]$ and $[1.45,5]\times [-0.025,0.025]$. Hatched green regions indicate intensive growth of perturbations due to stretching: $-\boldsymbol {v}_0\boldsymbol {\cdot } {{\boldsymbol{\mathsf{E}}}} \boldsymbol {\cdot } \boldsymbol {v}_0/{v}_0^2\geqslant 1.6$. Elliptic regions, $\kappa >1$, are shown in pale blue and red colour, corresponding to negative and positive $\varOmega$, respectively. Thin solid lines are orbits 1, 2, 3 and 6. The insets in panel (b) show the base-flow velocity field near the gap between the perturbation splitter plates.

The two columns in figure 5 illustrate the evolution of the perturbations (in terms of the periodic part of perturbations  $\boldsymbol {u}_0=\boldsymbol {v}_0\exp (-\sigma _0t)$) in the full domain (left) and in the confined domain with the perturbation splitter plates (right) at a Reynolds number of ${Re=260}$. The pale blue and red regions in figure 5(a) identify the elliptic regions ( $\kappa >1$) to illustrate the position of the shed vortices in the base flow. The hatched green regions in figure 5(a) show where $-\boldsymbol {v}_0\boldsymbol {\cdot } {{\boldsymbol{\mathsf{E}}}} \boldsymbol {\cdot } \boldsymbol {v}_0/{v}_0^2\geqslant 1.6$, and thus identify the regions where stretching contributes strongly to an increase in the magnitude of the perturbations. The regions can be seen to be located primarily in the braid shear layers which form during the vortex separation process in the base flow (when $0.1T\lesssim t \lesssim 0.4T$ during the half-period shown in figure 5). This is consistent with the results by Williamson (Reference Williamson1996a), Leweke & Williamson (Reference Leweke and Williamson1998), Thompson et al. (Reference Thompson, Leweke and Williamson2001) and Aleksyuk & Shkadov (Reference Aleksyuk and Shkadov2018) referred to above.
The greyscale contours in figure 5(a) illustrate how the combination of advection, diffusion and amplification (by stretching) distributes the perturbations throughout the domain. The orange line (duplicated in the right column to facilitate a comparison) is an isoline of the magnitude of the periodic part of the perturbation velocity,  $|\boldsymbol {u}_0| = \textrm {{const}}$.
The right column in figure 5(b) shows the results of the confined Floquet analysis of (2.7) in the domain with the perturbation splitter plates. The base flow velocity vectors shown as insets illustrate the direction in which perturbations are advected by the base flow. The regions where the perturbations grow most rapidly due to stretching are again identified by hatched green areas. They remain similar to those observed without the splitter plates, whose main effect is the suppression of advection and diffusion of the perturbations between the upper and lower halves of the domain. While this disrupts the pattern of the perturbations downstream of the gap between the splitter plates (compare the greyscale contours representing the magnitude of the perturbations with the orange isoline, which is copied from the results of the full Floquet analysis in the left column), this has little overall effect on the instability – in this part of the domain, the perturbations are simply advected downstream by the base flow without providing any feedback to the region further upstream. The key observation is that, even though the splitter plates disrupt the advection of the perturbations along the orbits in the base flow, viscous diffusion leads to sufficient spreading of the perturbations so that there are volumes of fluid that are advected between the upper and lower halves of the domain in a way that exposes them to stretching-induced growth during both halves of the vortex-shedding period. The presence of the perturbation splitter plates reduces the modified growth rate from  $\sigma '=0.37$ without the splitter plates to $\sigma '=0.05 > 0$, implying that, in the presence of viscous diffusion, the advection of the growing perturbation along orbits is not necessary to reproduce both the mode B pattern after each cycle of the base flow oscillations and its instability.
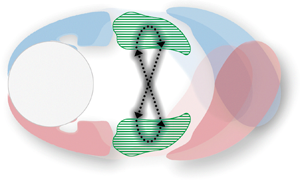
Hence, the conceptual explanation of the mechanisms underlying the mode B instability can be reduced to three components: (i) the amplification of perturbations on both sides of the wake (in the braid regions where the rotation-dominated region,  $\kappa <1$, breaks into two parts); and the feedback composed of (ii) transverse advection and (iii) viscous diffusion, which jointly interlink the amplification events. This is schematically depicted in figure 6.
Conceptual scheme highlighting the periodic amplification of perturbations linked by advective and diffusive transfer (feedback).

To assess the significance of the transverse advection of the perturbations, figure 7 shows the growth rates from further numerical experiments in which we use a single perturbation splitter plate occupying the region  $x_s \leqslant x \leqslant x_e$. In figure 7(a), we keep $x_s=0.5$, thus keeping the left end of the splitter plate attached to the cylinder while increasing its length; conversely, in figure 7(b), we keep the right end at $x_e=1.8$ (the downstream end of the region within which we perform our confined Floquet analysis) and move the plate's left end towards the cylinder. The yellow-shaded regions show the streamwise extent of the various orbits in the base flow. We find that the modified growth rate of the instability decreases significantly when the transverse advection is suppressed in the region ${1\lesssim x\lesssim 1.6}$, identifying this as the key region for the periodic advective transport of the growing perturbations between the regions of strong stretching.
Confined Floquet stability analysis in the region  $[0.5,5]\times [-1.5,1.5]$ with a single perturbation splitter plate $[x_s,x_e]\times [-0.025,0.025]$ at $Re=260$ and $\gamma \rightarrow \infty$. Panels (a,b) show the dependence of the growth rate on the location of the right ( $x_e$) and left ( $x_s$) edges, while fixing $x_s=0.5$ and $x_e=1.8$, respectively. Blue and red thick lines show the values of $\sigma '$ for the Floquet analysis in the entire domain and in the confined domain with two splitter plates (see figure 5), respectively. Yellow shading indicates $x$-ranges of orbits 1, 2, 3 and 6.

We note that the trajectories of the particles moving along orbits 1, 2 and 3 (identified as the signatures of the mode B instability in the analyses by Giannetti (Reference Giannetti2015) and Jethani et al. (Reference Jethani, Kumar, Sameen and Mathur2018)) capture two key components of mode B instability: (i) amplification and (ii) transverse advection. Indeed, the cross-stream advection by the base flow transfers these particles between the upper and lower halves of the flow field so that particles, whose perturbation velocity  $\boldsymbol {v}_0$ has increased while being located in a region of strong stretching below the centreline during the first half of the periodic vortex shedding process, either enter (orbit 3) or come near (orbit 2) the equivalent region above the centreline during the second half of the period.
It is worth noting that although the in-plane viscous diffusion of perturbations plays a crucial role in shaping the spatial pattern of the instability, it does not significantly contribute to the flow destabilisation with an increase in  $Re$. To see this, we note that an increase in the Reynolds number has two distinct effects on the instability: (i) it changes the base flow and (ii) it reduces the intensity of viscous diffusion of the growing instabilities. Both effects can be assessed independently using the approach which introduces two separate Reynolds numbers, $Re$ and $Re'$, see, e.g., Aleksyuk & Heil (Reference Aleksyuk and Heil2023). The former is the Reynolds number in (2.1) that determines the base flow, $\boldsymbol {U}$, which then features in (2.7). The second Reynolds number, $Re'$, is the one that appears explicitly in (2.7), where it controls the strength of viscous diffusion of the perturbations. Figure 8 shows how independent changes to $Re$ and $Re'$ affect the modified growth rate $\sigma '$. The growth rates for the actual flow (for which $Re=Re'$) at Reynolds numbers $Re=240$ and $300$ are shown in black. The two additional cases (represented by red lines) with $(Re, Re')=(240,300)$ and $(Re, Re')=(300,240)$ demonstrate that variations in the intensity of the viscous diffusion (characterised by $Re'$) have a significantly smaller contribution to flow destabilisation than the changes in the base flow (characterised by $Re$). Interestingly, for the case where $Re=240$, there is a regime at small wavelength where the red line (for $Re'=300)$ is below its black counterpart (for $Re'=Re=240$), implying that an increase in $Re'$ can lead to a more stable flow. This highlights the dual nature of viscous diffusion, which can act as a stabilising (mainly through dissipation) and destabilising (through the spreading of perturbations) factor.
The effect of independent variation of the base flow ( $Re$) and the intensity of viscous diffusion ( $Re'$) on the growth rate $\sigma '(Re, Re', \lambda )$. Black lines correspond to the actual growth rates, i.e. when $Re=Re'$.

5. Regions of perturbation amplification by stretching
In the previous sections, we stressed the role of the braid regions as the regions within which perturbations to the base flow are amplified by the inviscid stretching mechanism; see, e.g., figure 5(a). The significance of these regions was already highlighted in previous studies by, e.g., Williamson (Reference Williamson1996a), Leweke & Williamson (Reference Leweke and Williamson1998), Thompson et al. (Reference Thompson, Leweke and Williamson2001) and Aleksyuk & Shkadov (Reference Aleksyuk and Shkadov2018). Here, we elucidate why these regions foster the growth of perturbations, and derive a simple criterion that allows their location to be predicted directly from quantities associated with the base flow without having to perform a Floquet analysis.
Given that the stretching mechanism is inviscid and that it does not depend explicitly on  $\gamma$, we focus on the behaviour of inviscid perturbations in the limit $\gamma \to \infty$. Such perturbations are governed by (4.1), which we rewrite in polar form, using a coordinate system that is aligned with the eigenvectors $\boldsymbol {e}_1$ and $\boldsymbol {e}_2$ of the rate of strain tensor in the base flow, ${{\boldsymbol{\mathsf{E}}}}$. Using $\varPhi (\boldsymbol {r},t)$ to denote the angle between the $x$-axis and the principal stretching direction $\boldsymbol {e}_1$ (the eigenvector associated with the eigenvalue $S>0$ of ${{\boldsymbol{\mathsf{E}}}}$), (4.1) becomes
 \begin{cases} \frac{1}{v_0}\dot{v}_0=-S\cos(2\theta),\\ \dot{\theta}=-R+S\sin(2\theta), \end{cases}
where
 \begin{equation} R = \dot{\varPhi}+\frac{{\varOmega}}{2}. \end{equation}
Here,  $\theta (\boldsymbol {r},t)$ is the angle between the principal stretching direction, $\boldsymbol {e}_1$, and the perturbation velocity, $\boldsymbol {v}_0$, and $v_0 = |\boldsymbol {v}_0|$; see Aleksyuk & Shkadov (Reference Aleksyuk and Shkadov2018) and Aleksyuk & Heil (Reference Aleksyuk and Heil2023).
Equation (5.1a) shows that the instantaneous growth rate  $\sigma _{stretch} = \dot {v}_0/v_0$ of inviscid perturbations due to stretching depends on their orientation $\theta (t)$ which evolves according to (5.1b). Here, $\sigma _{stretch}$ varies between $S$ (for perturbations aligned with $\boldsymbol {e}_2$; $\theta ={\rm \pi} /2$) and $-S$ (for perturbations aligned with $\boldsymbol {e}_1$; $\theta =0$). While it is, therefore, not possible to make a general statement about the growth rate of arbitrary perturbations, we note that if ${|R/S| < 1}$, the reorientation of the perturbations according to (5.1b) has four fixed points: two unstable ones at $\theta _1 = (1/2)\arcsin (R/S)$ and $\theta _2 = \theta _1+{\rm \pi}$, and two stable ones at $\theta _3={\rm \pi} /2-\theta _1$ and $\theta _4 = \theta _3+{\rm \pi}$. (If $|R/S| > 1$, (5.1b) has no fixed points and the orientation of the perturbations continues to change.) If $|R/S| < 1$, all perturbations (whether currently growing or decaying) therefore reorient towards $\theta _3$ or $\theta _4$ where they grow at a rate $\sigma _{stretch} = (S^2-R^2)^{1/2}$. Assuming the perturbations grow sufficiently quickly relative to the rate at which the base flow (and thus $R$ and $S$) changes, any initial perturbation (irrespective of its orientation) will, therefore, ultimately grow at the rate
 \begin{equation} \sigma_{stretch}^* \approx \sqrt{S^2 - \left(\dot{\varPhi}+\frac{{\varOmega}}{2}\right)^2}. \end{equation}
 To assess to what extent  $\sigma _{stretch}^*$ provides an estimate for the growth rate of perturbations due to stretching, figure 9 compares the growth rates due to stretching for the actual perturbations, represented by the first term on the right-hand side of (4.2), $-\boldsymbol {v}_0\boldsymbol {\cdot } {{\boldsymbol{\mathsf{E}}}} \boldsymbol {\cdot } \boldsymbol {v}_0/{v}_0^2$, with the distribution of $\sigma _{stretch}^*$. The colour contours indicate the magnitude of the growth rates in regions where they exceed an arbitrarily selected threshold of 1.2, chosen because our frozen-coefficient-like analysis is only applicable in regions where the growth rate is sufficiently large relative to the rate of change of the base flow. The figure shows that $\sigma _{stretch}^*$ not only identifies the key regions of perturbation amplification in the braid region, but also provides a good quantitative estimate for the local growth rates due to stretching.
Regions favourable for perturbations amplification at  $Re=260$ and $\gamma \rightarrow \infty$ determined by (a) the actual growth rate of perturbations due to stretching $-\boldsymbol {v}_0\boldsymbol {\cdot } {{\boldsymbol{\mathsf{E}}}} \boldsymbol {\cdot } \boldsymbol {v}_0/{v}_0^2$; (b) the growth rate $\sigma _{stretch}^*$ defined by (5.3). For ease of comparison across different cases, the isoline where $-\boldsymbol {v}_0\boldsymbol {\cdot } {{\boldsymbol{\mathsf{E}}}} \boldsymbol {\cdot } \boldsymbol {v}_0/{v}_0^2=1.6$ is marked with blue dashed lines. Black lines are isolines $\kappa = 1$ (the boundaries of the elliptic regions).

It is interesting to note that  $\sigma _{stretch}^*$ provides an extension of the well-known expression for the growth rate $\sigma ^*$ of inviscid three-dimensional perturbations in a steady unbounded base flow with constant vorticity and strain rate, for which, in regions where $S>|\varOmega |/2$, we have
 \begin{equation} \sigma^*=\sqrt{S^2-\left(\varOmega/2\right)^2}, \end{equation}
see, e.g., Lagnado, Phan-Thien & Leal (Reference Lagnado, Phan-Thien and Leal1984).
6. Conclusions
We have examined the mechanisms responsible for the onset of three-dimensional mode B instabilities in the cylinder wake. For this purpose, we formulated the Floquet analysis for the equations governing small-amplitude perturbations to the two-dimensional time-periodic base flow (the von Kármán vortex street). We showed that the spatial pattern of the perturbations is not affected by spanwise viscous diffusion, allowing us to account for this (stabilising) effect explicitly and to remove it from the subsequent analysis. We then used a scaling analysis to determine the form of the perturbation equations in the limit of short spanwise wavelength and showed that the spatial pattern of the perturbation is maintained in the limit  $\gamma \rightarrow \infty$. In this limit, the equations were found to become ‘pressureless’, allowing for a decoupling of the in-plane projection of the momentum equations for the perturbations. We showed how, as $\gamma \rightarrow \infty$, non-local interactions due to the tilting mechanism degenerate and become purely local; furthermore, they affect only the orientation of the perturbation, but not their magnitude. This implies that in this limit, in-plane viscous diffusion becomes the sole mechanism for spatial interactions between perturbations. Using a confined Floquet stability analysis, similar to the one employed by Barkley (Reference Barkley2005), we then showed that the mode B instability results from the combined effect of (i) the amplification of perturbations by the stretching mechanism, operating within the braid regions, and (ii) a feedback loop, driven by transverse advection and in-plane viscous diffusion, that transfers perturbations between the braid regions on either side of the cylinder. This causes instabilities that have grown on one side of the cylinder during the first half of the period to grow yet further when entering the braid region on the other side during the second half-period; see figure 6 for an illustration. Viscous diffusion was found to play an important role in spreading perturbations spatially, leading to the counterintuitive result that viscous effects can help to destabilise the flow. Furthermore, our confined Floquet analysis showed that because of the presence of viscous diffusion, the existence of closed trajectories which were attributed a key role in the studies of Giannetti et al. (Reference Giannetti, Camarri and Luchini2010), Giannetti (Reference Giannetti2015) and Jethani et al. (Reference Jethani, Kumar, Sameen and Mathur2018) is not a prerequisite for the development of the mode B instability. Thus, our findings clarify the mechanisms for the mode B instability, while adding rigour to the ideas and hypotheses proposed in previous studies (see § 1).
Finally, we derived a simple criterion that can be evaluated based only on quantities associated with the time-periodic base flow, which allows the prediction of the regions in which three-dimensional perturbations of short spanwise wavelength are amplified by the stretching mechanism.
The approaches developed in our study are sufficiently general that they may also be useful for examining short-wavelength three-dimensional instabilities in other flows. Additionally, our criterion for the identification of regions in which such instabilities are amplified by the stretching mechanism may be of utility in the design of strategies for controlling the transition to three-dimensionality and ultimately to turbulence.
Acknowledgements
The authors would like to acknowledge the assistance given by Research IT, and the use of the HPC Pool funded by the Research Lifecycle Programme at the University of Manchester.
Funding
The research was supported by a Newton International Fellowship funded by the Royal Society ( $\textrm {NIF}\backslash \textrm {R}1\backslash 201343)$.
Declaration of interests
The authors report no conflict of interest.


 Open access