

Strenuous trainings or prolonged moderate-intensity exercise in a hot and humid environment can significantly add to the challenge that physical exercise imposes on the human thermoregulatory system, as heat exchange between body and environment is substantially impaired under these conditions( Reference Wendt, van Loon and Lichtenbelt 1 ). This can lead to serious performance decrements of athletes and an increased risk of developing heat stress and illnesses such as heat cramps, heat exhaustion and heat stroke( Reference Wendt, van Loon and Lichtenbelt 1 ). Increased body core temperature becomes a stimulus of visceral vessels to produce irregular free radicals including nitric oxide (∙NO) and reactive oxygen species (ROS)( Reference Hall, Buettner and Oberley 2 ). Minimising increased body core temperature and exercise-induced oxidative stress in hot environments can prevent athletes facing problems in the World Cup of Qatar 2022( Reference Bongers, Thijssen and Veltmeijer 3 ).
Cooling body strategy in two stages of pre-cooling and per-cooling can inhibit fatigue, cell damages and health problems by lowering core body temperature( Reference Bongers, Thijssen and Veltmeijer 3 ). More recent studies have shown its effects on improving time to exhaustion and performance; however, there are also disagreements in this regard, identifying it as a non-applicable method for the field and competitive sports( Reference Bongers, Thijssen and Veltmeijer 3 ). Since 2000, pre-cooling method(s) has been used for most sport fields in hot environmental conditions (≥28°C)( Reference Jones, Barton and Morrissey 4 ). In this respect, researchers reported the use of pre-cooling (immersion in cold water) and per-cooling (drinking cold water) to be useful in reducing the pressure on the heart and blood vessels by decreasing body temperature and dehydration during training bouts on the stationary bike at 32°C with relative humidity of 80 %( Reference Hasegawa, Takatori and Komura 5 ). Engagement in long-term sport activities leads to the production of ROS including superoxide radical (O2 −), hydrogen peroxide (H2O2) and hydroxyl radical (OH∙) by the increase of the mitochondrial electron leakage, impaired haemostasis and reduced immune system function( Reference Rahal, Kumar and Singh 6 ). In fact, they initiate lipid peroxidation (LPO) (cell membranes are a common target) and protein oxidation, which play important roles in stabilising pathogens and a wide range of diseases( Reference Rahal, Kumar and Singh 6 ).
The role, as well as the involvement of excess ROS production in cardiac pathophysiology, has been well documented, contributing to contractile dysfunction most likely involving abnormalities in intracellular Ca2+ homoeostasis, cardiomyopathy, arrhythmia, ischaemia–reperfusion injury and mitochondrial DNA damages( Reference Burgoyne, Mongue-Din and Eaton 7 ). Many studies using both animal and human subjects have demonstrated that exhaustion and ultra-endurance exercises (e.g. cycling, running, swimming and half-ironman triathlon) result in increased exercise-induced cardiac fatigue (EICF) and biomarkers of oxidative damage in both blood and cardiac muscles( Reference Shave, Dawson and Whyte 8 ). Consequently, markers of both skeletal muscles and myocardial damage increase, including the serum cardiac enzymes (lactate dehydrogenase (LD) 1 isoenzyme, ɑ-hydroxybutyrate dehydrogenase (HBD), aspartate transaminase (AST) and CK), creatine kinase isoenzymes (CK-MB), cardiac contractile protein isoenzymes (cardiac Troponin I (cTnI) and cardiac Troponin T (cTnT)) and myoglobin (Mb), which is an early marker of myocardial damage( Reference Kemp, Donovan and Higham 9 ).
According to previous studies, a swimming session induced higher cell damage and oxidative stress in boys compared with the girls( Reference Tauler, Ferrer and Romaguera 10 ). There was a positive correlation between malondialdehyde, CK and LD especially in teenage boys compared with the girls after a swimming session( Reference Tauler, Ferrer and Romaguera 10 ). These sex differences could be attributed to the higher concentrations of 17-β-oestradiol in girls than in boys; because of their antioxidant properties, they could decrease the inflammatory cytokines response. In fact, these two roles could be related, because disorder inflammatory system due to strenuous exercise includes significant generation of ROS and antioxidant depletion, which can result in an increase in oxidative damage and cell membrane instability( Reference Tauler, Ferrer and Romaguera 10 ). Santos Silva et al.( Reference Santos-Silva, Rebelo and Castro 11 ) stated that adolescent swimmers who involved in high-level trainings and competition stages experienced proteolytic and lipolytic damages. One strategy of the researchers and athletic coaches for coping with the adverse effects of oxidative stress caused by continued and heavy training bouts is using coenzyme Q10 (CoQ10) supplementation( Reference Díaz-Castro, Guisado and Kajarabille 12 ).
CoQ10 has been shown in all tissues and organs in the body, with highest concentrations in the myocardium( Reference Borekova, Hojerova and Koprda 13 ). It plays an important role in the mitochondrial redox component and endogenously produced lipid-soluble antioxidants (scavenges oxygen radicals) of the human organisms( Reference Borekova, Hojerova and Koprda 13 ). Other important functions of CoQ10 are protecting the stability of the cell membranes and being capable of re-cycling and regenerating other antioxidants such as tocopherol and ascorbate( Reference Borekova, Hojerova and Koprda 13 ). Therefore, owing to the lack of studies in this area, it was hypothesised that the use of CoQ10 supplementation and pre-cooling strategy can affect adverse changes of serum lipid peroxide, which is an index of oxidative stress, cardiac damage markers, total antioxidant capacity (TAC) and CoQ10 concentration of elite adolescent swimmers during heavy training and recording bouts in the hot and humid environment.
Methods
Experimental design
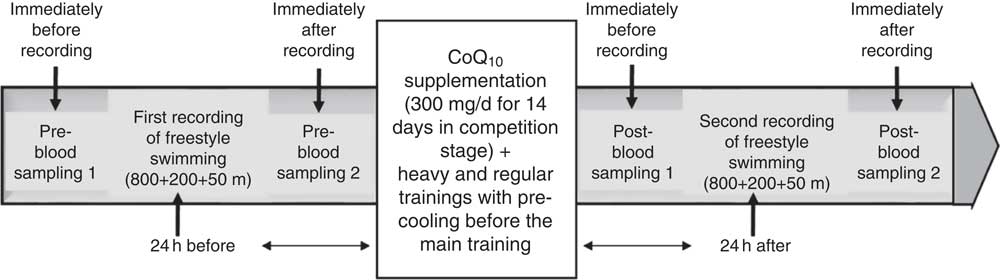
This study was cross-sectional and experimental that followed a repeated measures design with controlled trial. After permission of the I.R.IRAN Swimming Federation and head coach, the training programme of swimmers was designed by the coach and researcher for the competition stage in the hottest season (summer) of the year. Performances of the swimmers were measured by recording freestyle swimming (24 h before and after supplementation and pre-cooling strategy) at 800, 200 and 50 m, respectively. Considering the type of statistical analysis of the study, effect size=0·49, power=0·81, α=0·05 and the four groups were studied, the number of required samples was determined as thirty-six individuals using the software G*Power 3.1.9.2( Reference Faul, Erdfelder and Buchner 14 ). Total sample size with thirty-six healthy volunteers was selected by the convenient sampling method from a population with homogeneous elite swimmers. Each participant was randomly assigned to one of four groups: supplementation (received oral administration of 300 mg/d of CoQ10), pre-cooling (immersion in the cold water 18±0·5°C), supplementation with pre-cooling and control with nine members. Stages of this study are represented in Fig. 1.
General approach of the research process. CoQ10, coenzyme Q10.
Participants
In total, thirty-six elite male swimmers were recruited to take part in the study; the mean age, stature, mass and body fat composition were 17 (sd 1) years, 176·13 (sd 4·37) cm, 70·54 (sd 6·55) kg and 13·55 (sd 1·75) %, respectively. Table 1 provides the descriptive characteristics of the subjects. They were the members of national swimming team of Iran in Tehran with 10 years of professional swimming records and had gained top ranks at national level. Volunteers completed a medical history and Physical Activity Readiness-Questionnaire (PAR-Q) to determine eligibility. All subjects were non-smokers, and none had any history of recurrent respiratory illness, such as asthma or chronic cough. Swimmers did not use any supplement or energetics 1 month before the research and were trained in Sport Complex of Azadi in Tehran at the same nutritional and welfare conditions.
Participants’ food and energy amount received (Mean values and standard deviations; n 9)
CoQ10, coenzyme Q10.
Compliance with ethics guidelines
The study protocol for withdrawal of blood from healthy volunteers was approved by the regional ethics committee at Urmia University of Medical Sciences, Urmia, Iran. All followed procedures were conducted in accordance with the ethical standards of the responsible committee on human experimentation (institutional and national) and Declaration of Helsinki (2013 edition). Also, parents (for swimmers under the age of 18 years) and swimmers (for athletes older than 18 years) provided both verbal and written consent before participating in this investigation.
Measurement of individual characteristics
Body fat percentage was measured using a skin caliper (model number: E-RA_k3; Nakamura Mfg. Co., Ltd) and skinfold valid equation of Jackson and Pollock for men (triceps, abdomen and suprailiac) (Equation 1)( Reference Swisher, Yeater and Moffett 15 ). The subjects’ height was measured by wall-mounted stadiometer of Seca (Seca 206) with an error margin of 1 mm. Subjects’ mass was measured by the digital scale of Beurer with the precision coefficient of 100 g made in Germany. BMI was calculated by dividing body mass by squared height (kg/m2). Aerobic power (VO2max) was estimated by the exhaustion test of Bruce (running on a treadmill, Jog Now 700 Unity Treadmill; Technogym) through indirect way. In addition, anaerobic power was measured by the running-based anaerobic sprint test, using its reliable Equations 1, and 2 ( Reference Heyward and Gibson 16 ). Participants measured and recorded their resting heart rate accurately before leaving the bed for 3 consecutive days. Carotid artery pulse of 30 s, multiplied by 2, and its mean values were recorded. Heart rate of the training session was immediately measured after recording by the swimmers from the carotid artery and by a Polar watch (Beurer PM 90 Model; Beurer)( Reference Heyward and Gibson 16 ).
 $$\eqalignno{{\rm Body}\,{\rm fat}\,\,\%\,&\, {\equals}\, 0\! \cdot\! 39287{\times}\left( {{\rm sum}\,{\rm of}\,{\rm three}\,{\rm skinfolds}} \right) \cr& \ \ -0\! \cdot \! 00105{\times}\left( {{\rm sum}\,{\rm of}\,{\rm three}\,{\rm skinfolds}} \right)^{2} \cr& \ \ {\plus}0\! \cdot\! 15772{\times}\left( {{\rm age}} \right)-5\! \cdot\! 18845.$$
 $$\eqalignno{ {\rm Aerobic}\,{\rm power}\, {\equals}\, &14\! \cdot\! 76{\minus}1\! \cdot\! 379{\times}\left( {{\rm time}} \right){\plus}0\! \cdot\! 451{\times}\left( {{\rm time}^{2} } \right)\cr &-0\! \cdot\! 012{\times}\left( {{\rm time}^{3} } \right) \cr & \hskip -40pt {\rm Anaerobic}\,{\rm power}\, {\equals}\, {\rm mass}{\times}{\rm distance}^{2} \, {\div}\, {\rm time}^{3} . $$
Supplementation protocol
Data from human and animal studies provide good evidence that exogenous CoQ10 may be taken up by peripheral tissues, then slowly redistributes into plasma for at least 2 weeks depending upon the length of the dosing period. In addition, the most suitable dosage is 300 mg/d in a single dose for raising the base level in human subjects owing to its 33-h half-life, hydrophobic nature and high molecular mass( Reference Miles 17 ). Therefore, according to the previous studies and similar to the administration of Leelarungrayub et al.( Reference Leelarungrayub, Sawattikanon and Klaphajone 18 ), swimmers received daily 300 mg of CoQ10 (2,3 dimethoxy-5 methyl-6-decaprenyl benzoquinone) with a trans-structure in the form of a gel manufactured by America (Nature’s Bounty) for 14 d. During this period, control and pre-cooling groups took daily 300 mg of placebo capsules (lactose), which were similar to CoQ10 in terms of flavour, colour and size.
Dietary control
The mean food intake was obtained using a 24-h dietary recall questionnaire. All subjects were asked to mention all food and drink they had in the past 24 h. This questionnaire was completed for each subject in six non-consecutive times during 2 weeks (three times a week). Obtained values were converted into grams using the Guideline of Household Scales. Then, each food was coded according to the Guideline of Food Processor Software and was analysed in terms of quantity and energy contribution( Reference Mahan, Escott-Stump and Raymond 19 ). The mean values and standard deviations of daily macronutrient and micronutrient intake are presented in Table 2.
Participants’ physical characteristics (Mean values and standard deviations)
CoQ10, coenzyme Q10.
Pre-cooling administration
According to the studies on the track and field and cycling( Reference Tyler, Sunderland and Cheung 20 ), swimmers were pre-cooled before the start of the main trainings in each session and the second recording bout between the warm-up inside and outside the water. Subjects entered cold water pool at a temperature of 18±0·5°C from the lower limbs to shoulder girdle for 15 min( Reference Arngrimsson, Petitt and Stueck 21 ). To prevent cold shocks, this was done after taking a shower (gradual reduction of water temperature)( Reference Booth, Wilsmore and Macdonald 22 ). Also, in order to prevent dehydration and maintain body core temperature at an optimal level and improve blood flow to active muscles, during every training session the swimmers consumed 500 ml of Powerade (hypotonic sportive drink with 6–8 % carbohydrate) and 1 liter of water chilled to the temperature of 5±1°C( Reference Ross, Abbiss and Laursen 23 ).
Protocol of training and recording
Training protocol with a 2-week heavy and regular swimming training contract (9 sessions/week) of training programme was designed by coaches and researchers for the competition stage (from four stages of swimming trainings). Training variables (volume, intensity and frequency) were kept constant every week and the training distance for every session was considered to be 5 km. Performances of the swimmers were measured by recording freestyle swimming at 800, 200 and 50 m distances, respectively, with the maximum effort and heart rate control following studies and similar to the swim matches with a 10- to 15-min active rest between the records( Reference Leelarungrayub, Sawattikanon and Klaphajone 18 ). Training sessions were conducted in two shifts, one in the morning and one in the evening, without also working with bodybuilding. Indoor swimming pool of 25×50 m with the depth of 4 m and water temperature of 27±1°C (or 80±2°F) was selected according to the rules of the Federation International Natation Amatur (FINA). Ambient pool temperature was 33±1°C with a the relative humidity of 60–70 %. Swimming speed was controlled through counting stroke rate (SR) and stroke length (SL) by a digital chronometer and a Polar watch. Before the main training, swimmers performed a warm-up out of the water (general and dynamic) and warm-up inside the water. In addition, after the main training a cool-down inside water was performed for 15–20 min (a total of 45–60 min). Intensity of the trainings was set according to the Karvonen formula or target heart rate (THR) based on Equation 3. Main trainings were practised for 2 h using different drills of four styles swimming in the intervals and repetitive sets, focused on the speed (Sp1–3) and endurance (En1–3) swim( Reference Riewald and Rodeo 24 ).
Sp1 (80–90 % THR, 100–200 m), Sp2 (90–100 % THR, 50–100 m) and Sp3 (100 % THR, 12·5–50 m).
En1 (50–60 % THR, 800–1500 m), En2 (60–70 % THR, 400–800 m) and En3 (70–80 % THR, 200–400 m).
 $$ {\rm HRmax\, {\equals}\, 220}{\minus}{\rm age} $$
 $${\rm THR\, {\equals}\, }\,\%\,\,{\rm of}\,{\rm target}\,{\rm intensity}{\times}{\rm HRR}{\plus}{\rm HRrest} $$
 $$\cr & {\rm Heart}\,{\rm rate}\,{\rm reserve}\,\left( {{\rm HRR}} \right)\, {\equals}\, {\rm HRmax}{\minus}{\rm HRrest} $$
 $$ V\, {\equals}\, {\rm SL}{\times}{\rm SR}{\rm .} $$
Preparation of blood sampling
Blood sampling was carried out 24 h before (stages 1 and 2) and after (stages 1 and 2) supplementation of CoQ10 and pre-cooling strategy (the highest level of effectiveness of CoQ10 in blood) in four stages( Reference Miles 17 ). At both time points, approximately 5 ml of blood was sampled from an antecubital vein of right arms of the subjects by nursing expert before noon (from 08.00 to 11.00 hours). Then, 2 ml of it was poured and thoroughly stirred in test tubes with anticoagulant substances (K2EDTA) for blood cell count. The remaining blood (3 ml) was immediately transferred into gel tubes specific for serum without addition of an anticoagulant material for serum preparation and was centrifuged at 1500 g for 10 min at 4°C in a Beckman (J2-21) centrifuge (Beckman Coulter). Plasma samples were immediately frozen and stored at −80°C until analysis. Participants avoided any physical activity 24 h before blood sampling and recordings. Biochemical analysis of blood samples was conducted in equipped biochemistry laboratory of veterinary faculty (Department of Clinical Pathology, University of Urmia, Urmia, Iran). Also, laboratory equipment was evaluated 3 months before starting study.
Measurement of blood indicators
Serum isoenzymes of CK-MB and cTnI were measured by chemiluminescence: bioMérieux launches VIDAS® Troponin I Ultra kit is made in France and the MB kit Audit Diagnostics facility in Cork, Ireland. Serum Mb concentration was determined by using a commercial kit (Eiken Chemical Co.). Serum LPO concentration was determined by using a commercial kit (Kyowa Medex Co.). Serum enzyme of LD (with sensitivity 5 IU/l) and TAC were measured according to the biochemical kit of Biorex Company of England (Biorex, Co.). The concentration of serum CoQ10 was estimated by summing the contents of CoQ10 in reduced form (ubiquinol) and oxidised form (ubiquinone), each measured through HPLC. The method used for such determination was explained in the protocol of Graves et al.( Reference Graves, Sikorska and Borowy-Borowski 25 ) with trivial modifications. Blood cell count was carried out using American Cell Counter of Mindray (BC-3000 plus).
Statistical analysis
Statistical analysis was performed using SPSS statistics version 22.0 and excel 2013 for Windows software (SPSS, Inc.). The distribution of the data was evaluated by the Kolmogorov–Smirnov test. Owing to normal distribution of study variables, univariable ANCOVA and also repeated measurement ANOVA tests in the general linear model were used to find significant differences among and within groups, respectively. Comparison of significant interactions and main effects for all statistical tests was performed using Bonferroni’s post hoc test. The data were expressed as mean values and standard deviations. Differences were considered statistically significant at the P<0·05 level.
Results
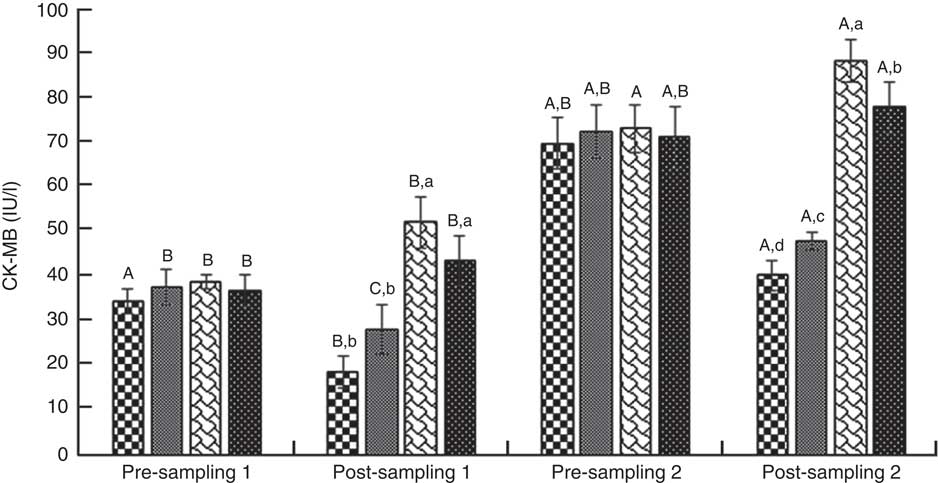
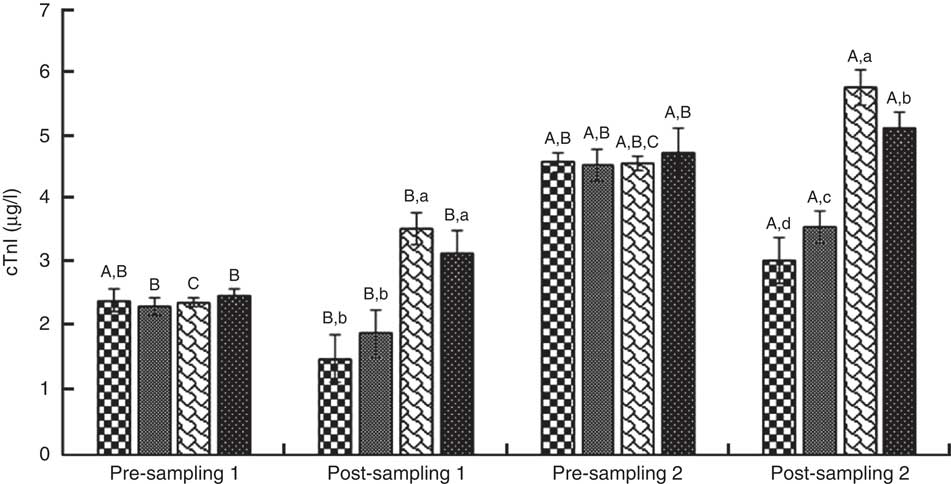
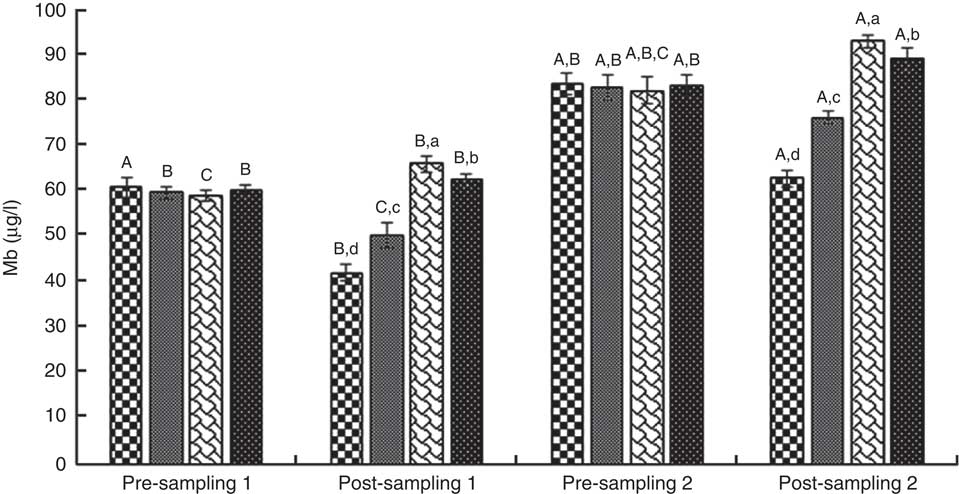
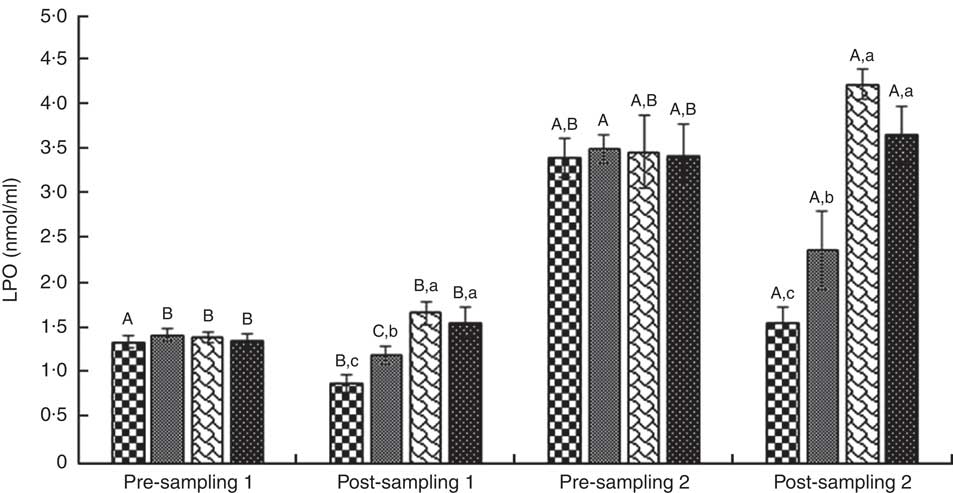
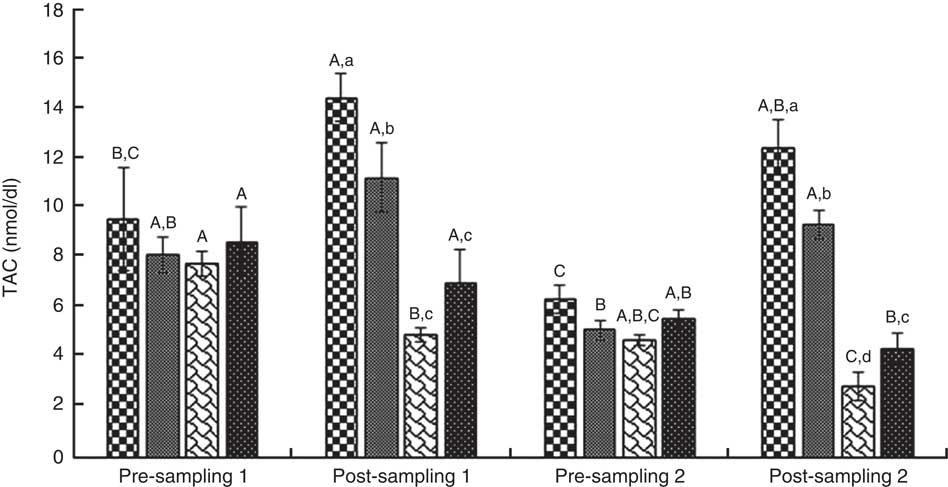
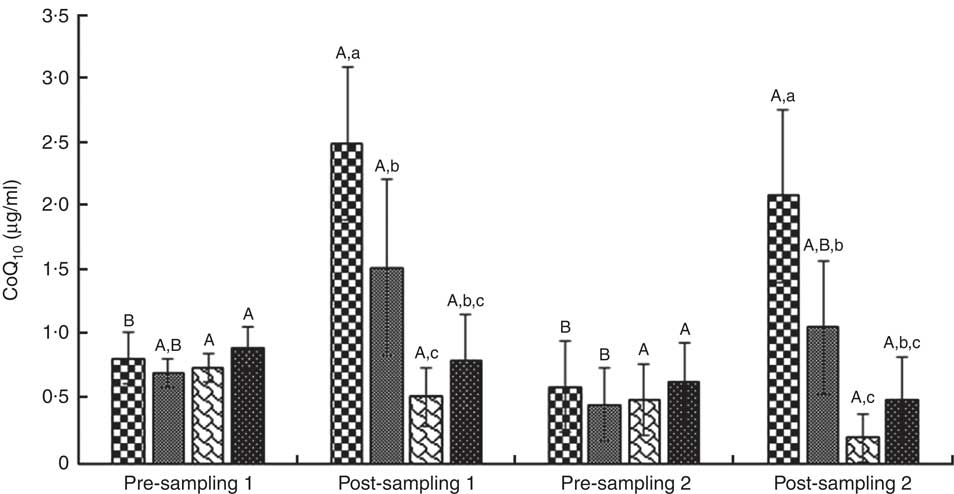
ANOVA indices levels of CK-MB, cTnI, Mb, LD, TAC, LPO and CoQ10 in the pre-blood sampling (stages 1 and 2) showed no significant statistical difference among the groups (P>0·05). In the post-blood sampling (stages 1 and 2), a significant statistical difference was observed among the groups for levels of CK-MB, cTnI, Mb, LD, TAC, LPO and CoQ10 indicators (P<0·05). So that, levels of CK-MB, cTnI, Mb, LD and LPO in supplementation and also supplementation with pre-cooling groups a significant decrease were observed compared with both the pre-cooling and control groups respectively; although, a significant increase were seen for TAC and CoQ10 levels. Also, a significant difference was observed within the groups for levels of CK-MB, cTnI, Mb, LD, TAC, LPO and CoQ10 indicators (P<0·05). So that, levels of CK-MB, cTnI, Mb, LD and LPO in pre-cooling and also control groups, an increase were observed compared with both the supplementation and supplementation with pre-cooling groups; although, a decrease were seen for TAC and CoQ10 levels. Details of significant differences of the indices are shown in Figs 2–8. No statistically significant differences for any measured variable of the dietary and the physical characteristic of the subjects were seen among the groups (P>0·05). Details of their results are shown in Tables 1 and 2, respectively. It is noteworthy that health symptoms or side effects such as vomiting, headaches and skin rash and reduction in blood pressure and heart rate during the study were inquired upon daily by telephone. Participants tolerated the oral administration of CoQ10 well, and there were no negative effects reported. In addition, the initial results of complete blood count testing and urinalysis showed normal levels.
Creatine kinase-MB (CK-MB). Values are means (n 9) and standard deviations represented by vertical bars. A,B,C Mean values with unlike letters were significantly different within the group measurement (P<0·05). a,b,c,d Mean values with unlike letters were significantly different among the groups (P<0·05). CoQ10, coenzyme Q10. ![]() , CoQ10;
, CoQ10; ![]() , CoQ10+pre-cooling;
, CoQ10+pre-cooling; ![]() , pre-cooling;
, pre-cooling; ![]() , control.
, control.
Troponin I (cTnI). Values are means (n 9) and standard deviations represented by vertical bars. A,B,C Mean values with unlike letters were significantly different within the group measurement (P<0·05). a,b,c,d Mean values with unlike letters were significantly different among the groups (P<0·05). CoQ10, coenzyme Q10. ![]() , CoQ10;
, CoQ10; ![]() , CoQ10+pre-cooling;
, CoQ10+pre-cooling; ![]() , pre-cooling;
, pre-cooling; ![]() , control.
, control.
Lactate dehydrogenase (LD). Values are means (n 9) and standard deviations represented by vertical bars. A,B Mean values with unlike letters were significantly different within the group measurement (P<0·05). a,b,c,d Mean values with unlike letters were significantly different among the groups (P<0·05). CoQ10, coenzyme Q10. ![]() , CoQ10;
, CoQ10; ![]() , CoQ10+pre-cooling;
, CoQ10+pre-cooling; ![]() , pre-cooling;
, pre-cooling; ![]() , control.
, control.

Myoglobin (Mb). Values are means (n 9) and standard deviations represented by vertical bars. A,B,C Mean values with unlike letters were significantly different within the group measurement (P<0·05). a,b,c,d Mean values with unlike letters were significantly different among the groups (P<0·05). CoQ10, coenzyme Q10. ![]() , CoQ10;
, CoQ10; ![]() , CoQ10+pre-cooling;
, CoQ10+pre-cooling; ![]() , pre-cooling;
, pre-cooling; ![]() , control.
, control.
Lipid peroxidation (LPO). Values are means (n 9) and standard deviations represented by vertical bars. A,B,C Mean values with unlike letters were significantly different within the group measurement (P<0·05). a,b,c Mean values with unlike letters were significantly different among the groups (P<0·05). CoQ10, coenzyme Q10. ![]() , CoQ10;
, CoQ10; ![]() , CoQ10+pre-cooling;
, CoQ10+pre-cooling; ![]() , pre-cooling;
, pre-cooling; ![]() , control.
, control.
Total antioxidant capacity (TAC). Values are means (n 9) and standard deviations represented by vertical bars. A,B,C Mean values with unlike letters were significantly different within the group measurement (P<0·05). a,b,c,d Mean values with unlike letters were significantly different among the groups (P<0·05). CoQ10, coenzyme Q10. ![]() , CoQ10;
, CoQ10; ![]() , CoQ10+pre-cooling;
, CoQ10+pre-cooling; ![]() , pre-cooling;
, pre-cooling; ![]() , control.
, control.
Coenzyme Q10 concentration (CoQ10). Values are means (n 9) and standard deviations represented by vertical bars. A,B Mean values with unlike letters were significantly different within the group measurement (P<0·05). a,b,c Mean values with unlike letters were significantly different among the groups (P<0·05). CoQ10, coenzyme Q10. ![]() , CoQ10;
, CoQ10; ![]() , CoQ10+pre-cooling;
, CoQ10+pre-cooling; ![]() , pre-cooling;
, pre-cooling; ![]() , control.
, control.
Discussion
The aim of this study was to determine whether short-term oral CoQ10 supplementation and pre-cooling strategy would affect the oxidative stress, cardiac damage markers, TAC and CoQ10 concentration following swimming competition phase in a hot and humid environment. According to the previous studies, hyperthermia and transient hypoxia during prolonged and strenuous exercises lead to the increased oxidative stress (driving CVD progression), activation of anaerobic glycolysis enzymes, imbalance between pro-oxidant and antioxidant response and the release of catecholamine and metabolic stress in the liver and intestine( Reference Hall, Buettner and Oberley 2 ). Finally, reactive oxygen and nitrogen species are triggered under the conditions of heavy skeletal muscle contraction, hypoxia or ischaemia( Reference Burgoyne, Mongue-Din and Eaton 7 ). These states show themselves with increasing levels of cardiac enzymes of CK-MB, LD and troponin( Reference Kemp, Donovan and Higham 9 ).
Recent literature indicates that ROS production facilitates normal cardiac function through the activation of ryanodine receptor 1 (RyR1), receptors inducing Ca2+ release( Reference Sag, Köhler and Anderson 26 ). However, ROS production at high levels can lead to RyR1 malfunction and aberrant calcium release, inducing contractile dysfunction, arrhythmia and myopathy with further upstream molecular targets being protein kinase A and calcium calmodulin kinase( Reference Sag, Köhler and Anderson 26 ). In agreement with the present results, KÖnig et al.( Reference König, Schumacher and Heinrich 27 ) reported CK, CK-MB and Mb as myocardial stress markers that significantly increased after the fourth stage of a 5-d stage of cycling race, but the increase was far lower than the marathons and half-marathons. Clarkson et al.( Reference Clarkson, Kearns and Rouzier 28 ) reported a significant increase in the markers of muscle damage (LD, CK and Mb) after eccentric exercise and sport competition in healthy individuals. In addition, Shave et al.( Reference Shave, Dawson and Whyte 8 ) concluded that the physiologic stress imposed during and after half-ironman triathlon in a reduced left ventricular contractility altered diastolic filling, coupled with minimal cardiac damage (CK and CK-MB) in a number of highly trained male triathletes. However, they did not report a significant change of cTnT. Inconsistency of present results is probably owing to the fact that the changed concentration of cardiac damage markers is proportional to the numerous compounding variables (e.g. age, training status, absolute exercise intensity and environmental conditions)( Reference Clarkson, Kearns and Rouzier 28 ).
Oral administration of CoQ10 plays a pro-oxidant role during the increase of O2 ∙─, turning it into H2O2 at the presence of superoxide dismutase enzyme in complex I and III of the respiratory chain( Reference Borekova, Hojerova and Koprda 13 ). It also plays an important role in the oxidative phosphorylation by transferring electron into complex III. In the presence of antioxidant enzymes (catalase and glutathione peroxidase), H2O2 is transformed into H2O as a result of which ATP is produced; otherwise, it turns into OH∙( Reference Borekova, Hojerova and Koprda 13 ). Also, CoQ10 appears to increase ATP levels by preventing the loss of adenine nucleotide pool from cardiac cells( Reference Bonakdar and Guarneri 29 ). Additionally, CoQ10 has evidenced activity in preventing lipid peroxidation as an antioxidant, and as an indirect stabiliser of calcium channels to decrease overload or imbalance intracellular calcium( Reference Petrofsky, Laymon and Lee 30 ).
Results of this study showed that CoQ10 supplementation alone and also combined with pre-cooling leads to a significant decrease in serum levels of CK-MB, cTnI, Mb, LD and LPO markers, and increased levels of TAC and CoQ10 compared with the other groups in the post-sampling (stages 1 and 2) (P<0·05). In this regard, Kon et al.( Reference Kon, Tanabe and Akimoto 31 ) demonstrated that after supplementation of 300 mg/d CoQ10 for 20 d in elite Kendo athletes during training camp, serum LPO concentration did not change in either group, although LPO in the CoQ10 group was lower than in the placebo group. Therefore, the effect of CoQ10 supplementation on exercise-induced oxidative stress in athletes was unclear in their study. Also, it showed that CoQ10 supplementation increased serum CoQ10 concentration and reduced exercise-induced muscular serum CK activity and Mb concentration in the athletes( Reference Kon, Tanabe and Akimoto 31 ). Possible causes of these contradictory results may be old age of the subjects and the type of sport contract.
In a recent study( Reference Díaz-Castro, Guisado and Kajarabille 12 ), it was reported that CoQ10 supplementation is efficient in reducing the degree of oxidative stress for amateur male athletes during high-intensity exercise bouts (50 km running), leading to the maintenance of cell integrity. In addition, they found a significant increase in the total antioxidant status in both CoQ10 groups compared with the placebo group( Reference Díaz-Castro, Guisado and Kajarabille 12 ). Agreeing with the results of this study, Leelarungrayub et al.( Reference Leelarungrayub, Sawattikanon and Klaphajone 18 ) suggested that the 12 d of CoQ10 supplementation reduces oxidative stress and improves TAC (including proteins and enzymatic and non-enzymatic antioxidant compounds) level and CoQ10 concentration, within a sample of young swimmers( Reference Leelarungrayub, Sawattikanon and Klaphajone 18 ). Altogether, the results of the study by Sohal et al.( Reference Sohal, Kamzalov and Sumien 32 ) indicated that, contrary to the present results, supplemental intake of CoQ10 has no discernable effect on the main antioxidant defenses or pro-oxidant generation in most tissues of mice( Reference Sohal, Kamzalov and Sumien 32 ). Bloomer et al.( Reference Bloomer, Canale and McCarthy 33 ) indicated that in physically active men and women, 30 d of CoQ10 supplementation (300 mg/d) increased the reduced serum CoQ10, but that increase did not affect exercise performance and resting or exercise-induced measures of oxidative stress. In addition, Östman et al.( Reference Östman, Sjödin and Michaëlsson 34 ) demonstrated that supplementation of 90 mg/d CoQ10 for 8 weeks in moderately trained men did not affect oxidative stress indices.
In contrast, Gul et al.( Reference Gul, Gokbel and Belviranli 35 ) showed that supplementation of 100 mg/d CoQ10 for 8 weeks decreased lipid peroxidation immediately after the repeated bouts of supramaximal exercises in sedentary men. Different results of these studies are most likely for different types, dosages and time frames of antioxidant(s) treatment, sampled tissues, exercise protocol used to induce oxidative stress, measurement time, used assays and recruited (trained v. untrained, old v. young and healthy v. diseased) test subjects among other variables( Reference Bloomer, Canale and McCarthy 33 ). These results may support the results of Taiwanese group (2011), suggesting that CoQ10 acts as an inflammatory mediator in the activation of PKC, NADP+, oxidised LDL and dependent on the inhibitory and effective function of AMP-activated protein kinase (AMPK). Activation of AMPK function by activating a signalling pathway of Akt/eNOS/NO and stabilising energy protects the cells against oxidative damage to maintain endothelial function in hypoxia and heat stress (or ATP depletion) conditions. Although there is no study on the relationship between CoQ10 and AMPK, they showed a correlation between CoQ10 and AMPK( Reference Tsai, Chen and Chiou 36 ).
The present results support the findings of Zheng and Moritani( Reference Zheng and Moritani 37 ) because, as they reported, when CoQ10 increases 2, 3-diphosphoglycerate levels in erythrocyte cells, HBO2’s decomposition curve diverts to the right and increases oxygen transfer in a certain pressure (PO2). As a result, not only the increase of oxygen in the skeletal muscles but also in the heart and respiratory muscles may increase ATP synthesis and reduce lactate production, possibly leading to the increase of VO2max Reference Zheng and Moritani (37 ). According to some studies, CoQ10 has been shown to reduce neuronal cell death by activating the PI3K pathway in neurons, because the PI3K pathway mediates the movement of glucose into the cells, which is also activated by insulin. In addition, it is a key step in oxidative phosphorylation in the inner mitochondrial membrane. It is possible that the increased response to occlusion in the subjects after CoQ10 administration is linked to activation of the PI3K signalling pathway, which directly increases tissue blood flow( Reference Petrofsky, Laymon and Lee 30 ). This mechanism is possibly owing to a significant decrease in serum levels of CK-MB, cTnI, Mb, LD and LPO indices in the supplementation and also supplementation with pre-cooling groups compared with the pre-cooling and control groups. It is noteworthy that Mb performance is dependent on the blood flow, because it is now known not only as an oxygen storage protein to mediate facilitated diffusion in vivo and an intracellular catalyst but it has also been described to be a regulating mitochondrial function through its ∙NO scavenger( Reference Kamga, Krishnamurthy and Shiva 38 ).
CoQ10 is a necessary cofactor for the lack of coupling proteins in regulating body temperature, accelerating the biological and biochemical interactions’ trends and affecting the temperature of muscle contraction( Reference Echtay, Winkler and Frischmuth 39 ). Interest in pre-cooling has increased for more than three decades among the athletes using various ways, including exposure to cold weather, use of cooling jackets, immersion in cold water, ice or cool drinks( Reference Ross, Abbiss and Laursen 23 ). In this respect, Hue et al.( Reference Hue, Monjo and Lazzaro 40 ) proposed that during cooling, heart rate, body core temperature and skin temperature significantly decrease by having cold drinks while practicing long swimming especially in the evening sessions. Marsh and Sleivert( Reference Marsh and Sleivert 41 ) reported that pre-cooling increases blood flow to active muscles through skin vasoconstriction in high-intensity cycling performances. As a result of an increase in the blood flow, the muscle can improve its aerobic metabolism and energy production. Displacement of lactate acid for oxidation prevents from its accumulation and pH drop and delays fatigue( Reference Marsh and Sleivert 41 ). Muscle pH from the rest amount (7·1) was reduced during high-intensity trainings and speed swimming, especially at 200 m speed. Then, the performance of some pH-sensitive enzymes such as phosphofructokinase was inhibited, reducing ATP production and increasing the incidence of EICF( Reference Riewald and Rodeo 24 ).
Results of present study showed that serum levels of CK-MB, cTnI, Mb, LD and LPO increased, and TAC and CoQ10 decreased significantly in the pre-cooling group compared with the other groups in the post-sampling (stages 1 and 2) (P<0·05). This inconsistency with the results of other studies may relate to the differences in the type of sport contract and pre-cooling (immersion in the water at 18±0·5°C) method or low temperature of pool water (27±1°C) compared with the high environmental temperature during their study( Reference Tyler, Sunderland and Cheung 20 ). Moreover, the consequences such as exposure to cold caused likely contraction vibrations by sympathetic neural system, increased consumption of muscle glycogen, increased blood pressure and heart rate (tachycardia), rapid and unbalanced breathing (reduction of cardiac output and available oxygen to the tissues and acidosis conditions), increased metabolic stress hormone and TAC decline (due to resistance against free radicals and maintaining cell homoeostasis). In addition, coronary blood flow was also reduced and later on resulted in an altered basophil activity in the myocardium( Reference Alva, Palomeque and Carbonell 42 ). Overall, indicators of the supplementation group were significantly lower, except for TAC and CoQ10 levels. On the other hand, increased plasma CoQ10 level was likely to lead to the increased oxidative phosphorylation, acceleration of the electron transfer from the flavoproteins into cytochromes, less dependence on anaerobic glycolysis pathway, increase of NEFA burns and eventually less lactate acid accumulation with a potential to reduce swimming-induced muscular and myocardial cell damage( Reference Borekova, Hojerova and Koprda 13 , Reference Riewald and Rodeo 24 ). In accordance with the present results, Booth et al.( Reference Booth, Wilsmore and Macdonald 22 ) reported no effect of pre-cooling on plasma lactate acid, VO2max and other physiological factors in the production of muscle energy during endurance cycling at 35°C and the relative humidity of 50 %. Accordingly, if it had some effects on the physical performance, it would probably play a role only by reducing body core temperature and pressure on the cardiovascular system( Reference Booth, Wilsmore and Macdonald 22 ).
Conclusions
Our results showed that CoQ10 supplementation reduced serum levels of myocardial damage markers and increased TAC and CoQ10 concentration during heavy trainings and recording bouts, preventing from the adverse consequences of pre-cooling in elite adolescent swimmers. As an antioxidant and cell membrane stabiliser, body core temperature regulator and essential cofactor in mitochondrial oxidative phosphorylation, CoQ10 can inhibit the expression of free radicals and reduce swimming-induced oxidative stress. Pre-cooling strategy was not effective in eliminating or reducing myocardial damage markers and oxidative stress and increasing TAC and CoQ10 concentration. Presumably, pre-cooling decreased the body core temperature, increased time to exhaustion and reduced the pro-inflammatory cytokinesis. However, further research is needed in this area.
Acknowledgements
The authors thank the presidency of I.R.IRAN Swimming Federation, head coach and adolescent swimmers who cooperated in conducting this study.
This research received no specific grant from any funding agency, commercial or not-for-profit sectors.
Contributions of authors are as follows: all authors have made substantial contribution to the manuscript. This is an integrative research that involves different backgrounds and expertise. A. E. developed formulating the research question(s), collection of data, designing the study and the training protocol and carrying it out. A. T. developed interpretation of findings and writing of this article. S. A.-R. developed analysis of blood samples, which required extensive laboratory analysis. B. B.-G. developed statistical analysis of data, and provided laboratory kits and CoQ10 supplement. They all provided relevant intellectual contribution and were aware of the content of the manuscript.
There are no conflicts of interest among the authors to publish the present study.


