





1. Introduction
In this paper, we present observations and measurements concerning a previously undocumented flow structure that arises under certain conditions in the tip vortex of a rectangular airfoil in water. It shares certain characteristics with the well-known vortex breakdown phenomenon, with the notable difference that in the present case it requires a second gaseous phase in order to appear. It was discovered by chance, while performing experiments with a wing underneath and close to the free surface of a water channel, where strong deformations of the surface by the flow around the wing tip caused air to be entrained into the tip vortex. In the subsequent study, the wing tip was placed far from the surface and controlled air injection was used.
Vortex breakdown is a characteristic flow feature found in concentrated vortices with an axial velocity component in the core, subject to an adverse axial pressure gradient slowing down the axial flow, which can lead to the formation of a stagnation point on the vortex axis. This causes a significant disruption of the core, which may exhibit either a large (compared with the initial core size) recirculation bubble, a deformation of the initially straight core into a helical or spiral structure or a combination of both bubbles and spirals. Vortex breakdown is found in atmospheric flows (tornadoes, dust devils) and in engineering (combustion chambers, delta wings). Previous experimental studies have analysed this phenomenon in a variety of configurations: flow over a delta wing (Lambourne & Bryer Reference Lambourne and Bryer1961), swirling flow inside a diverging pipe (Faler & Leibovich Reference Faler and Leibovich1977), flows in a lid-driven cavity (Escudier Reference Escudier1984), flow in a tornado chamber (Khoo et al. Reference Khoo, Yeo, Lim and He1997) and in swirling jets (Billant, Chomaz & Huerre Reference Billant, Chomaz and Huerre1998). Reviews of experimental, numerical and theoretical work on this topic were given by Escudier (Reference Escudier1988), Delery (Reference Delery1994) and Lucca-Negro & O’Doherty (Reference Lucca-Negro and O’Doherty2001).
Evidence of the breakdown of free tip vortices of rectangular wings is rare. Bilanin & Widnall (Reference Bilanin and Widnall1973) and Sarpkaya (Reference Sarpkaya1983) report the occasional ‘bursting’ of vortices generated in a towing tank, but the phenomenon occurs at a fixed location in the laboratory frame (instead of the wing frame) and appears to be related to the deformations due to the Crow instability (Crow Reference Crow1970). Wind tunnel measurements by Singh & Uberoi (Reference Singh and Uberoi1976) behind a rectangular wing at high angle of attack show a rapid reversal of the axial core velocity and increase of the core diameter, indicating the presence of vortex breakdown, although it was not identified as such.
In almost all studies mentioned above, vortex breakdown occurred in a homogeneous fluid. An air-filled breakdown of swirling water flow inside a pipe was shown by Escudier & Keller (Reference Sarpkaya1983) and analysed theoretically by Keller, Egli & Exley (Reference Keller, Egli and Exley1985). We here present the two-phase breakdown of a free tip vortex of a rectangular wing in water. Experimental details are given in § 2 and different breakdown regimes are shown in § 3. The characteristics of the tip vortices and of the breakdown bubble are presented in §§ 4 and 5, respectively. Some aspects of the observations and measurements are discussed in § 6, followed by a conclusion in § 7.
2. Experimental set-up
Experiments were carried out in a recirculating free-surface water channel with a 150 cm $\times$
38 cm
$\times$
38 cm $\times$
50 cm (length
$\times$
50 cm (length $\times$
width
$\times$
width $\times$
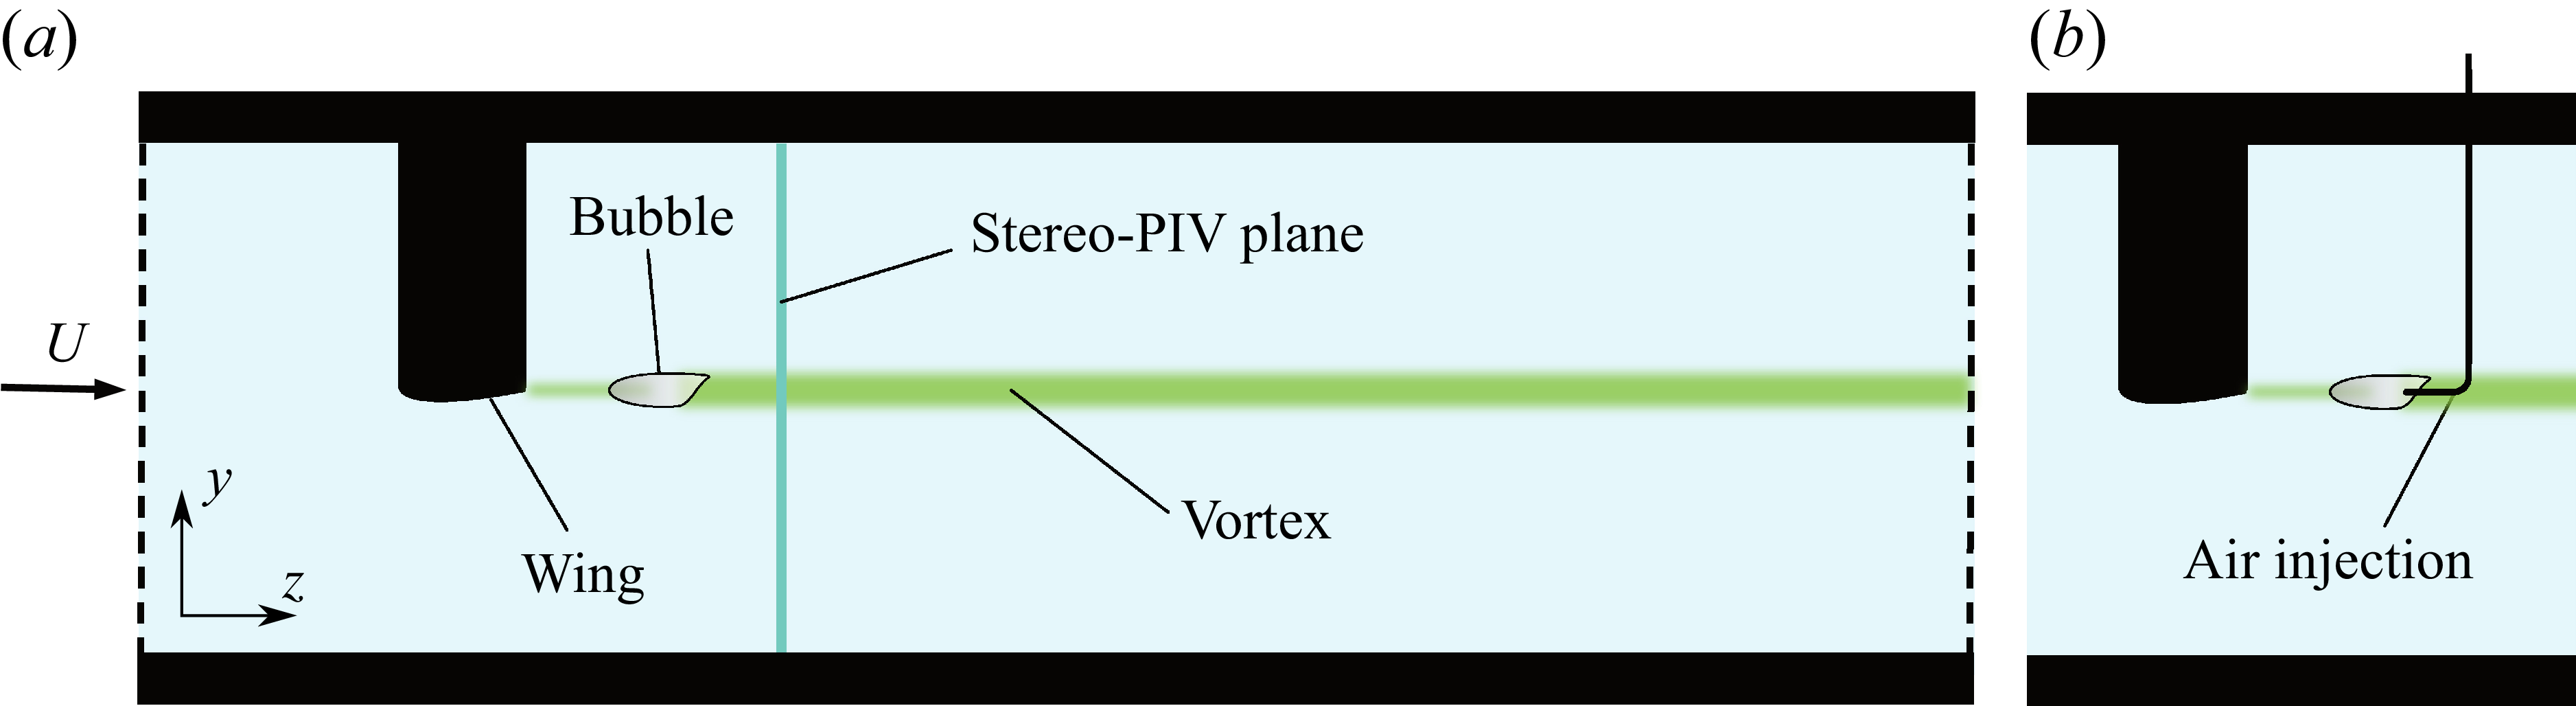
height) test section. Wing-tip vortices were generated using two rectangular half-wing models with rounded tips, mounted vertically (figure 1). One wing had a NACA 0012 cross-section, aspect ratio
$\times$
height) test section. Wing-tip vortices were generated using two rectangular half-wing models with rounded tips, mounted vertically (figure 1). One wing had a NACA 0012 cross-section, aspect ratio $ \textit{AR} = 2.5$
and chord length
$ \textit{AR} = 2.5$
and chord length $c = 9.8$
cm; the other had an SD 7003 cross-section (Selig–Donovan, Selig, Donovan & Fraser Reference Selig, Donovan and Fraser1989),
$c = 9.8$
cm; the other had an SD 7003 cross-section (Selig–Donovan, Selig, Donovan & Fraser Reference Selig, Donovan and Fraser1989), $ \textit{AR} = 3$
and
$ \textit{AR} = 3$
and $c = 10$
cm. Bubbles were generated by temporarily injecting air into the vortex core through an L-shaped cannula (figure 1
$c = 10$
cm. Bubbles were generated by temporarily injecting air into the vortex core through an L-shaped cannula (figure 1 $b$
). The control parameters are the angle of attack
$b$
). The control parameters are the angle of attack $\alpha$
of the wing and the chord-based Reynolds number
$\alpha$
of the wing and the chord-based Reynolds number $ \textit{Re} = \textit{Uc} / \nu$
, where
$ \textit{Re} = \textit{Uc} / \nu$
, where $U$
is the free-stream velocity and
$U$
is the free-stream velocity and $\nu$
the kinematic viscosity of water.
$\nu$
the kinematic viscosity of water.
Experimental set-up. The PIV plane is located 19 cm downstream of the wing trailing edge.

Bubbles were recorded with a digital camera (Nikon Coolpix P7800) at 25 Hz. The camera was placed at the height of the wing tip, 1 m from the test section, viewing the flow normal to the $y$
–
$y$
– $z$
plane shown in figure 1. Each frame was processed to identify the bubble contour and extract its position, radius, length and estimated volume. In addition, a monochrome high-speed camera (Phantom VEO 410L), positioned at the same location, recorded videos at 1000 Hz to resolve unsteady deformations of the bubble surface.
$z$
plane shown in figure 1. Each frame was processed to identify the bubble contour and extract its position, radius, length and estimated volume. In addition, a monochrome high-speed camera (Phantom VEO 410L), positioned at the same location, recorded videos at 1000 Hz to resolve unsteady deformations of the bubble surface.
The vortex flow was characterised by stereoscopic particle image velocimetry (PIV), using a laser and image acquisition system from Dantec Dynamics. Their Dynamic Studio 8 software was used to obtain the three fluid velocity components in a plane perpendicular to the free stream located 19 cm from the wing trailing edge. Measurements of the flow without a bubble were performed over a range of $\alpha$
and
$\alpha$
and $ \textit{Re}$
. To quantify how the bubble modifies the vortex, additional PIV measurements were made with a bubble located upstream of the measurement plane. These cases corresponded to conditions of maximum bubble stability, for which the bubble remained near its equilibrium position for extended times.
$ \textit{Re}$
. To quantify how the bubble modifies the vortex, additional PIV measurements were made with a bubble located upstream of the measurement plane. These cases corresponded to conditions of maximum bubble stability, for which the bubble remained near its equilibrium position for extended times.
3. Two-phase vortex breakdown
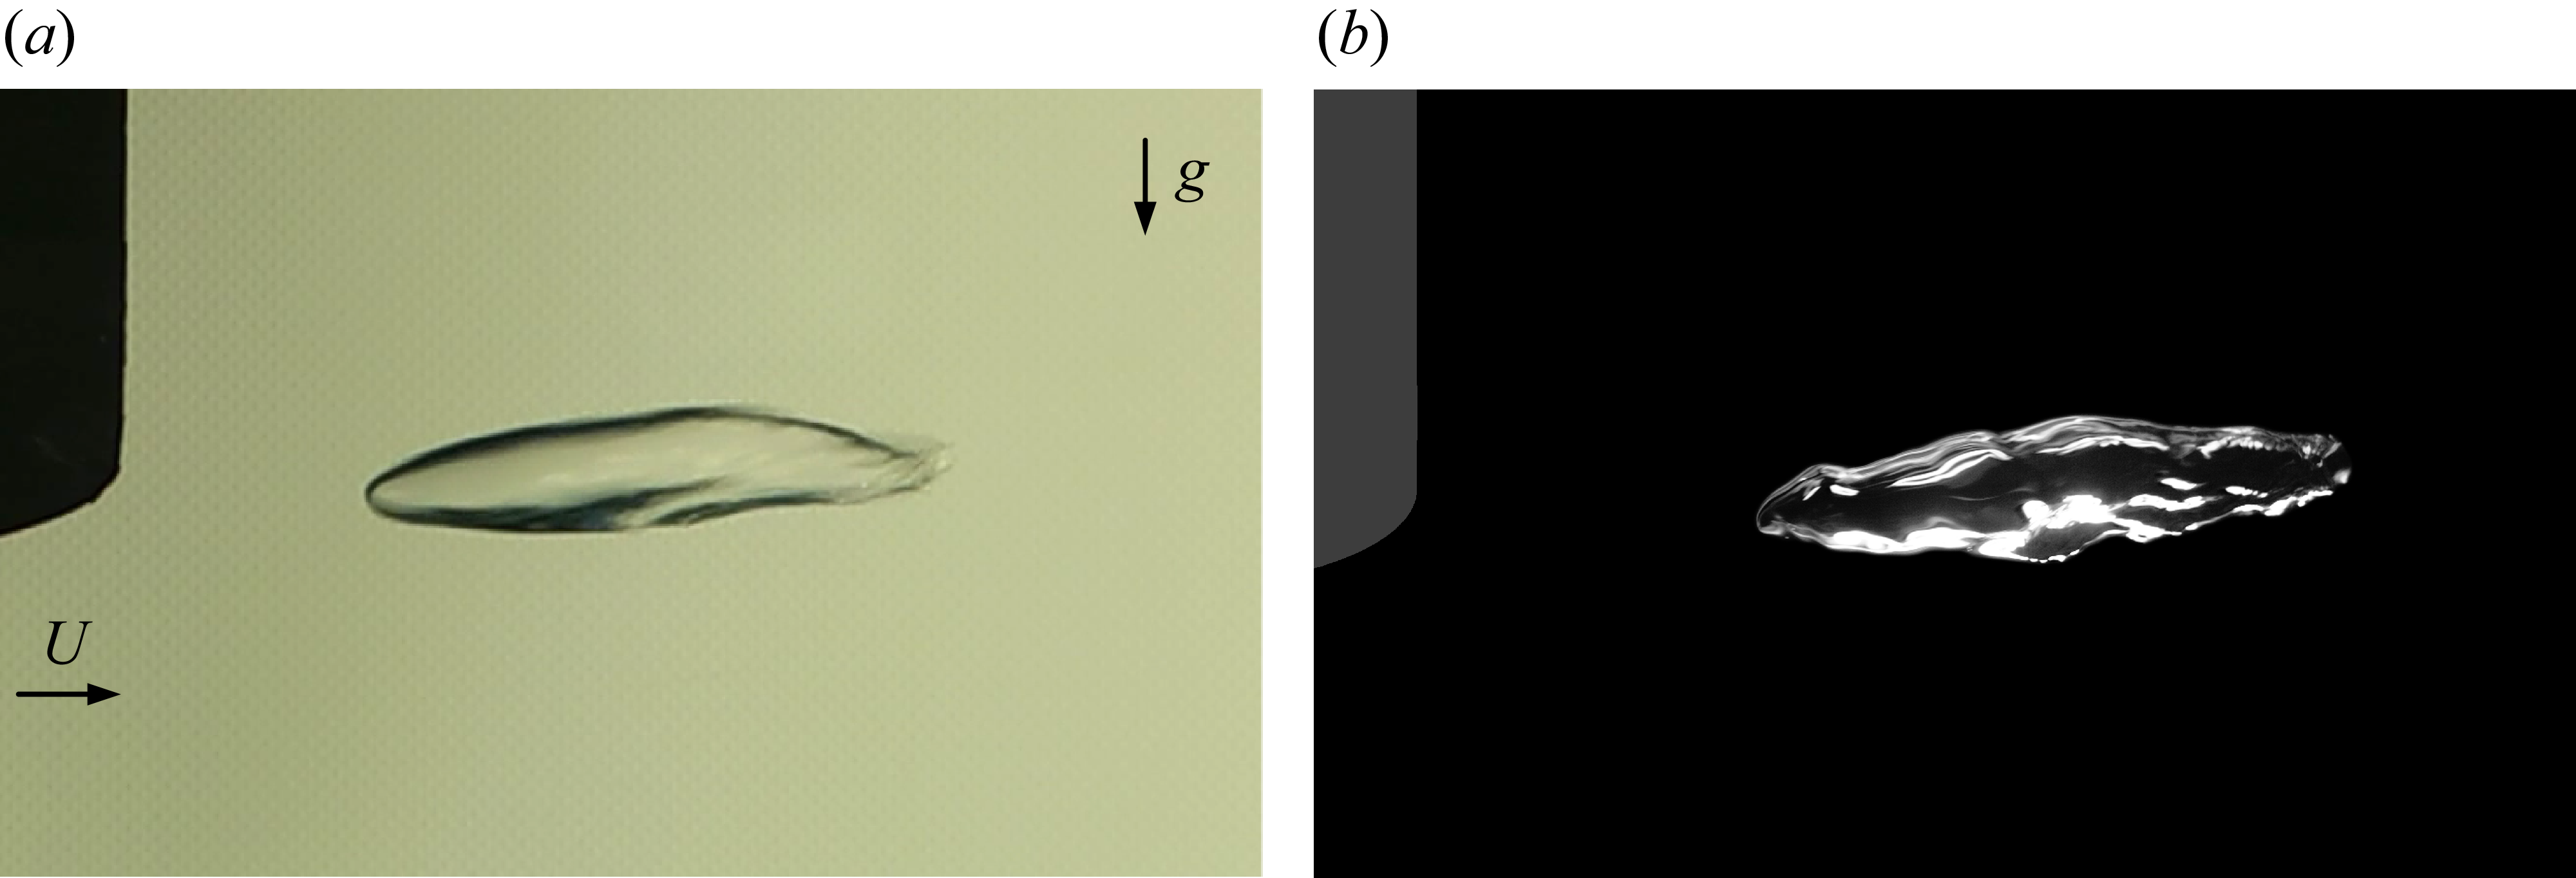
Figure 2 shows snapshot visualisations of the new vortex breakdown phenomenon, using two different exposure times; corresponding video sequences can be found in the supplementary material. The images show an elongated air bubble, located in the core of the wing-tip vortex at some distance from the trailing edge. This flow structure is generated by temporarily injecting air near the tip vortex centre using a cannula, with the orifice facing upstream. After stopping the air injection and removing the cannula, the bubble does not rise due to buoyancy or drift away with the free stream, but it migrates along the core to a particular position, where it remains in a quasi-stationary state. For the particular parameter set of figure 2, this can last for several minutes. The short-exposure image in figure 2( $b$
) shows that the bubble surface is actually unsteady, exhibiting random and helical perturbations, likely caused by the turbulent flow outside the vortex core. The bubble slowly loses air through a continuous stream of microbubbles leaking from its rear end, and occasional large turbulent fluctuations can also remove larger fragments of air. This leads to a steady decrease in volume, making the bubble increasingly susceptible to turbulent breakup, until it eventually disintegrates completely. The bubbles do not form spontaneously, e.g. through cavitation, since the vapour pressure of water is only a small fraction of the lowest pressure in the vortex core, which can be estimated from the measured velocity profiles (see figure 6).
$b$
) shows that the bubble surface is actually unsteady, exhibiting random and helical perturbations, likely caused by the turbulent flow outside the vortex core. The bubble slowly loses air through a continuous stream of microbubbles leaking from its rear end, and occasional large turbulent fluctuations can also remove larger fragments of air. This leads to a steady decrease in volume, making the bubble increasingly susceptible to turbulent breakup, until it eventually disintegrates completely. The bubbles do not form spontaneously, e.g. through cavitation, since the vapour pressure of water is only a small fraction of the lowest pressure in the vortex core, which can be estimated from the measured velocity profiles (see figure 6).


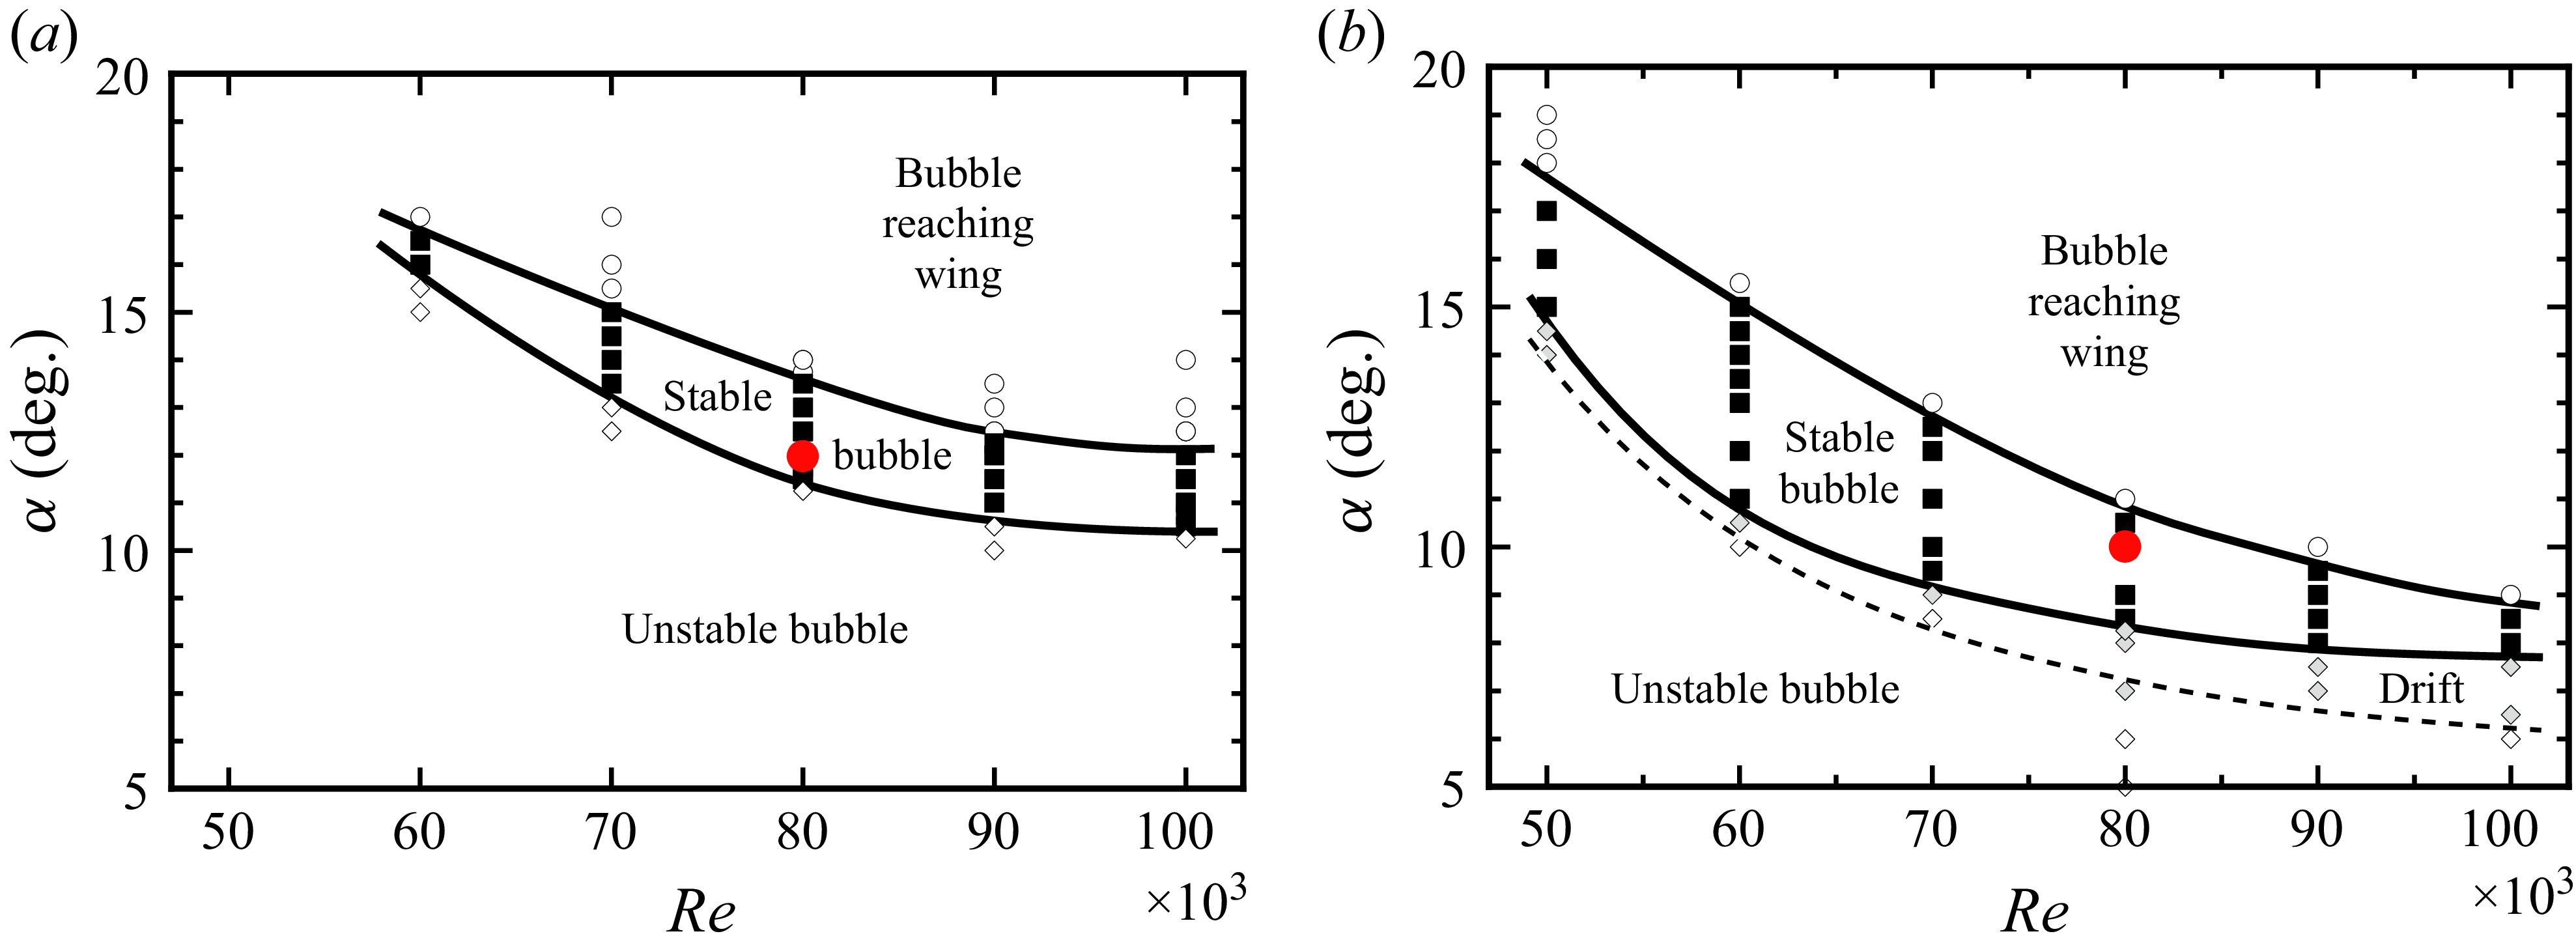
Depending on the angle of attack and the Reynolds number, several regimes can be identified. At low $\alpha$
and/or
$\alpha$
and/or $ \textit{Re}$
, bubbles cannot form. Either the injected air immediately rises to the water channel surface, when the pressure inside the vortex core is not low enough to overcome the bubble buoyancy, or the bubbles are unstable and break within a few seconds after the air injection is stopped. Above a certain threshold in
$ \textit{Re}$
, bubbles cannot form. Either the injected air immediately rises to the water channel surface, when the pressure inside the vortex core is not low enough to overcome the bubble buoyancy, or the bubbles are unstable and break within a few seconds after the air injection is stopped. Above a certain threshold in $\alpha$
and
$\alpha$
and $ \textit{Re}$
, a stable bubble (with a lifetime of at least 10 s) is generated, which migrates along the vortex core to an equilibrium position, generally within two chords from the trailing edge, where it remains and slowly dissipates, as described above. For higher values of
$ \textit{Re}$
, a stable bubble (with a lifetime of at least 10 s) is generated, which migrates along the vortex core to an equilibrium position, generally within two chords from the trailing edge, where it remains and slowly dissipates, as described above. For higher values of $\alpha$
and
$\alpha$
and $ \textit{Re}$
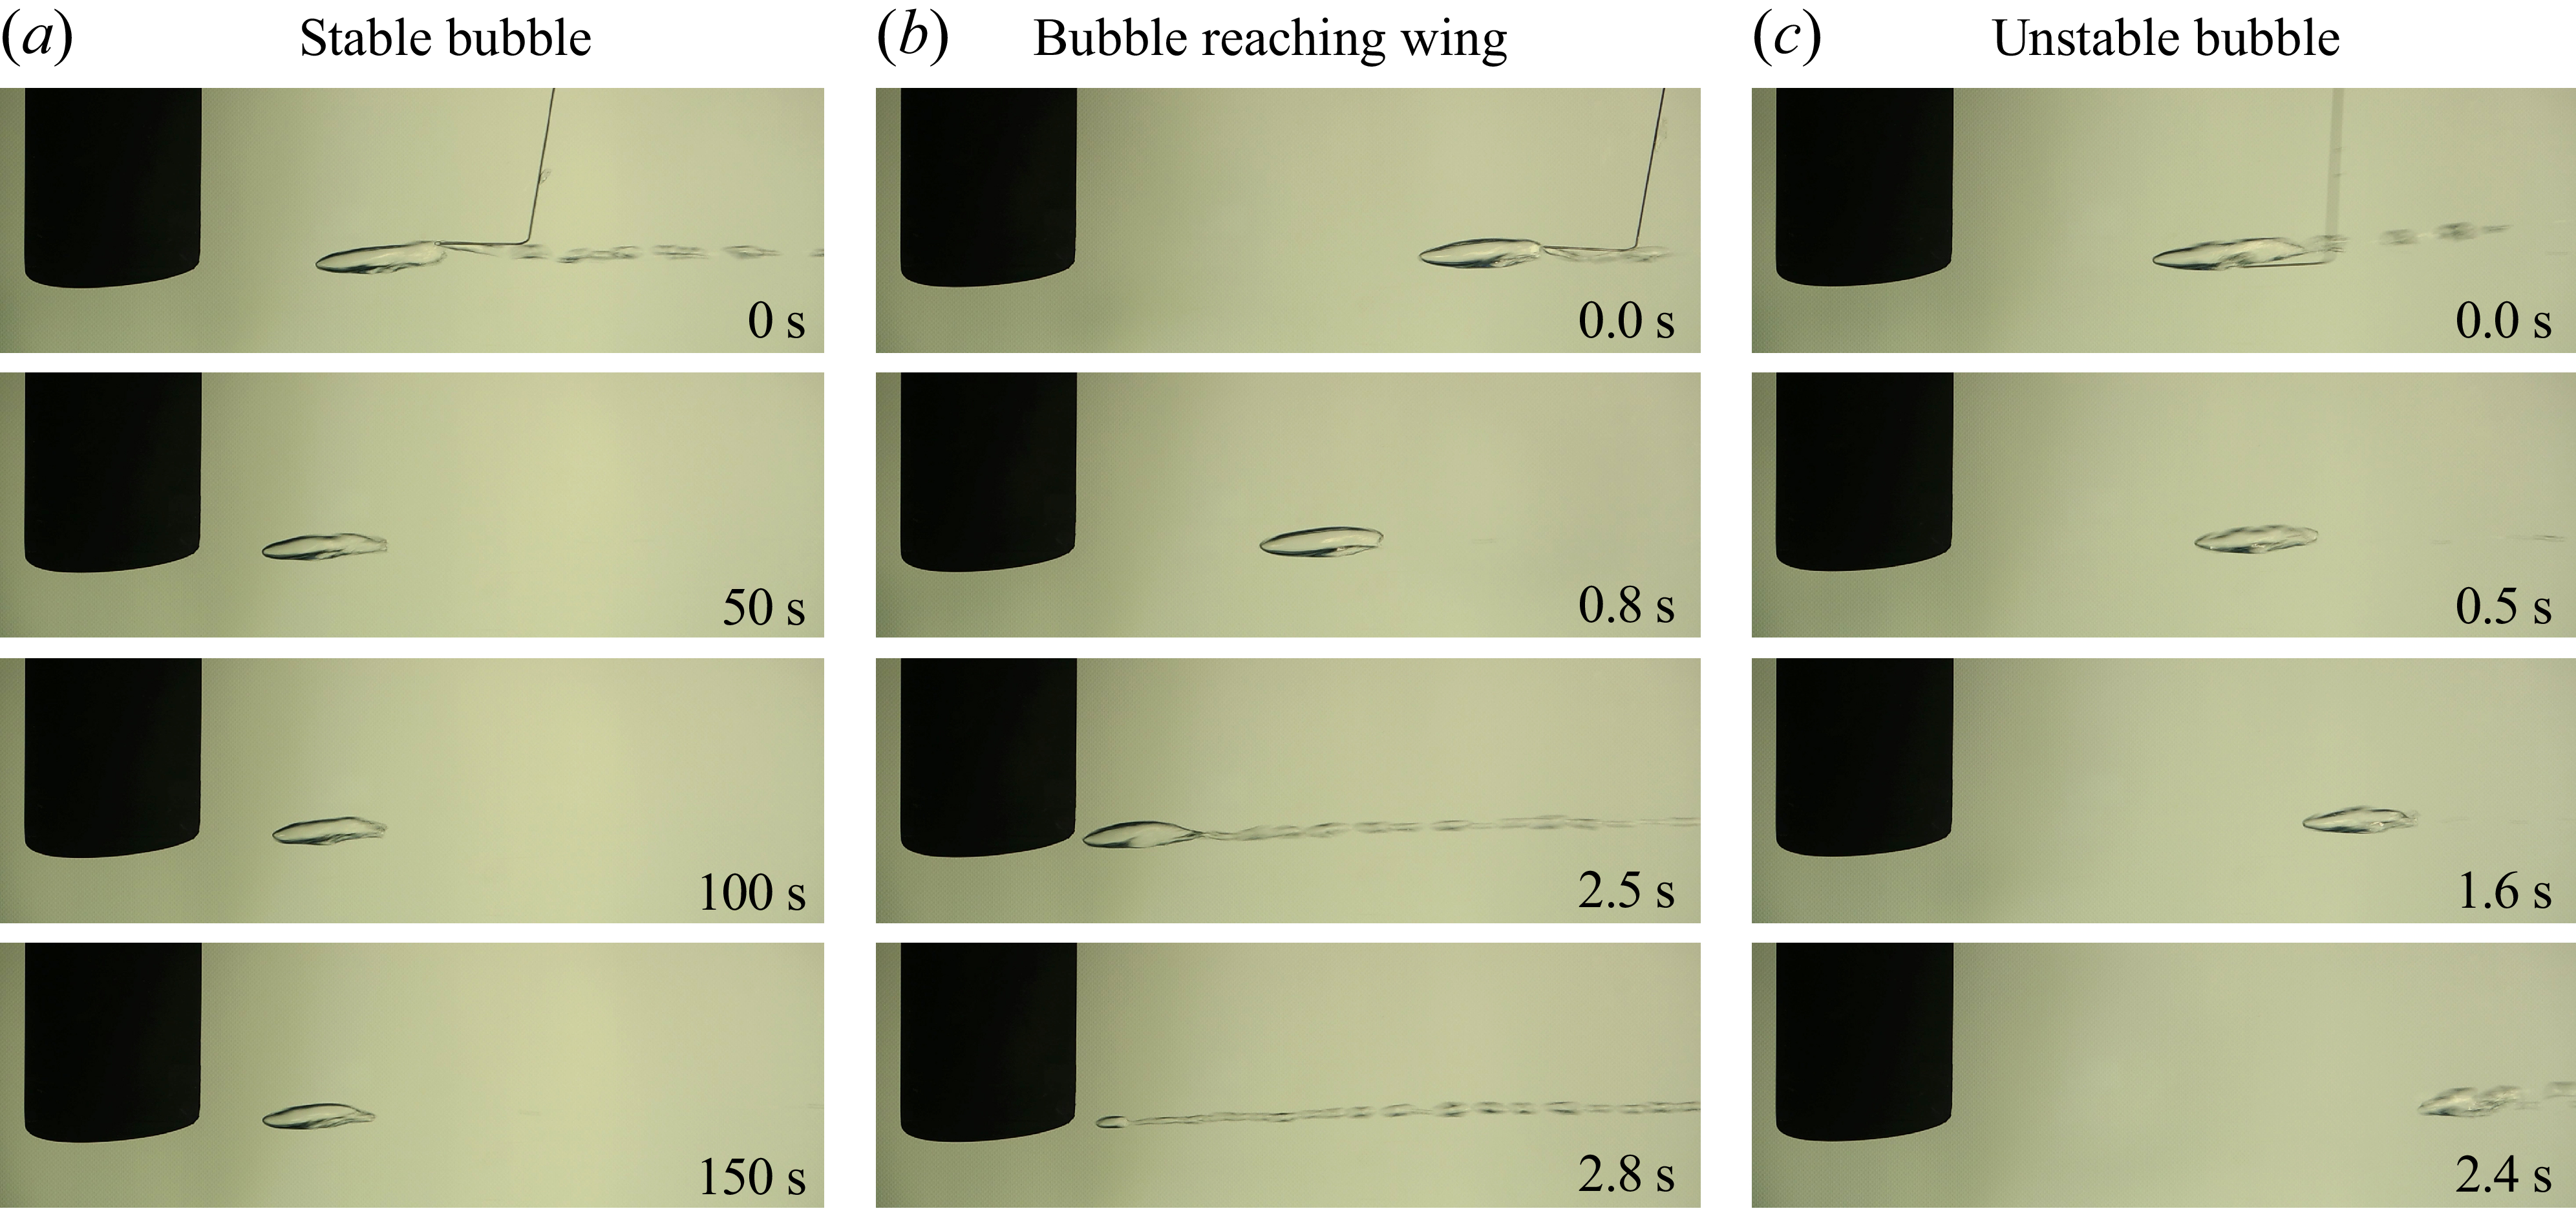
, a bubble is still formed; however, it moves upstream within the vortex core until it gets too close to the wing and breaks up. For the SD 7003 wing only, an additional regime is observed, where a bubble forms, but then continuously drifts downstream until it eventually breaks. Figure 3 shows representative time sequences for three of these regimes: stable bubbles, bubbles reaching the wing and unstable bubbles. Video sequences for all regimes can be found in the supplementary material. Figure 4 presents a regime map for each wing model, summarising the observations across the parameter space considered here:
$ \textit{Re}$
, a bubble is still formed; however, it moves upstream within the vortex core until it gets too close to the wing and breaks up. For the SD 7003 wing only, an additional regime is observed, where a bubble forms, but then continuously drifts downstream until it eventually breaks. Figure 3 shows representative time sequences for three of these regimes: stable bubbles, bubbles reaching the wing and unstable bubbles. Video sequences for all regimes can be found in the supplementary material. Figure 4 presents a regime map for each wing model, summarising the observations across the parameter space considered here: $\alpha =6^\circ$
–
$\alpha =6^\circ$
– $19^\circ$
and
$19^\circ$
and $ \textit{Re}=50\,000$
–
$ \textit{Re}=50\,000$
– $100\,000$
.
$100\,000$
.
Time sequences illustrating different bubble regimes for the NACA 0012 wing. (a) $\alpha =12^\circ$
,
$\alpha =12^\circ$
, $ \textit{Re}=80\,000$
; (b)
$ \textit{Re}=80\,000$
; (b) $\alpha =13^\circ$
,
$\alpha =13^\circ$
, $ \textit{Re}=90\,000$
; (c)
$ \textit{Re}=90\,000$
; (c) $\alpha =10^\circ$
,
$\alpha =10^\circ$
, $ \textit{Re}=90\,000$
. Movies 1, 3 and 4 in the supplementary material show the corresponding video sequences.
$ \textit{Re}=90\,000$
. Movies 1, 3 and 4 in the supplementary material show the corresponding video sequences.

Flow regimes in the $ \textit{Re}$
–
$ \textit{Re}$
– $\alpha$
parameter space; (a) NACA 0012 wing, (b) SD 7003 wing. The red dots indicate the conditions of maximum bubble lifetime. Filled symbols represent stationary bubbles, open symbols migrating or unstable bubbles.
$\alpha$
parameter space; (a) NACA 0012 wing, (b) SD 7003 wing. The red dots indicate the conditions of maximum bubble lifetime. Filled symbols represent stationary bubbles, open symbols migrating or unstable bubbles.

The bubble lifetime in the stable regime is variable for a given flow condition. It is mainly determined by the decrease of bubble volume caused by random turbulent fluctuations, as described above. The mean lifetime depends on the free-stream velocity, angle of attack and wing model, and varies smoothly across the parameter space. Optimal conditions for bubble stability are found around $\alpha = 12^\circ$
and
$\alpha = 12^\circ$
and $ \textit{Re} = 80\,000$
for the NACA 0012 wing, and
$ \textit{Re} = 80\,000$
for the NACA 0012 wing, and $\alpha = 10^\circ$
and
$\alpha = 10^\circ$
and $ \textit{Re} = 80\,000$
for the SD 7003 wing, with corresponding mean lifetimes of approximately 5 and 12 minutes, respectively. Bubble stability is highly sensitive to changes in the parameters, e.g. a variation of only
$ \textit{Re} = 80\,000$
for the SD 7003 wing, with corresponding mean lifetimes of approximately 5 and 12 minutes, respectively. Bubble stability is highly sensitive to changes in the parameters, e.g. a variation of only $0.5^\circ$
in
$0.5^\circ$
in $\alpha$
can shift the system from a stable configuration with long-lived bubbles to an unstable one.
$\alpha$
can shift the system from a stable configuration with long-lived bubbles to an unstable one.
4. Flow characteristics
Stereoscopic PIV measurements were made to characterise the tip vortex flow without a bubble for both wings across the parameter space, as well as for the most stable configurations with a bubble.
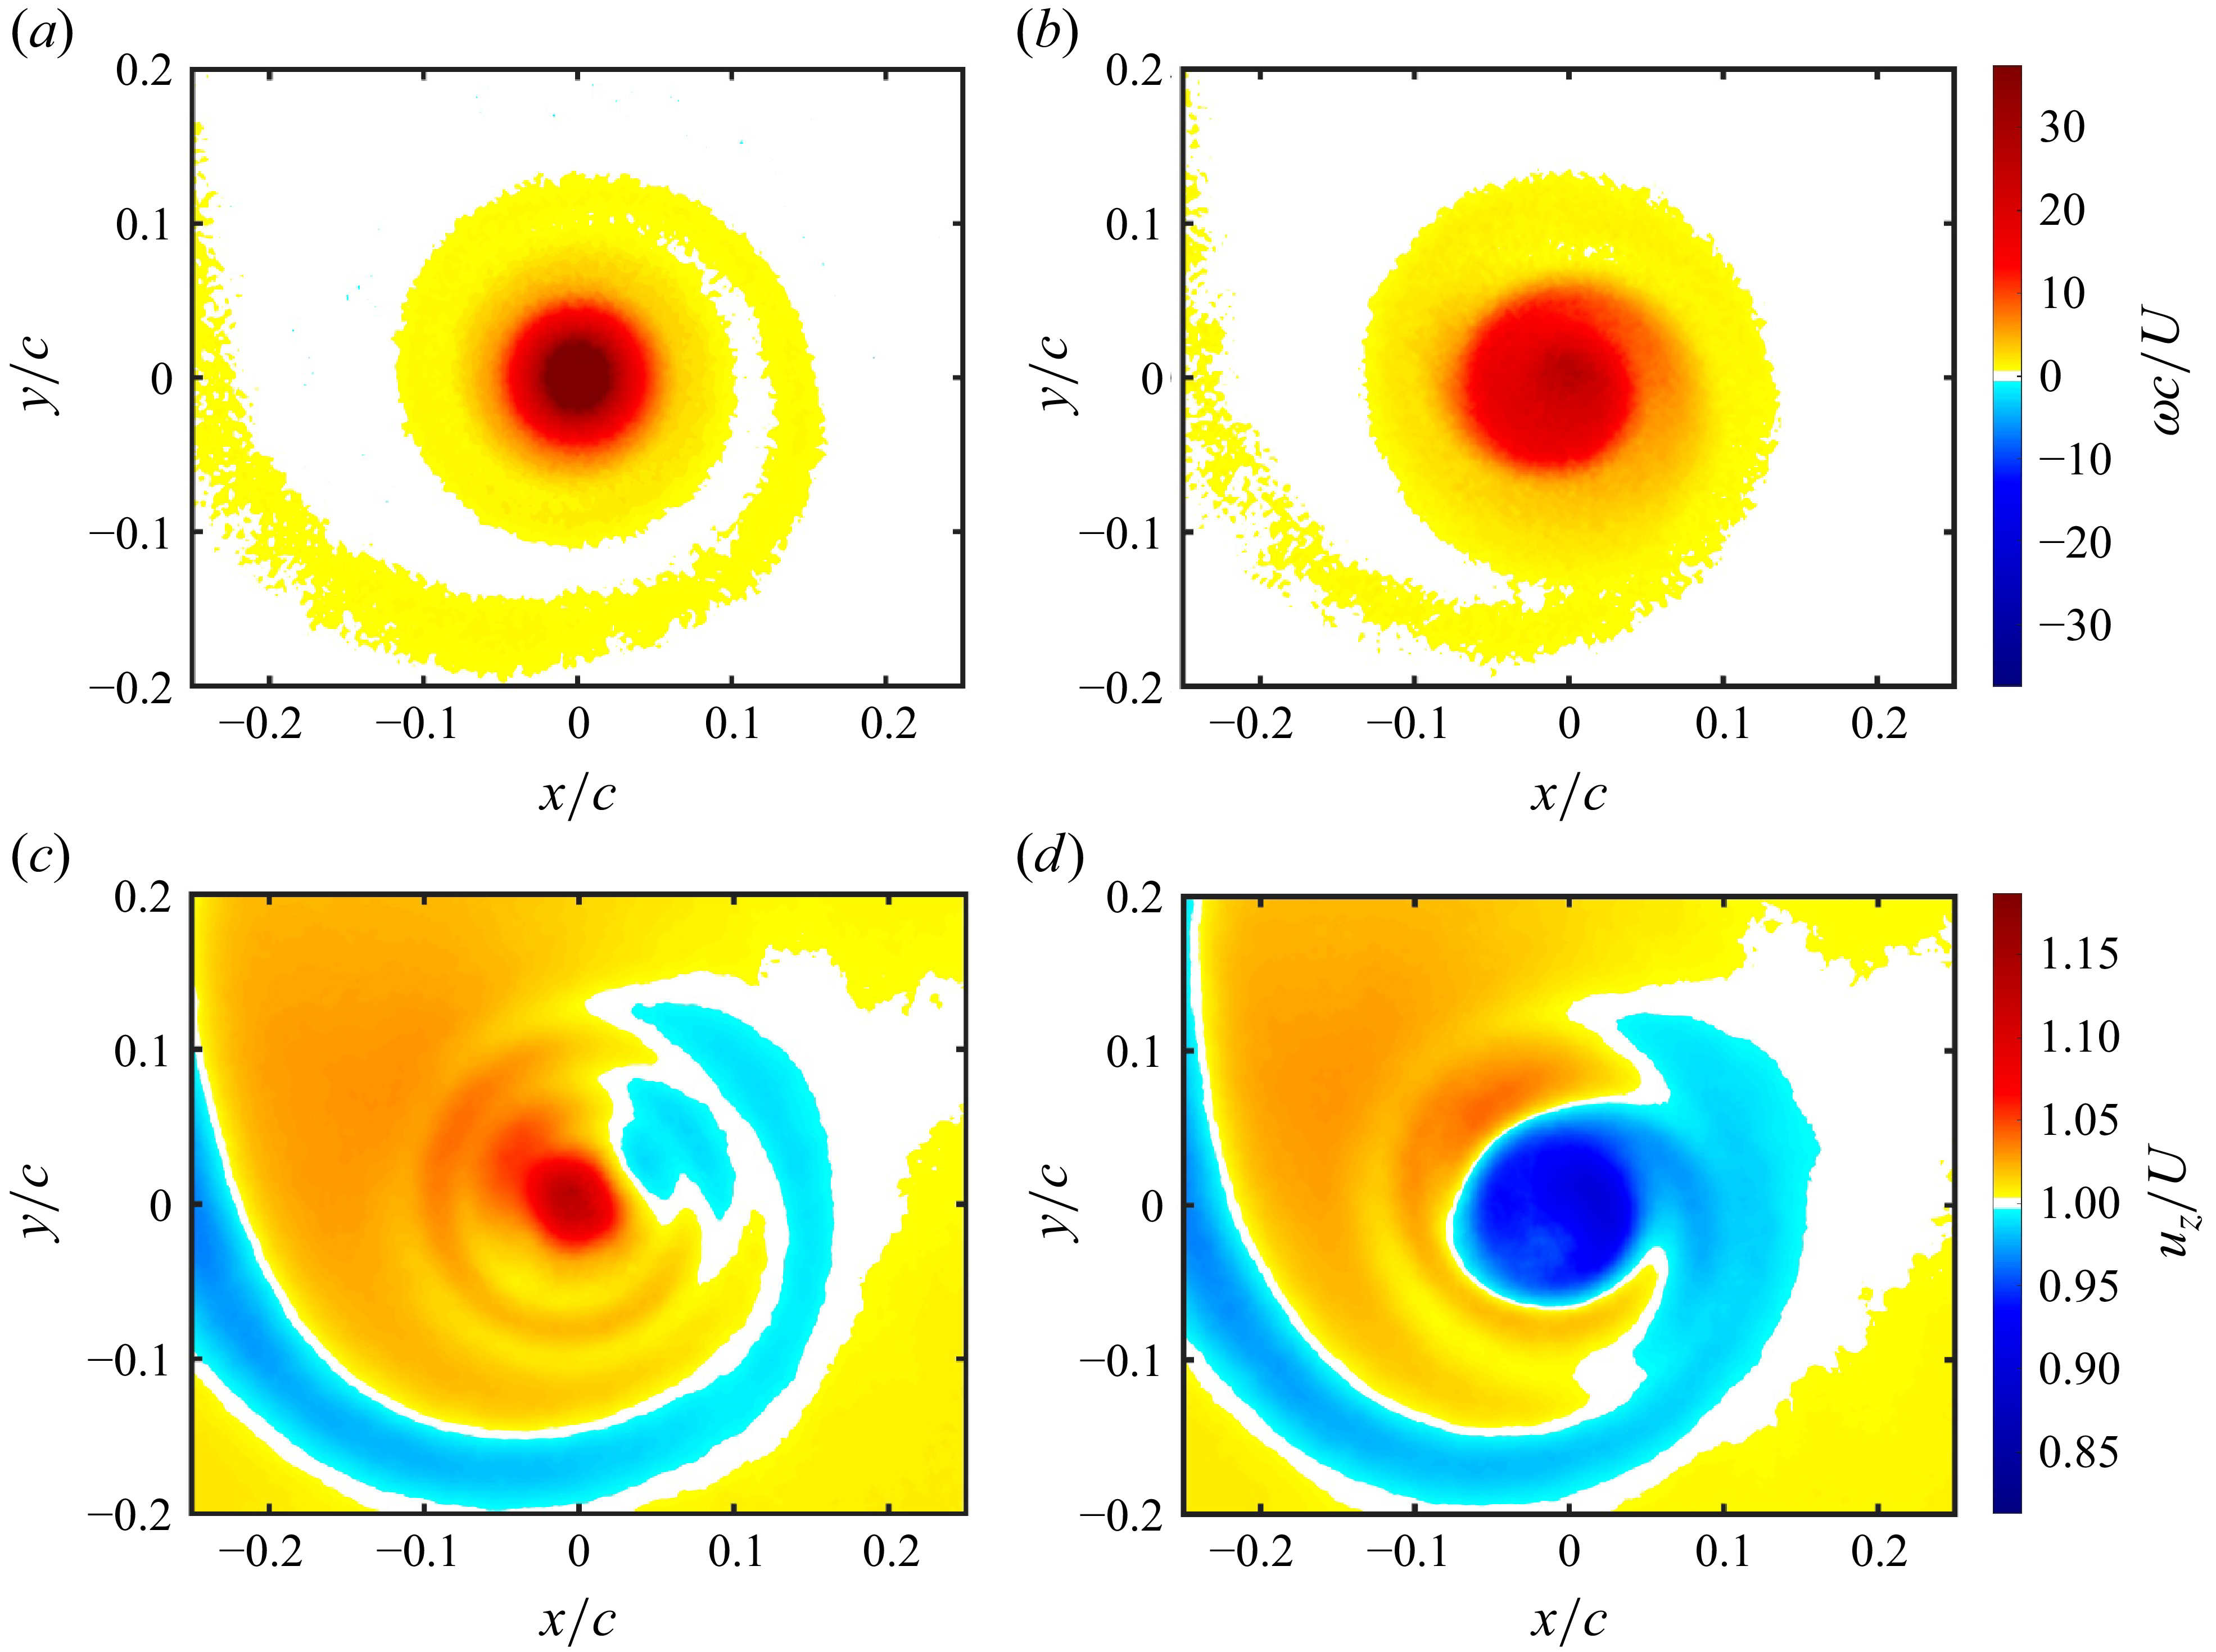
Figure 5 shows axial vorticity and axial velocity fields for the most stable case of the NACA 0012 profile, at $\alpha =12^\circ$
and
$\alpha =12^\circ$
and $ \textit{Re}=80\,000$
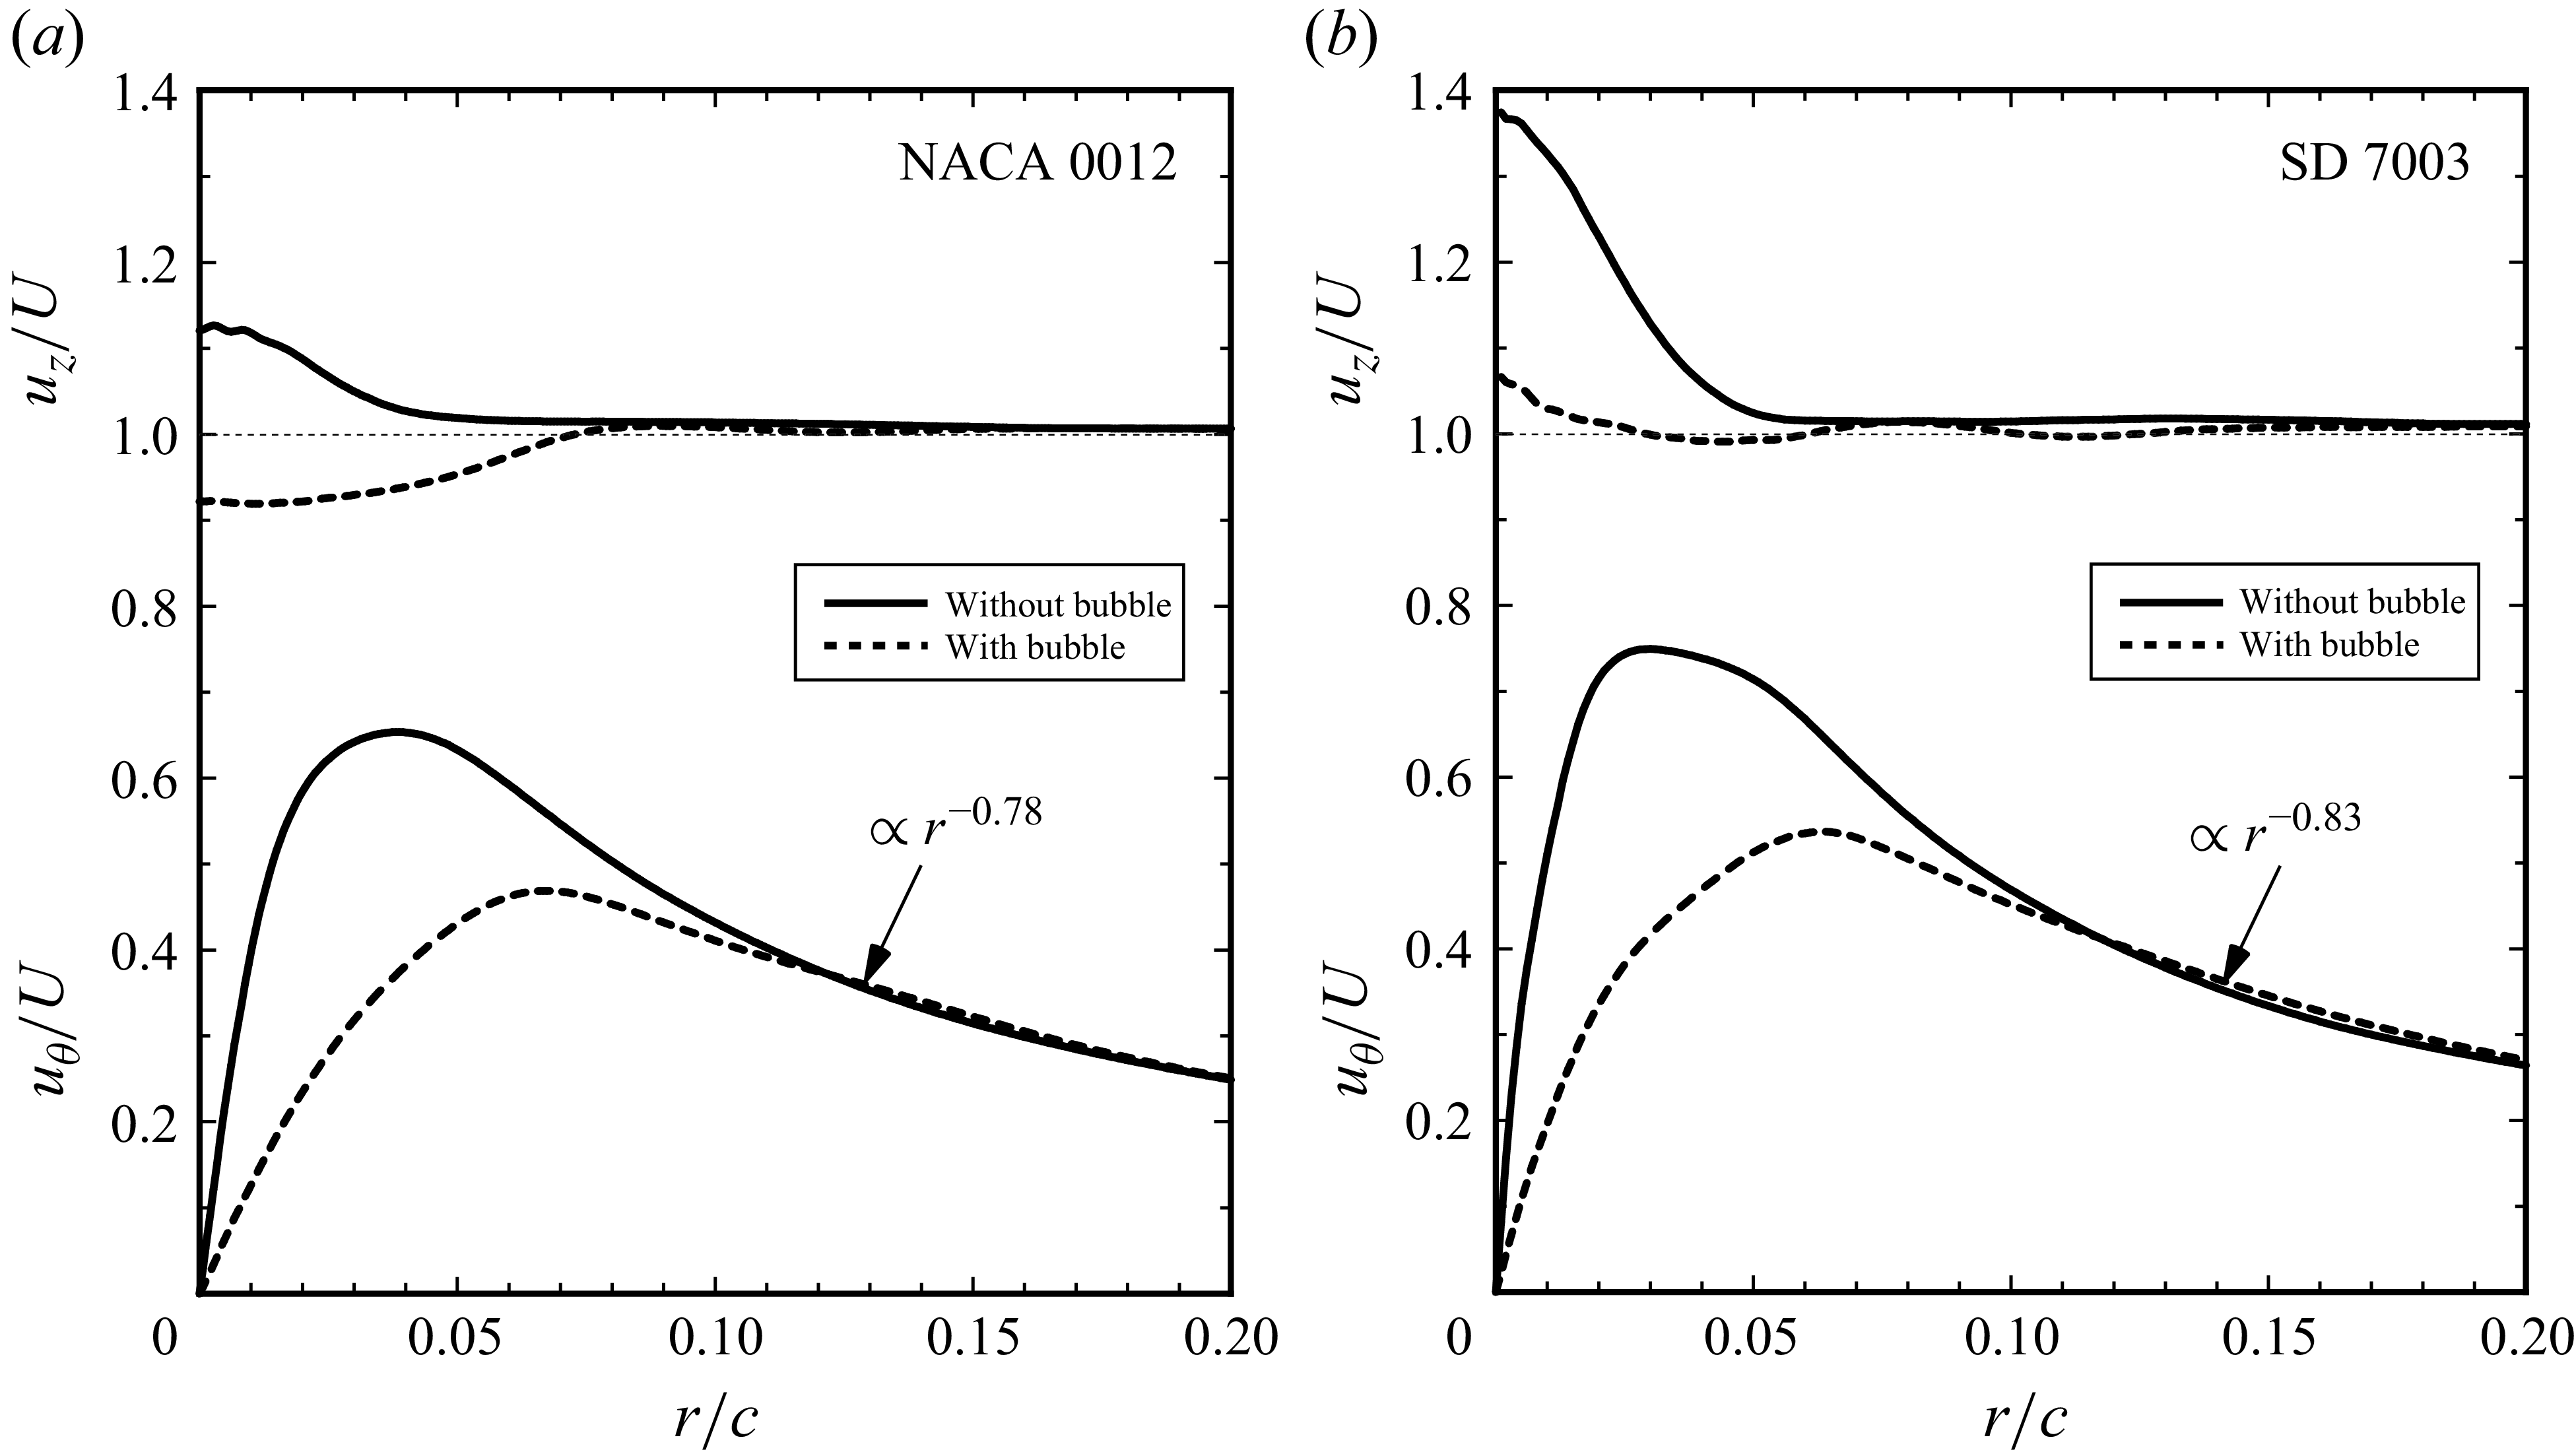
. Without the bubble, the core is very thin with a concentrated vorticity distribution, and the axial flow in the core is in excess of the free-stream velocity. In the presence of the bubble, the core vorticity peak is reduced and the axial flow changes to a wake-like distribution, with a velocity deficit in the centre. In both cases, the flow is not strictly axisymmetric: outside the core, vorticity and axial velocity deficit are concentrated in a layer that is still in the process of rolling up at the measurement position. Figure 6 shows profiles of azimuthally averaged axial and azimuthal velocities, in a cylindrical frame centred on the vortex, without and with the bubble for both wings. Far from the vortex centre, for
$ \textit{Re}=80\,000$
. Without the bubble, the core is very thin with a concentrated vorticity distribution, and the axial flow in the core is in excess of the free-stream velocity. In the presence of the bubble, the core vorticity peak is reduced and the axial flow changes to a wake-like distribution, with a velocity deficit in the centre. In both cases, the flow is not strictly axisymmetric: outside the core, vorticity and axial velocity deficit are concentrated in a layer that is still in the process of rolling up at the measurement position. Figure 6 shows profiles of azimuthally averaged axial and azimuthal velocities, in a cylindrical frame centred on the vortex, without and with the bubble for both wings. Far from the vortex centre, for $r/c \gtrsim 0.12$
, the flow is only weakly affected by the bubble, suggesting that the circulation is conserved and that the reduction in peak vorticity is primarily due to its radial redistribution. This redistribution results in a larger core radius and a lower maximum azimuthal velocity. The axial velocity is also reduced in both cases. Whereas for the NACA 0012 wing it changes sign, it still remains weakly jet-like for the SD 7003 wing, which may be related to the fact that the axial flow without a bubble is larger than for the NACA 0012 wing (see figure 7
$r/c \gtrsim 0.12$
, the flow is only weakly affected by the bubble, suggesting that the circulation is conserved and that the reduction in peak vorticity is primarily due to its radial redistribution. This redistribution results in a larger core radius and a lower maximum azimuthal velocity. The axial velocity is also reduced in both cases. Whereas for the NACA 0012 wing it changes sign, it still remains weakly jet-like for the SD 7003 wing, which may be related to the fact that the axial flow without a bubble is larger than for the NACA 0012 wing (see figure 7 $b$
).
$b$
).
Streamwise vorticity ( $a$
,
$a$
, $b$
) and velocity (
$b$
) and velocity ( $c$
,
$c$
, $d$
), measured at
$d$
), measured at $z/c$
= 2, for the NACA 0012 wing at
$z/c$
= 2, for the NACA 0012 wing at $\alpha =12^\circ$
and
$\alpha =12^\circ$
and $ \textit{Re}=80\,000$
(conditions of maximum bubble stability). Left column (
$ \textit{Re}=80\,000$
(conditions of maximum bubble stability). Left column ( $a$
,
$a$
, $c$
) without a bubble; right column (
$c$
) without a bubble; right column ( $b$
,
$b$
, $d$
) with a bubble upstream of the measurement plane (see figure 1
$d$
) with a bubble upstream of the measurement plane (see figure 1 $a$
).
$a$
).

Radial profiles of azimuthal ( $u_\theta$
) and axial (
$u_\theta$
) and axial ( $u_z$
) velocity at
$u_z$
) velocity at $z/c=2$
, without and with a bubble, for the respective conditions of maximum bubble stability for the two wings; (
$z/c=2$
, without and with a bubble, for the respective conditions of maximum bubble stability for the two wings; ( $a$
) NACA 0012 wing at
$a$
) NACA 0012 wing at $\alpha =12^\circ$
and (
$\alpha =12^\circ$
and ( $b$
) SD 7003 wing at
$b$
) SD 7003 wing at $\alpha =10^\circ$
, both at
$\alpha =10^\circ$
, both at $ \textit{Re}=80\,000$
.
$ \textit{Re}=80\,000$
.

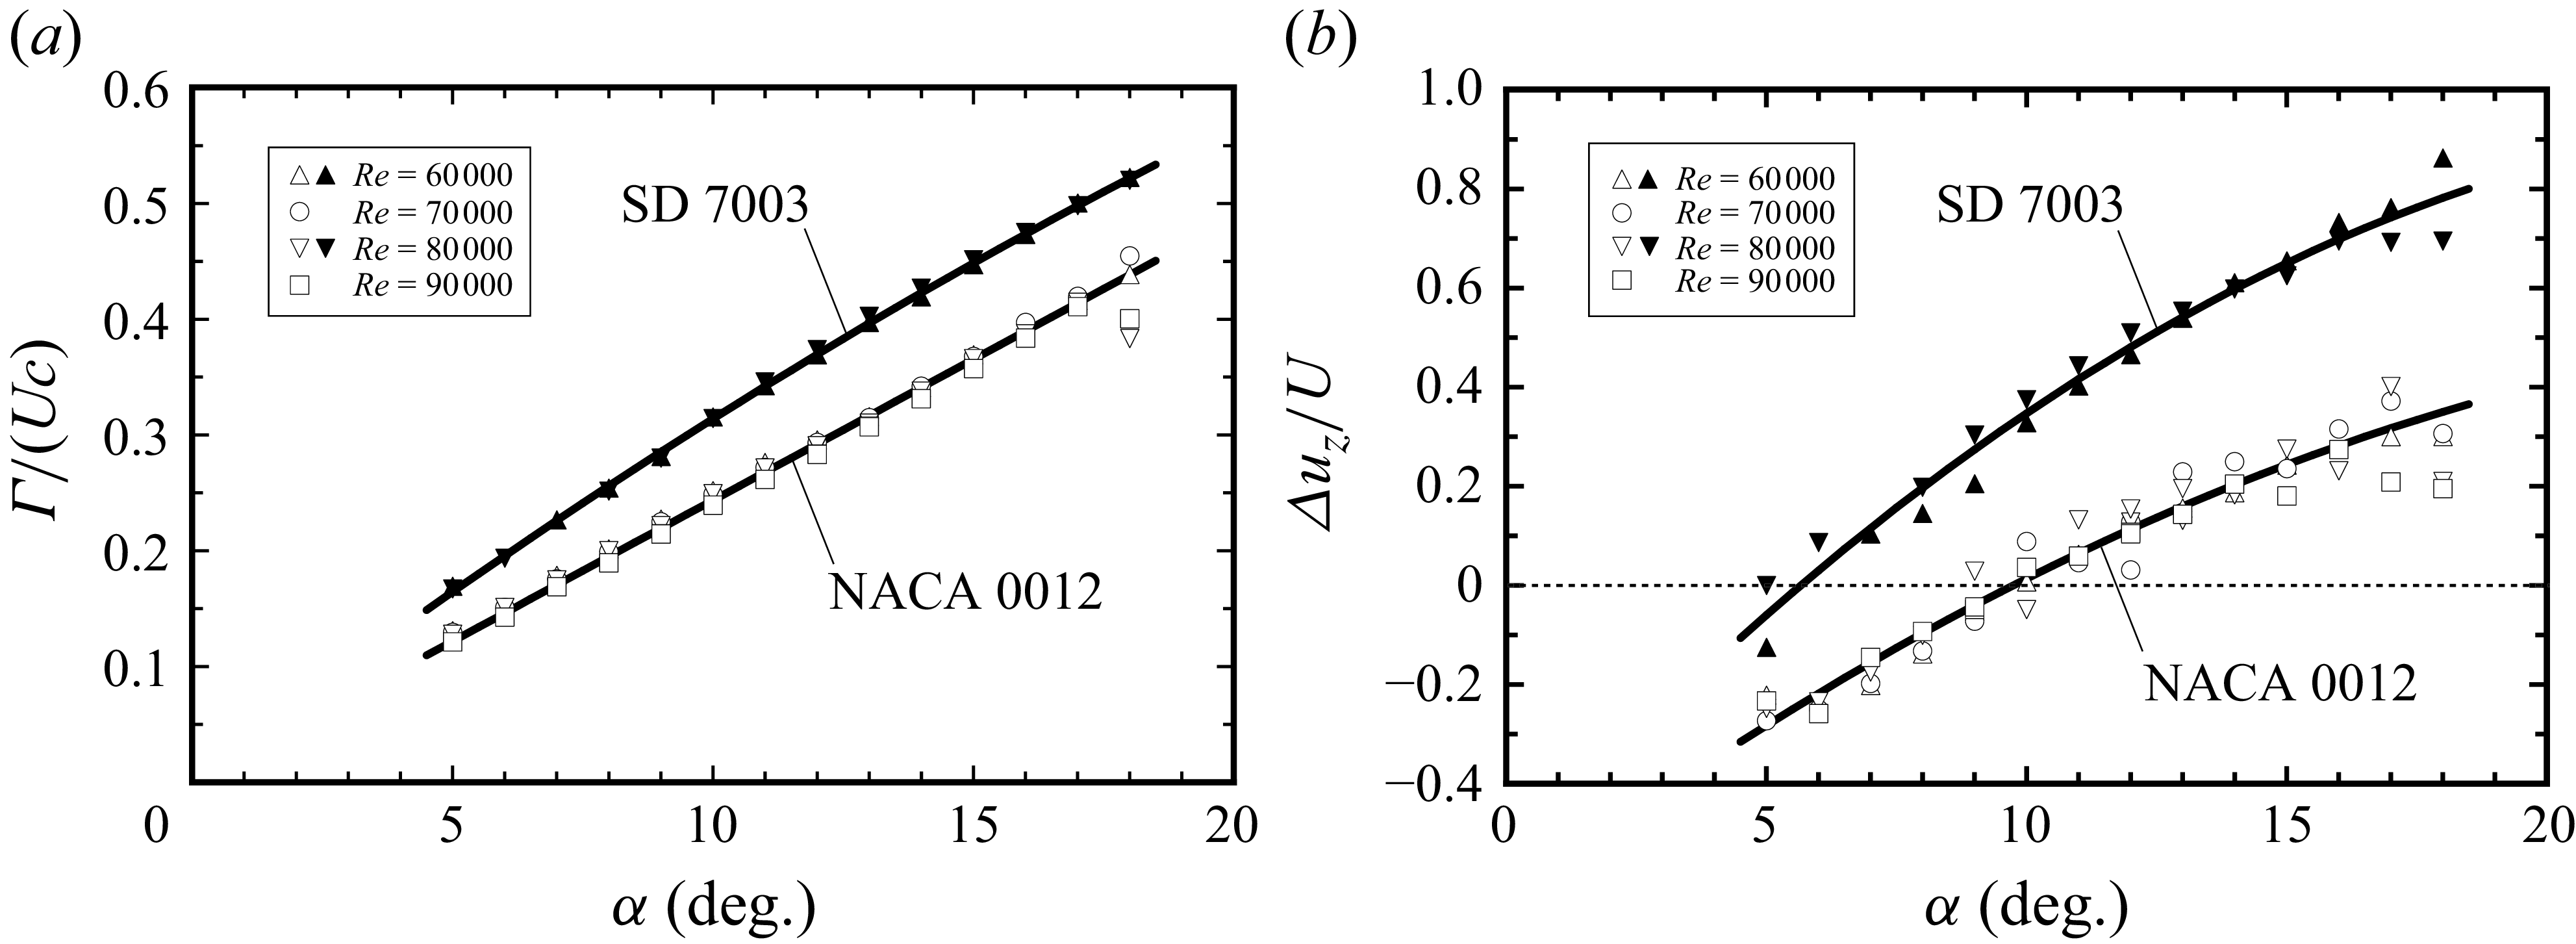
( $a$
) Vortex circulation and (
$a$
) Vortex circulation and ( $b$
) axial velocity deficit/excess in the vortex centre for both wings.
$b$
) axial velocity deficit/excess in the vortex centre for both wings.

The observed variations in the vortex velocity profiles due to the presence of the bubble may help elucidate the mechanisms that sustain the bubble at its equilibrium position, where the net force acting on it must be zero. The pressure on the vortex axis can be estimated as $p_0 = p_\infty - \rho \int _0^\infty (u_\theta ^2/r)\mathrm{d}r$
, where
$p_0 = p_\infty - \rho \int _0^\infty (u_\theta ^2/r)\mathrm{d}r$
, where $p_\infty$
is the free-stream pressure and
$p_\infty$
is the free-stream pressure and $\rho$
the fluid density, and the axial momentum flux is given by
$\rho$
the fluid density, and the axial momentum flux is given by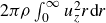 $2\pi \rho \int _0^\infty u_z^2r\mathrm{d}r$
. The profiles measured without a bubble approximately represent those upstream when a bubble is present. The decrease in axial momentum flux represents an effective drag force of the bubble. The core expansion and reduction in swirl velocity cause a pressure increase behind the bubble, with the resulting force in the axial direction balancing the drag.
$2\pi \rho \int _0^\infty u_z^2r\mathrm{d}r$
. The profiles measured without a bubble approximately represent those upstream when a bubble is present. The decrease in axial momentum flux represents an effective drag force of the bubble. The core expansion and reduction in swirl velocity cause a pressure increase behind the bubble, with the resulting force in the axial direction balancing the drag.
Figure 7 presents the tip vortex circulation $\varGamma$
, determined inside a circle of radius 0.15
$\varGamma$
, determined inside a circle of radius 0.15 $c$
around the centre, and the axial velocity excess/deficit
$c$
around the centre, and the axial velocity excess/deficit $\Delta u_z = u_z(r$
=
$\Delta u_z = u_z(r$
= $0)-U$
, for the two wings (without a bubble). Both show little variation with Reynolds number when non-dimensionalised by the free-stream velocity
$0)-U$
, for the two wings (without a bubble). Both show little variation with Reynolds number when non-dimensionalised by the free-stream velocity $U$
and the wing chord
$U$
and the wing chord $c$
. The non-dimensional velocity profiles also show no significant dependence on
$c$
. The non-dimensional velocity profiles also show no significant dependence on $ \textit{Re}$
, and the core size is essentially independent of the angle of attack, too.
$ \textit{Re}$
, and the core size is essentially independent of the angle of attack, too.
The data in figure 7 can be used to draw isocontours of the vortex Reynolds number $\varGamma /\nu$
, as well as the limit
$\varGamma /\nu$
, as well as the limit $\Delta u_z =0$
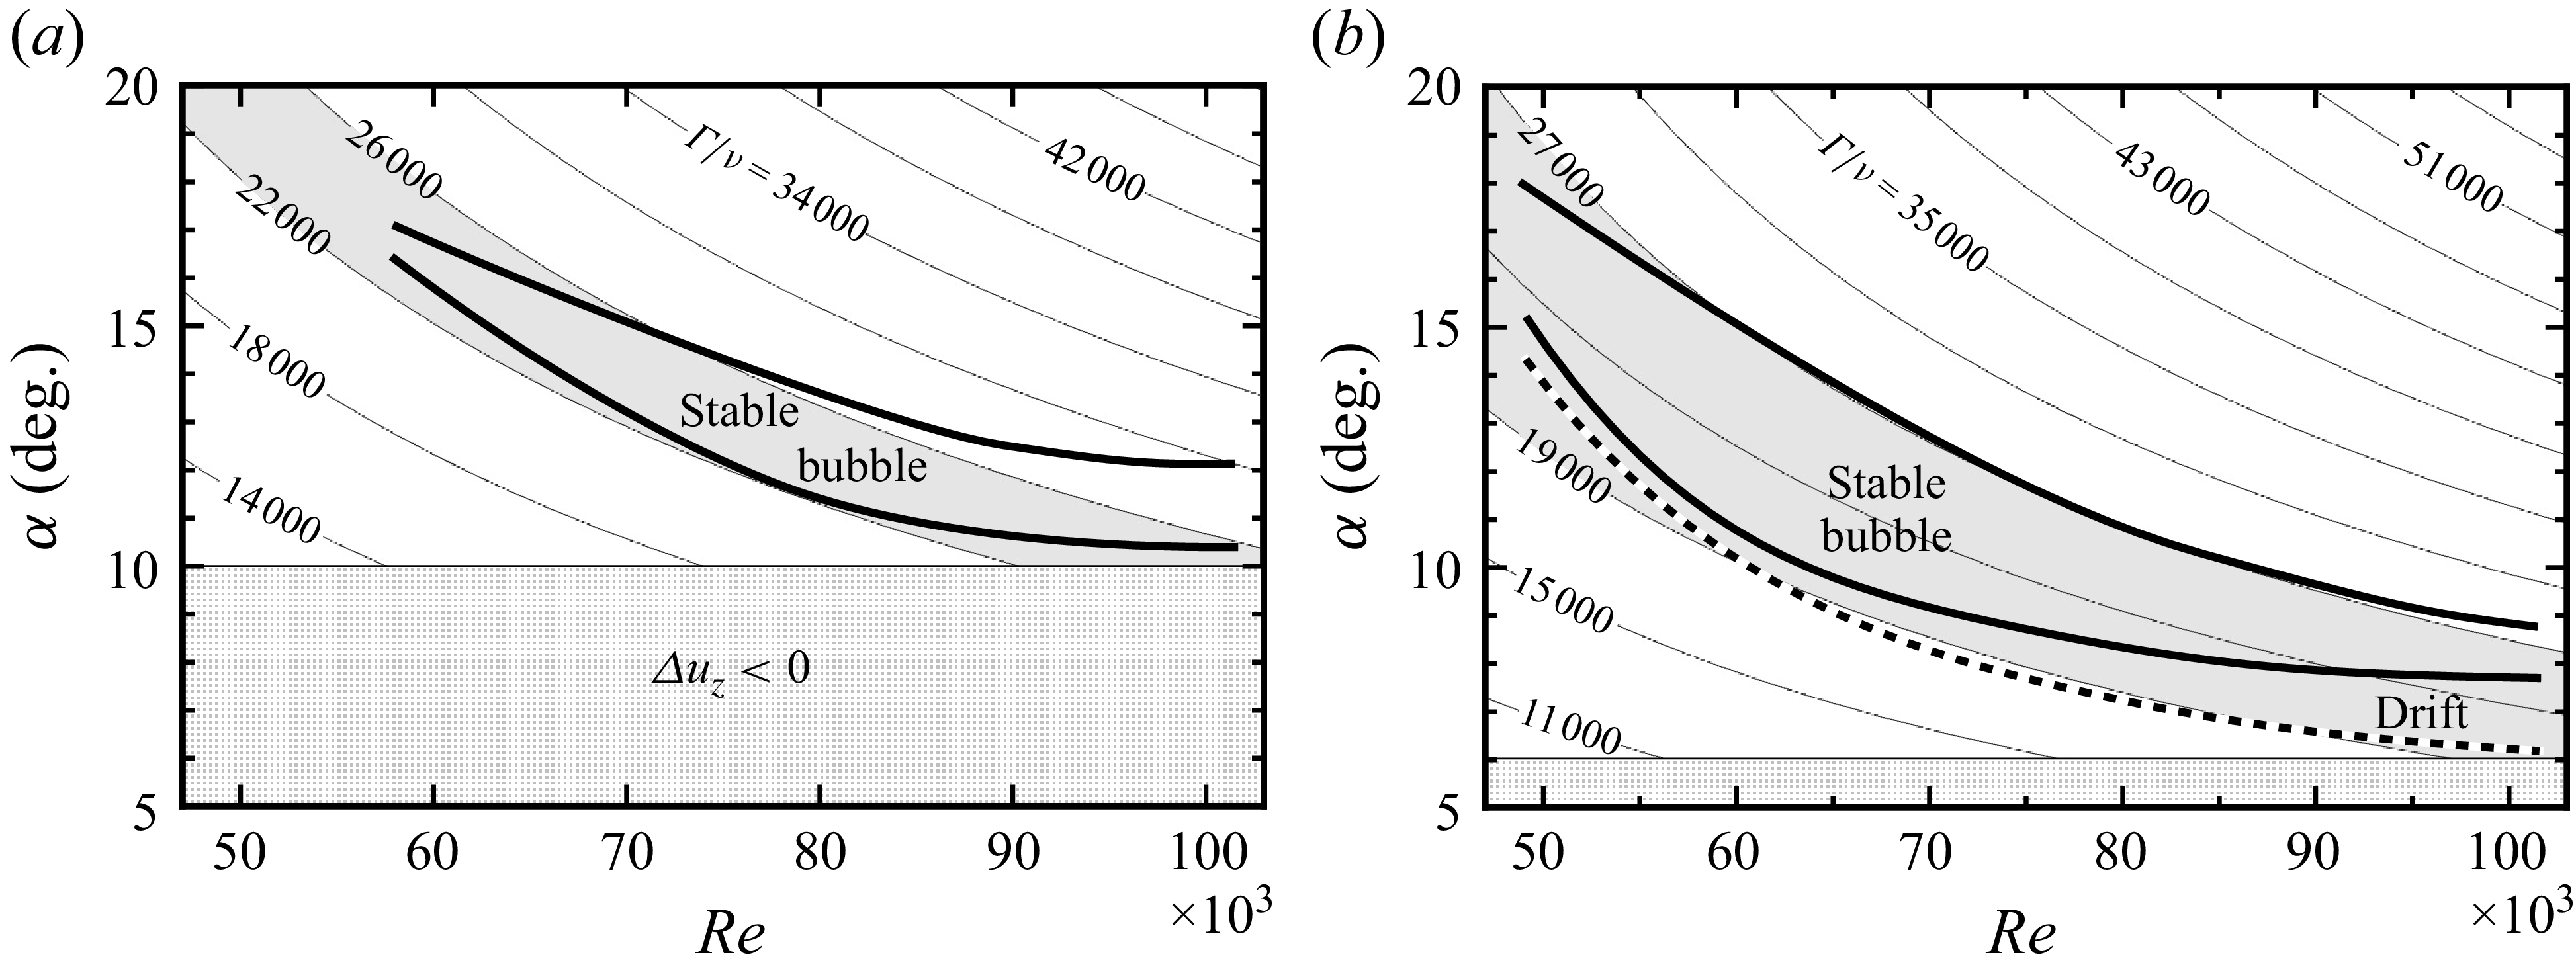
, in the parameter space of figure 4. The result is seen in figure 8 for the two wings. The contours align reasonably well with the regime boundaries for the bubble behaviour. This can be qualitatively understood by the balance between bubble drag, which depends on
$\Delta u_z =0$
, in the parameter space of figure 4. The result is seen in figure 8 for the two wings. The contours align reasonably well with the regime boundaries for the bubble behaviour. This can be qualitatively understood by the balance between bubble drag, which depends on $U$
, and the axial pressure difference, which depends on
$U$
, and the axial pressure difference, which depends on $\varGamma$
, as explained above (
$\varGamma$
, as explained above ( $u_\theta \propto \varGamma$
). The buoyancy of the bubble does not enter the axial force balance for the horizontal tip vortex in our flow. One can expect that for inclined or vertical vortices, the regime diagrams would differ significantly, or it may not even be possible to observe stable bubbles at all. At high
$u_\theta \propto \varGamma$
). The buoyancy of the bubble does not enter the axial force balance for the horizontal tip vortex in our flow. One can expect that for inclined or vertical vortices, the regime diagrams would differ significantly, or it may not even be possible to observe stable bubbles at all. At high $ \textit{Re}$
, the lower bound for bubble stability approaches the limit of zero axial velocity excess. A jet-like core flow appears to be a necessary condition for bubble formation in the wing configurations considered in this study. The results in figure 8 (and figure 4) suggest that the stable-bubble regime may disappear as
$ \textit{Re}$
, the lower bound for bubble stability approaches the limit of zero axial velocity excess. A jet-like core flow appears to be a necessary condition for bubble formation in the wing configurations considered in this study. The results in figure 8 (and figure 4) suggest that the stable-bubble regime may disappear as $ \textit{Re}$
is increased beyond the range accessible in this study, and that injected bubbles may then always migrate upstream towards the wing.
$ \textit{Re}$
is increased beyond the range accessible in this study, and that injected bubbles may then always migrate upstream towards the wing.
Isocontours of the vortex Reynolds number $\varGamma /\nu$
in the parameter space of figure 4; (
$\varGamma /\nu$
in the parameter space of figure 4; ( $a$
) NACA 0012 wing, (
$a$
) NACA 0012 wing, ( $b$
) SD 7003 wing. The regions where the tip vortex core has an axial velocity deficit are also shown.
$b$
) SD 7003 wing. The regions where the tip vortex core has an axial velocity deficit are also shown.

5. Bubble properties
The bubble dimensions (radius $R$
and length
$R$
and length $L$
) and equilibrium positions
$L$
) and equilibrium positions $z_b$
were measured from visualisation videos over a range of
$z_b$
were measured from visualisation videos over a range of $\alpha$
and
$\alpha$
and $ \textit{Re}$
. In the following, we analyse how the bubble properties depend on the flow characteristics obtained from PIV in the previous section, focussing primarily on the SD 7003 wing in stable configurations.
$ \textit{Re}$
. In the following, we analyse how the bubble properties depend on the flow characteristics obtained from PIV in the previous section, focussing primarily on the SD 7003 wing in stable configurations.
For given values of $\alpha$
and
$\alpha$
and $ \textit{Re}$
, bubbles of different sizes can be generated, but both
$ \textit{Re}$
, bubbles of different sizes can be generated, but both $R$
and
$R$
and $L$
have upper bounds,
$L$
have upper bounds, $R_m$
and
$R_m$
and $L_m$
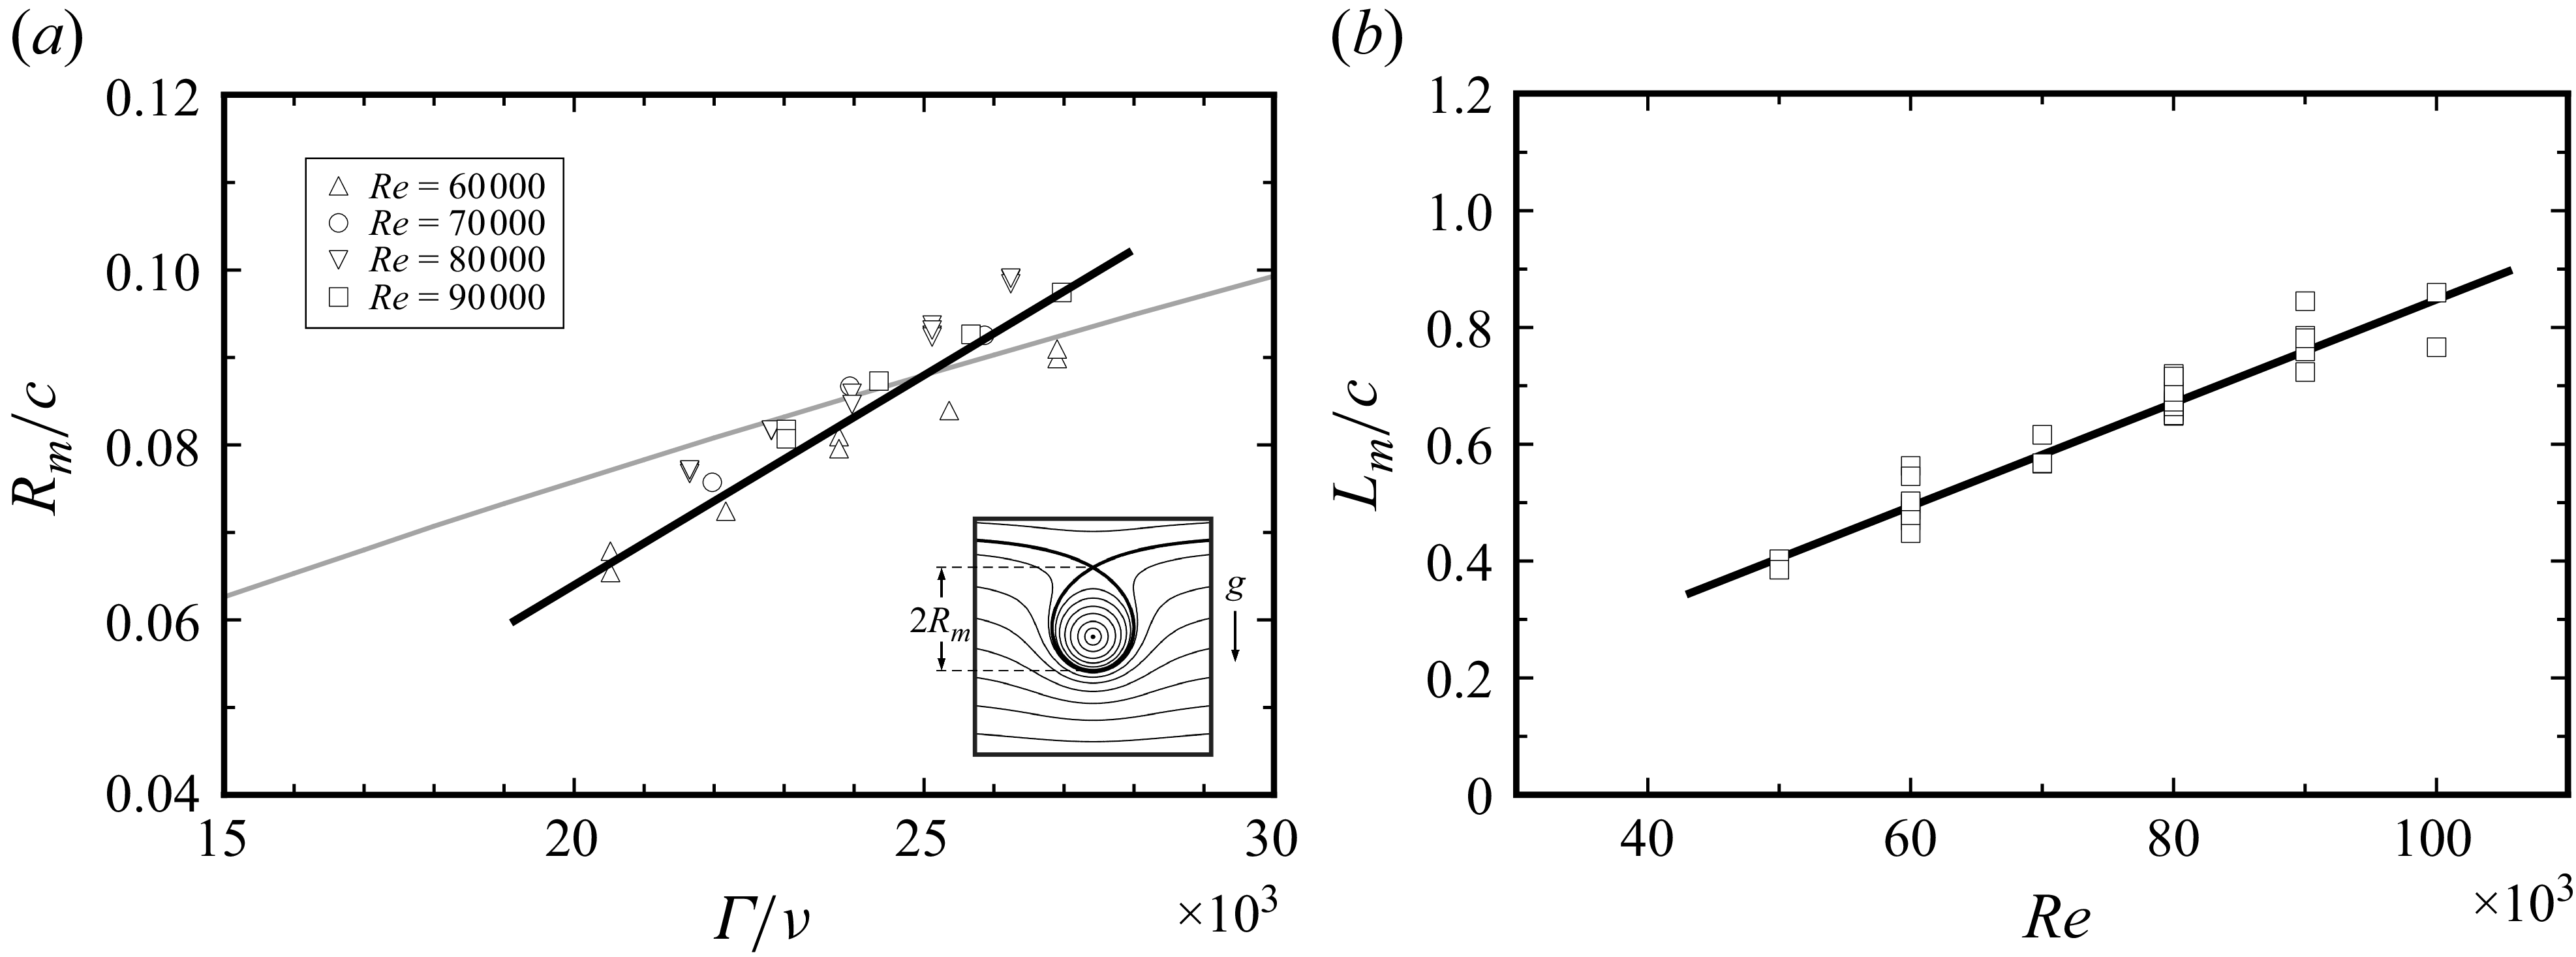
, respectively. Figure 9(
$L_m$
, respectively. Figure 9( $a$
) shows that the maximum radius
$a$
) shows that the maximum radius $R_m$
correlates with the measured vortex circulation, increasing approximately linearly with it in the observed range. An analysis of this dependence is presented in § 6.2. By contrast, the maximum bubble length
$R_m$
correlates with the measured vortex circulation, increasing approximately linearly with it in the observed range. An analysis of this dependence is presented in § 6.2. By contrast, the maximum bubble length $L_m$
varies primarily with the chord-based Reynolds number
$L_m$
varies primarily with the chord-based Reynolds number $ \textit{Re}$
(figure 9
$ \textit{Re}$
(figure 9 $b$
), the effect of
$b$
), the effect of $\alpha$
being small. Furthermore, measurements made on different bubbles obtained under fixed conditions show that the bubble length scales approximately with the square of the radius,
$\alpha$
being small. Furthermore, measurements made on different bubbles obtained under fixed conditions show that the bubble length scales approximately with the square of the radius, $L \propto R^{2}$
, although the proportionality factor varies with the flow condition.
$L \propto R^{2}$
, although the proportionality factor varies with the flow condition.
Maximum bubble radius ( $a$
) and length (
$a$
) and length ( $b$
) for stable configurations with the SD 7003 wing. In (
$b$
) for stable configurations with the SD 7003 wing. In ( $a$
), the inset shows qualitatively the pressure contours in a cross-section of the tip vortex, obtained by considering a horizontal potential vortex in a hydrostatic pressure gradient (see § 6.2), and the grey line represents equation (6.3).
$a$
), the inset shows qualitatively the pressure contours in a cross-section of the tip vortex, obtained by considering a horizontal potential vortex in a hydrostatic pressure gradient (see § 6.2), and the grey line represents equation (6.3).

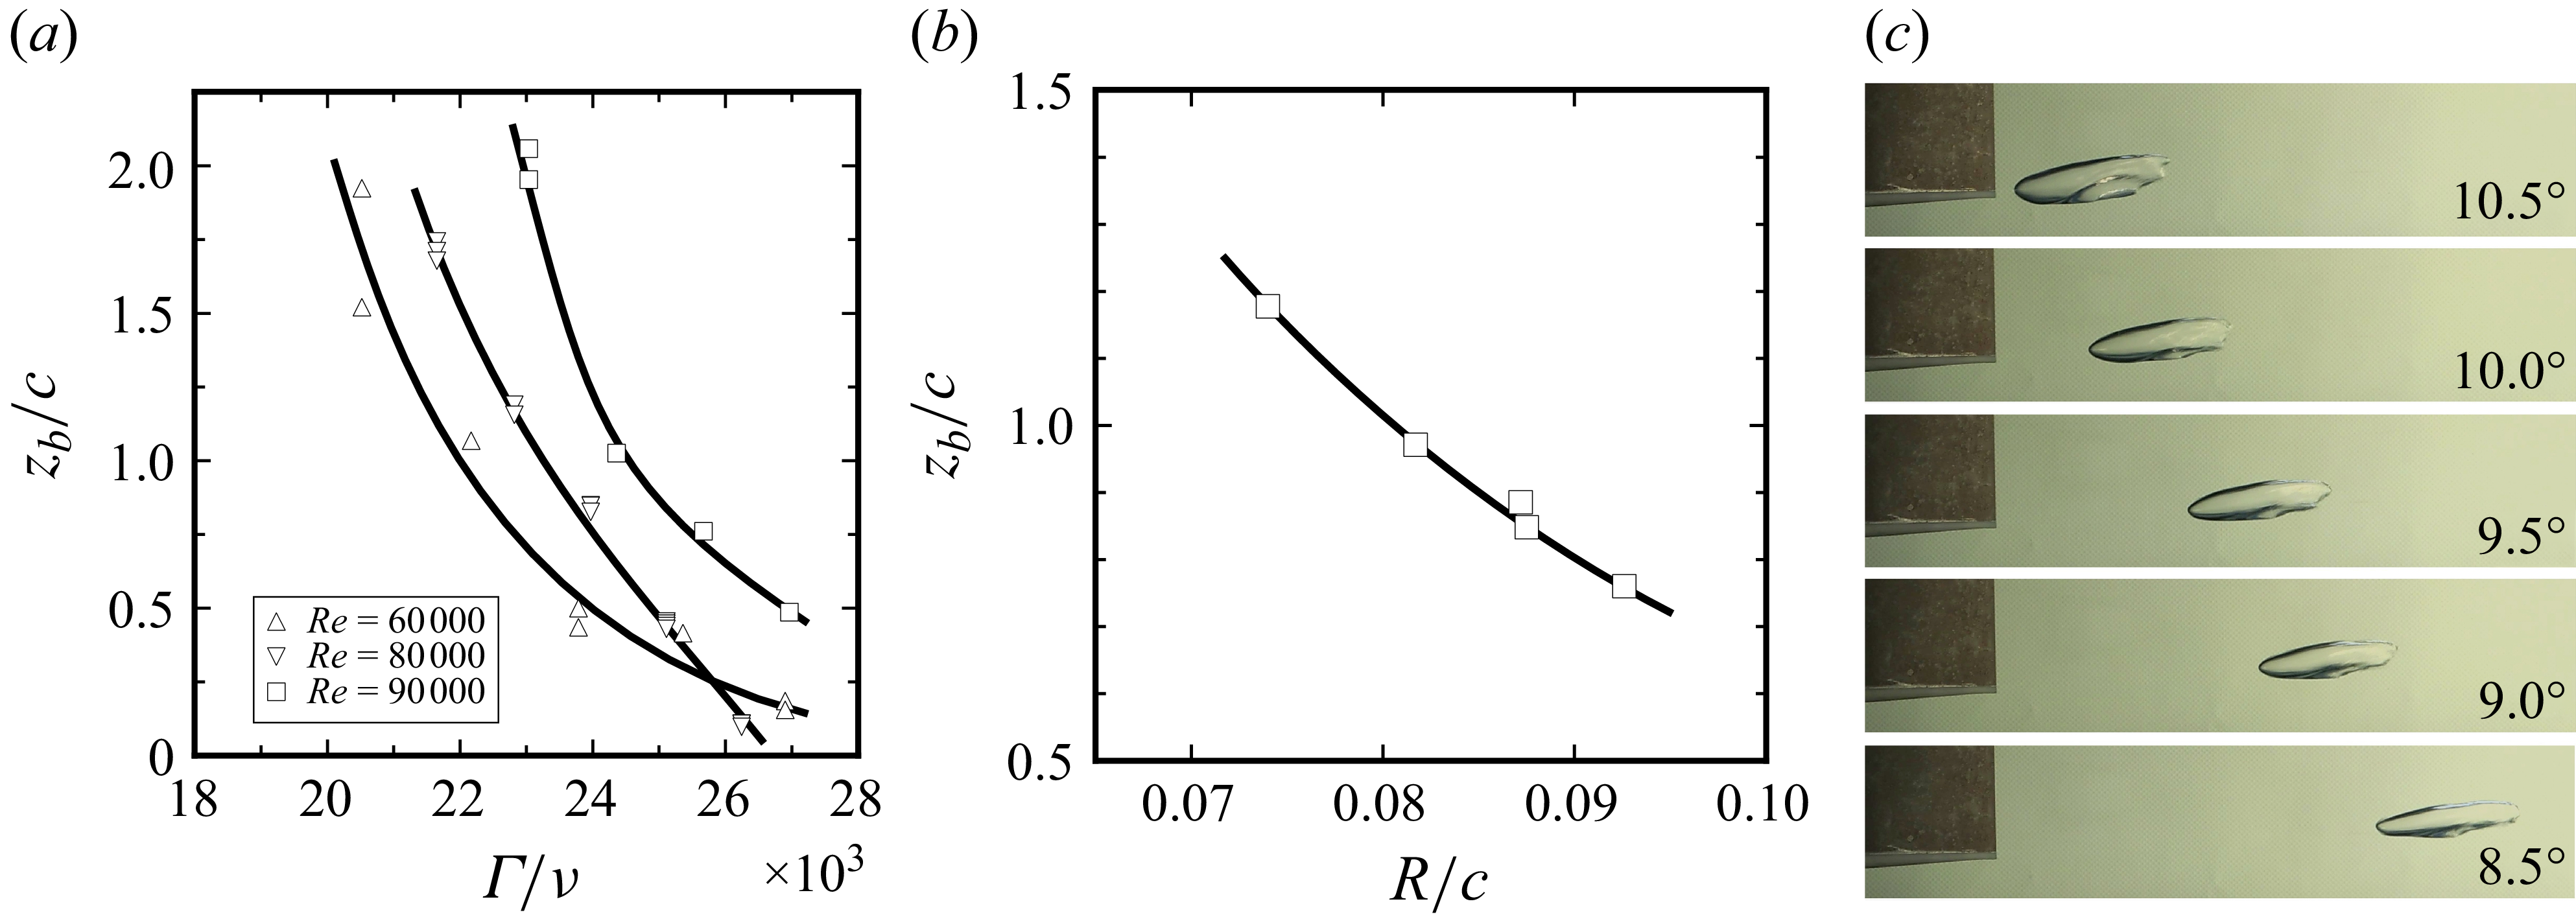
Equilibrium bubble positions for the SD 7003 wing in the stable regime. ( $a$
) Variation with the vortex Reynolds number for maximum-size bubbles; (
$a$
) Variation with the vortex Reynolds number for maximum-size bubbles; ( $b$
) variation with bubble radius for constant flow conditions (
$b$
) variation with bubble radius for constant flow conditions ( $\alpha =9^\circ$
,
$\alpha =9^\circ$
, $ \textit{Re}=90\,000$
); (
$ \textit{Re}=90\,000$
); ( $c$
) variation with angle of attack for the same bubble at
$c$
) variation with angle of attack for the same bubble at $ \textit{Re}=80\,000$
.
$ \textit{Re}=80\,000$
.

The equilibrium position $z_b$
of the bubble in the stable regime depends on
$z_b$
of the bubble in the stable regime depends on $\alpha$
,
$\alpha$
, $ \textit{Re}$
and the bubble size. As shown in figure 10(
$ \textit{Re}$
and the bubble size. As shown in figure 10( $a$
),
$a$
), $z_b$
correlates strongly with vortex circulation at fixed
$z_b$
correlates strongly with vortex circulation at fixed $ \textit{Re}$
, with larger
$ \textit{Re}$
, with larger $\varGamma$
bringing the bubble closer to the wing. At
$\varGamma$
bringing the bubble closer to the wing. At $ \textit{Re}=80\,000$
,
$ \textit{Re}=80\,000$
, $z_b$
varies approximately linearly with
$z_b$
varies approximately linearly with $\varGamma$
, whereas this trend is not observed for other Reynolds numbers, showing a change in the sensitivity of the equilibrium position to circulation. Recordings of the temporal evolution of bubble volume and position for stable cases (not shown) indicate that, as the bubble shrinks due to air leakage, its equilibrium position shifts downstream. This dependence of
$\varGamma$
, whereas this trend is not observed for other Reynolds numbers, showing a change in the sensitivity of the equilibrium position to circulation. Recordings of the temporal evolution of bubble volume and position for stable cases (not shown) indicate that, as the bubble shrinks due to air leakage, its equilibrium position shifts downstream. This dependence of $z_b$
on bubble size is further illustrated in figure 10(
$z_b$
on bubble size is further illustrated in figure 10( $b$
), which shows the equilibrium position of bubbles of different sizes under the same flow conditions. The fitted line corresponds to the relation
$b$
), which shows the equilibrium position of bubbles of different sizes under the same flow conditions. The fitted line corresponds to the relation $z_b \propto R^{-2}$
.
$z_b \propto R^{-2}$
.
The image sequence in figure 10( $c$
) was obtained for a single bubble at
$c$
) was obtained for a single bubble at $ \textit{Re}=80\,000$
, decreasing
$ \textit{Re}=80\,000$
, decreasing $\alpha$
from
$\alpha$
from $10.5^\circ$
to
$10.5^\circ$
to $8.5^\circ$
in steps of
$8.5^\circ$
in steps of $0.5^\circ$
. As
$0.5^\circ$
. As $\alpha$
was reduced, the bubble lost air and its estimated volume dropped by nearly
$\alpha$
was reduced, the bubble lost air and its estimated volume dropped by nearly $50\%$
over this sequence, while its radius remained at the maximum value for each
$50\%$
over this sequence, while its radius remained at the maximum value for each $\alpha$
. This indicates that lowering
$\alpha$
. This indicates that lowering $\alpha$
reduces the maximum admissible bubble volume. Since the vortex circulation also decreases with
$\alpha$
reduces the maximum admissible bubble volume. Since the vortex circulation also decreases with $\alpha$
, the downstream shift of the bubble position in figure 10(
$\alpha$
, the downstream shift of the bubble position in figure 10( $c$
) is consistent with the result in figure 10(
$c$
) is consistent with the result in figure 10( $a$
).
$a$
).
6. Discussion
6.1. Similarities and differences with single-phase vortex breakdown
The flow structure presented in the preceding sections bears obvious similarities with the classical bubble-type vortex breakdown phenomenon observed in swirling pipe flow, lid-driven cavity flow and flow over a delta wing at high angles of attack. These flows are characterised by the presence of a stagnation point on the axis of the vortex, which initially contains an axial velocity component, and an approximately axisymmetric recirculation zone, which in the present case is replaced by a gas bubble. The significant increase of the vortex core size downstream of the bubble is also similar to what is found for single-phase breakdown.
In all examples of vortex breakdown in the literature, an external adverse axial pressure gradient exists, linked to the boundary conditions of the flow, which slows down the axial core motion to generate the stagnation point. In the present wing-tip vortex, a weak axial pressure gradient also exists, due to the (slow) viscous core growth in the streamwise direction, but it is not sufficient to halt the axial core flow in the vicinity of the wing. This is here achieved by the temporary upstream injection of air, with the surprising feature that this air remains trapped in place, even after the injection is stopped.
It should be noted that bubbles could in most cases only be created by injecting air against the free stream, at some distance from the trailing edge of the wing. Injecting in the streamwise direction, or close to the wing surface, simply results in a stream of smaller bubbles, whose size is determined by capillarity and the diameter of the cannula, and which are convected downstream in the vortex core without causing a breakdown. Injecting water into the flow in the same way as done with air also did not produce a persistent breakdown structure. We even tried to replace the air bubble by a low-density (polystyrene) solid of the same shape, but the high drag of this body from the no-slip condition on its surface always carried it downstream immediately.
6.2. Maximum bubble radius
The maximum bubble radius for given flow conditions can be estimated through a pressure equilibrium analysis. Considering the (axisymmetric) flow in a cross-sectional plane, the dominant velocity component is the azimuthal velocity $u_\theta (r)$
. Neglecting viscous terms and fluid acceleration in the radial direction, the radial momentum balance reduces to
$u_\theta (r)$
. Neglecting viscous terms and fluid acceleration in the radial direction, the radial momentum balance reduces to
 \begin{align} \frac {1}{\rho }\,\frac {\partial p}{\partial r} = \frac {u_\theta ^2(r)}{r} - g \sin \theta , \end{align}
where $\rho$
is the density of the water. This means that the pressure field is produced by the superposition of an axisymmetric swirl-induced contribution and a hydrostatic variation. One may picture this field as a ‘tilted plane’ (from hydrostatics) with a low-pressure ‘well’ near the vortex centre. Gas in the liquid is advected towards regions of low pressure, and it can only accumulate where the isobars form closed loops. Assuming the air pressure inside the bubble as constant, the interface then coincides with an isobar of the external fluid flow. The maximum bubble size is therefore related to the outermost closed isobar surrounding the vortex core. The transition between closed and open pressure contours occurs here when the total radial pressure gradient vanishes. The inset of figure 9(
$\rho$
is the density of the water. This means that the pressure field is produced by the superposition of an axisymmetric swirl-induced contribution and a hydrostatic variation. One may picture this field as a ‘tilted plane’ (from hydrostatics) with a low-pressure ‘well’ near the vortex centre. Gas in the liquid is advected towards regions of low pressure, and it can only accumulate where the isobars form closed loops. Assuming the air pressure inside the bubble as constant, the interface then coincides with an isobar of the external fluid flow. The maximum bubble size is therefore related to the outermost closed isobar surrounding the vortex core. The transition between closed and open pressure contours occurs here when the total radial pressure gradient vanishes. The inset of figure 9( $a$
) shows that this happens above the vortex. The distance
$a$
) shows that this happens above the vortex. The distance $y_1$
between the vortex centre and the pressure saddle point is found from (6.1) with
$y_1$
between the vortex centre and the pressure saddle point is found from (6.1) with $\partial p/\partial r=0$
and
$\partial p/\partial r=0$
and $\theta = 90^\circ$
 \begin{align} \frac {u_\theta ^2(y_1)}{y_1} = g. \end{align}
To obtain a prediction that can be compared with the experimental data, we further idealise the external flow as the one related to a potential vortex, for which $u_\theta (r) = \varGamma /(2\pi r)$
. Substituting this into (6.2) yields
$u_\theta (r) = \varGamma /(2\pi r)$
. Substituting this into (6.2) yields $y_1 = [\varGamma ^2/(4\pi ^2g)]^{1/3}$
. Below the vortex, the outermost closed isobar is located at a distance
$y_1 = [\varGamma ^2/(4\pi ^2g)]^{1/3}$
. Below the vortex, the outermost closed isobar is located at a distance $y_2=y_1/2$
from the centre for this particular vortex. When the contour is viewed from the side, as in the experiments, its height, corresponding to twice the reported bubble radius, is
$y_2=y_1/2$
from the centre for this particular vortex. When the contour is viewed from the side, as in the experiments, its height, corresponding to twice the reported bubble radius, is $y_1+y_2$
. This leads to the following prediction for the maximum bubble radius:
$y_1+y_2$
. This leads to the following prediction for the maximum bubble radius:
 \begin{align} R_m = \frac {3}{4}\left (\frac {\varGamma ^2}{4\pi ^2 g}\right )^{1/3}, \end{align}
which is plotted as a grey line in figure 9( $a$
). Despite its various simplifications, the model provides the correct order of magnitude of the maximum bubble size and captures the trend of its dependence on the vortex Reynolds number and gravity. Considering more general velocity profiles of the form
$a$
). Despite its various simplifications, the model provides the correct order of magnitude of the maximum bubble size and captures the trend of its dependence on the vortex Reynolds number and gravity. Considering more general velocity profiles of the form $u_\theta \propto r^{-n}$
(in the present experiments, we find
$u_\theta \propto r^{-n}$
(in the present experiments, we find $n =0.75$
–0.85, see figure 6) does not significantly reduce the difference in the slope of the curve. More accurate predictions could possibly be obtained by considering the three-dimensional bubble shape, the turbulence surrounding the bubble or capillary effects, which are not completely negligible in our configuration.
$n =0.75$
–0.85, see figure 6) does not significantly reduce the difference in the slope of the curve. More accurate predictions could possibly be obtained by considering the three-dimensional bubble shape, the turbulence surrounding the bubble or capillary effects, which are not completely negligible in our configuration.
7. Conclusion
We have presented observations and measurements concerning a new type of two-phase vortex breakdown, which can be triggered by temporary air injection into a wing-tip vortex in water. Various regimes for the injected air bubble were identified, as function of the wing’s angle of attack and Reynolds number, including configurations where the bubble remains stationary for several minutes inside the vortex core at some distance downstream of the wing. Vortex and bubble characteristics were determined from visualisations and velocity measurements, and the most significant correlations were presented. Although some qualitative arguments (and one quantitative estimate) for the observed behaviours were given, the present results are so far mostly empirical. We emphasise that the characteristics of the bubble regimes and properties were correlated with the flow parameters determined without a bubble. It is conceivable that the presence of the bubble could notably modify the vortex properties, even upstream, in particular the axial velocity excess. A more complete survey of the flow field around the bubble is needed to understand in more detail the observed features of the two-phase vortex breakdown.
Supplementary movies
Supplementary movies are available at https://doi.org/10.1017/jfm.2026.11657.
Funding
This research was funded by the French Agence Nationale de la Recherche (ANR), grant ANR-24-CE51-1797 (project VFIN). P.S. received additional financial support from an Erasmus–Fundación Unicaja mobility grant. Funding for open access was provided by the University of Malaga / CBUA.
Declaration of interests
The authors report no conflict of interest.


















 Open access

