

1. Introduction
The study of the resonance mechanism in water waves is of fundamental importance, as the nonlinear interactions between different wave components may result in energy transfers in the spectrum. When the frequency of a tertiary component equals the frequency of a free infinitesimal wave of the same wavenumber, Phillips (Reference Phillips1960) found that the amplitude of the tertiary component grows linearly with time. After the pioneering work of Phillips (Reference Phillips1960), resonant interaction theory became one of the principle catalysts for the rapid expansion in the understanding of nonlinear wave phenomena (Hammack & Henderson Reference Hammack and Henderson1993). For example, the source function of the nonlinear transfer in a random ocean wavefield derived by Hasselmann (Reference Hasselmann1962) is one of the milestones of modern modelling of ocean waves (Komen et al. Reference Komen, Cavaleri, Donelan, Hasselmann, Hasselmann and Janssen1996). Benney (Reference Benney1962) established the evolution equations of wave mode amplitudes, and demonstrated the well-known time-dependent periodic exchange of wave energy when the Phillips resonance criterion is fully or nearly satisfied.
Another aspect of fundamental importance is the study of progressive waves with persistent two-dimensional surface patterns, as it provides a more realistic description of the ocean waves compared with the study of Stokes waves. Short-crested waves, as probably the simplest waves of permanent form that are two-dimensional, have received growing interest in experimental (Hammack, Scheffner & Segur Reference Hammack, Scheffner and Segur1989; Hammack et al. Reference Hammack, Mccallister, Scheffner and Segur1995; Kimmoun, Branger & Kharif Reference Kimmoun, Branger and Kharif1999; Hammack, Henderson & Segur Reference Hammack, Henderson and Segur2005; Henderson, Patterson & Segur Reference Henderson, Patterson and Segur2006; Henderson, Segur & Carter Reference Henderson, Segur and Carter2010), analytical (Roberts Reference Roberts1983; Bryant Reference Bryant1985; Madsen & Fuhrman Reference Madsen and Fuhrman2006, Reference Madsen and Fuhrman2012) and numerical (Chen & Liu Reference Chen and Liu1995; Craig & Nicholls Reference Craig and Nicholls2002; Fuhrman & Madsen Reference Fuhrman and Madsen2006; Fuhrman, Madsen & Bingham Reference Fuhrman, Madsen and Bingham2006; Nicholls & Reitich Reference Nicholls and Reitich2006; Xu & Guyenne Reference Xu and Guyenne2009) investigations in recent years.
The main feature of short-crested waves is, however, the occurrence of harmonic resonance. For certain combinations of frequencies and wavenumber vectors, the perturbation theory may break down due to the singularities in the transfer functions (Madsen & Fuhrman Reference Madsen and Fuhrman2012). Harmonic resonance in short-crested waves was first identified by Roberts (Reference Roberts1983). Ioualalen et al. (Reference Ioualalen, Okamura, Cornier, Kharif and Roberts2006) found that the harmonic resonance introduces non-uniqueness with several steady solution branches connected through a turning point. Also, the non-uniqueness of Zakharov’s kernels
 $\boldsymbol{T}(\boldsymbol{k}_{\boldsymbol{a}},\boldsymbol{k}_{\boldsymbol{b}},\boldsymbol{k}_{\boldsymbol{a}},\boldsymbol{k}_{\boldsymbol{b}})$
for gravity waves in water of finite depth was resolved by Stiassnie & Gramstad (Reference Stiassnie and Gramstad2009).
$\boldsymbol{T}(\boldsymbol{k}_{\boldsymbol{a}},\boldsymbol{k}_{\boldsymbol{b}},\boldsymbol{k}_{\boldsymbol{a}},\boldsymbol{k}_{\boldsymbol{b}})$
for gravity waves in water of finite depth was resolved by Stiassnie & Gramstad (Reference Stiassnie and Gramstad2009).
To overcome the restrictions and limitations of perturbation techniques, Liao (Reference Liao1992, Reference Liao1997, Reference Liao2004, Reference Liao2012) developed an analytic approximation approach for highly nonlinear problems, namely the homotopy analysis method (hereinafter, HAM). Unlike perturbation techniques, the use of the HAM does not involve the existence of small/large physical parameters. In particular, different from other methods, the HAM provides a simple way to guarantee the convergence of solution series by means of introducing the so-called ‘convergence-control parameter’, which has no physical meaning so that its optimal value can be determined by the minimum of the residual error of governing equations. Besides, the HAM provides great freedom to choose the equation type of related linear equations for high-order approximations. With these advantages, the HAM has been successfully applied to solve many nonlinear problems (Liao & Tan Reference Liao and Tan2007; Liao Reference Liao2012).
Recently, by introducing the resonant components into the initial guess in the framework of the HAM, Liao (Reference Liao2011) successfully obtained the ‘steady-state’ resonant waves in deep water with multiple solutions. The so-called ‘steady-state’ resonant waves correspond to a state such that, when the resonance criterion is exactly satisfied, all of the amplitudes
 $a_{i}$
, the wavenumbers
$a_{i}$
, the wavenumbers
 $\boldsymbol{k}_{i}$
and the nonlinear frequency
$\boldsymbol{k}_{i}$
and the nonlinear frequency
 ${\it\sigma}_{i}$
of the wave system are constant, i.e. independent of time, so that the spectrum of wave energy is also independent of time. Liao (Reference Liao2011) found that multiple steady-state resonance waves exist for a special quartet in deep water and Xu et al. (Reference Xu, Lin, Liao and Stiassnie2012) confirmed their existence in water of finite depth. Liu & Liao (Reference Liu and Liao2014) further extended the existing results for steady-state resonance from a special quartet to more general and coupled quartets, together with consideration of higher-order resonant interactions. The significant role of the near resonance was revealed. It was found that all near-resonant components as a whole contain more and more wave energy, as the wave patterns tend from two-dimensional to one-dimensional, or as the amplitudes of the steady-state resonant wave system increase, as pointed out by Liu & Liao (Reference Liu and Liao2014).
${\it\sigma}_{i}$
of the wave system are constant, i.e. independent of time, so that the spectrum of wave energy is also independent of time. Liao (Reference Liao2011) found that multiple steady-state resonance waves exist for a special quartet in deep water and Xu et al. (Reference Xu, Lin, Liao and Stiassnie2012) confirmed their existence in water of finite depth. Liu & Liao (Reference Liu and Liao2014) further extended the existing results for steady-state resonance from a special quartet to more general and coupled quartets, together with consideration of higher-order resonant interactions. The significant role of the near resonance was revealed. It was found that all near-resonant components as a whole contain more and more wave energy, as the wave patterns tend from two-dimensional to one-dimensional, or as the amplitudes of the steady-state resonant wave system increase, as pointed out by Liu & Liao (Reference Liu and Liao2014).
Note that these steady-state resonant waves (Liao Reference Liao2011; Xu et al. Reference Xu, Lin, Liao and Stiassnie2012; Liu & Liao Reference Liu and Liao2014) are obtained in the framework of an inviscid fluid. However, water in practice has viscosity. Do the so-called steady-state resonant waves indeed exist in practice? Recalling that no direct experimental evidence of the existence of these steady-state waves has ever been reported and that the early skepticism of Phillips’ view was dispelled unequivocally by experiments presented in Longuet-Higgins & Smith (Reference Longuet-Higgins and Smith1966), McGoldrick et al. (Reference McGoldrick, Phillips, Huang and Hodgson1966) and Hammack & Henderson (Reference Hammack and Henderson1993), an experiment is urgently needed to verify the theories on steady-state resonance.
The primary objective of this work is to experimentally confirm the existence of the multiple steady-state resonance waves in deep water. These steady-state resonant waves are first calculated theoretically under the exact resonance criterion with high enough nonlinearity. Then for each case several co-propagating short-crested wave trains that contain at least 95 % of the wave energy are generated in a basin. The wavefields are measured and analysed both along and normal to the direction of propagation. The steady-state wave spectra are quantitatively observed within the inherent system error of the basin and identified by means of a contrasting experiment.
This paper is outlined as follows. The theoretical results are briefly introduced in § 2 for steady-state resonant waves formed by several short-crested waves. Experimental facilities and procedures to generate composite waves are described in § 3. Variances of amplitudes are then introduced to quantify the amplitude uniformity in space. Detailed experimental results are presented in § 4, together with the comparisons of experimental and theoretical results. Finally, conclusions are summarized in § 5.
2. Summary of theoretical framework
The theory of steady-state resonant waves is based on the classic initial/boundary-value problem for water waves in an inviscid fluid. Under the assumption of incompressible fluid and neglect of surface tension, the governing equation for the velocity potential
 ${\it\phi}(X,Y,z,t)$
and the free-surface displacement
${\it\phi}(X,Y,z,t)$
and the free-surface displacement
 ${\it\eta}(X,Y,t)$
in water of infinite depth requires
${\it\eta}(X,Y,t)$
in water of infinite depth requires
 $$\begin{eqnarray}\displaystyle & {\rm\nabla}^{2}{\it\phi}=0\quad \text{in }-\infty <z<{\it\eta}(X,Y,t),~-\infty <X,Y<\infty , & \displaystyle\end{eqnarray}$$
 $$\begin{eqnarray}\displaystyle & \displaystyle \frac{\partial ^{2}{\it\phi}}{\partial t^{2}}+g\frac{\partial {\it\phi}}{\partial z}+\frac{\partial \left|\boldsymbol{{\rm\nabla}}{\it\phi}\right|^{2}}{\partial t}+\boldsymbol{{\rm\nabla}}{\it\phi}\boldsymbol{\cdot }\boldsymbol{{\rm\nabla}}\left(\frac{1}{2}\left|\boldsymbol{{\rm\nabla}}{\it\phi}\right|^{2}\right)=0\quad \text{on}~z={\it\eta}(X,Y,t), & \displaystyle\end{eqnarray}$$
 $$\begin{eqnarray}\displaystyle & \displaystyle g{\it\eta}+\frac{\partial {\it\phi}}{\partial t}+\frac{1}{2}\left|\boldsymbol{{\rm\nabla}}{\it\phi}\right|^{2}=0\quad \text{on}~z={\it\eta}(X,Y,t), & \displaystyle\end{eqnarray}$$
 $$\begin{eqnarray}\displaystyle & \displaystyle \frac{\partial {\it\phi}}{\partial z}=0\quad \text{as}~z\rightarrow -\infty , & \displaystyle\end{eqnarray}$$
 $g$
is the acceleration due to gravity,
$g$
is the acceleration due to gravity,
 $t$
is the time, and
$t$
is the time, and
 $(X,Y,z)$
denotes the spatial coordinate with the
$(X,Y,z)$
denotes the spatial coordinate with the
 $z$
axis upward and the
$z$
axis upward and the
 $X,Y$
axes horizontal.
$X,Y$
axes horizontal.
Taking steady-state resonant waves composite of two trains of short-crested waves as an example, Phillips’ linear resonance condition requires
 $$\begin{eqnarray}\boldsymbol{k}_{1}+\boldsymbol{k}_{3}=\boldsymbol{k}_{2}+\boldsymbol{k}_{4},\quad {\it\omega}_{1}+{\it\omega}_{2}={\it\omega}_{3}+{\it\omega}_{4},\end{eqnarray}$$
where
 $\boldsymbol{k}_{i}$
is the wavenumber and
$\boldsymbol{k}_{i}$
is the wavenumber and
 ${\it\omega}_{i}=\sqrt{g|\boldsymbol{k }_{i}|}$
is the linear frequency. The nonlinear frequency
${\it\omega}_{i}=\sqrt{g|\boldsymbol{k }_{i}|}$
is the linear frequency. The nonlinear frequency
 ${\it\sigma}_{i}$
, which depends on the wavenumber
${\it\sigma}_{i}$
, which depends on the wavenumber
 $k_{i}$
and amplitude
$k_{i}$
and amplitude
 $a_{i}$
of all components in the wavefield, satisfies the nonlinear resonance condition
$a_{i}$
of all components in the wavefield, satisfies the nonlinear resonance condition
 $$\begin{eqnarray}\boldsymbol{k}_{1}+\boldsymbol{k}_{3}=\boldsymbol{k}_{2}+\boldsymbol{k}_{4},\quad {\it\sigma}_{1}+{\it\sigma}_{3}={\it\sigma}_{3}+{\it\sigma}_{4}.\end{eqnarray}$$
Figure 1 shows the wavevector configuration, which requires
 $$\begin{eqnarray}k_{1,X}=k_{2,X},\quad k_{3,X}=k_{4,X},\quad k_{1,Y}=-k_{2,Y}=-k_{3,Y}=k_{4,Y}(=:k_{Y}).\end{eqnarray}$$
Here it is assumed that
 $k_{1,X}<k_{3,X}$
and
$k_{1,X}<k_{3,X}$
and
 $k_{Y}>0$
. Due to the symmetry in wavevectors, Phillips’ linear resonance condition (2.5) is automatically satisfied and the composite wave pattern has a wavelength of
$k_{Y}>0$
. Due to the symmetry in wavevectors, Phillips’ linear resonance condition (2.5) is automatically satisfied and the composite wave pattern has a wavelength of
 ${\rm\pi}/k_{q}$
in the
${\rm\pi}/k_{q}$
in the
 $Y$
direction. For simplicity, it is further assumed that
$Y$
direction. For simplicity, it is further assumed that
 ${\it\sigma}_{1}/{\it\omega}_{1}\equiv {\it\sigma}_{2}/{\it\omega}_{2}={\it\varepsilon}_{1}$
and
${\it\sigma}_{1}/{\it\omega}_{1}\equiv {\it\sigma}_{2}/{\it\omega}_{2}={\it\varepsilon}_{1}$
and
 ${\it\sigma}_{3}/{\it\omega}_{3}\equiv {\it\sigma}_{4}/{\it\omega}_{4}={\it\varepsilon}_{3}$
such that the nonlinear resonance condition (2.6) is automatically satisfied, too. For components travelling in the same direction, as considered in this experiment, the nonlinear frequency
${\it\sigma}_{3}/{\it\omega}_{3}\equiv {\it\sigma}_{4}/{\it\omega}_{4}={\it\varepsilon}_{3}$
such that the nonlinear resonance condition (2.6) is automatically satisfied, too. For components travelling in the same direction, as considered in this experiment, the nonlinear frequency
 ${\it\sigma}_{i}$
is bigger than the related linear frequency
${\it\sigma}_{i}$
is bigger than the related linear frequency
 ${\it\omega}_{i}$
due to contributions of generalized Stokes’ corrections (that is
${\it\omega}_{i}$
due to contributions of generalized Stokes’ corrections (that is
 ${\it\varepsilon}_{i}>1$
, as shown later in table 2).
${\it\varepsilon}_{i}>1$
, as shown later in table 2).
Wavevector configuration of steady-state resonance waves formed by short-crested waves. Here only two trains of short-crested waves are shown for simplicity.

The above fully nonlinear governing equations (2.1)–(2.4) together with the resonance criteria (2.5) and (2.6) are solved by the HAM. Briefly, the solution expressions for the free-surface elevation and velocity potential are
 $$\begin{eqnarray}\displaystyle & \displaystyle {\it\eta}=\mathop{\sum }_{m_{1}=0}^{+\infty }\mathop{\sum }_{m_{2}=-\infty }^{+\infty }\mathop{\sum }_{m_{3}=-\infty }^{+\infty }C_{m_{1},m_{2},m_{3}}^{{\it\eta}}\cos (m_{1}{\it\xi}_{1}+m_{2}{\it\xi}_{2}+m_{3}{\it\xi}_{3}), & \displaystyle\end{eqnarray}$$
 $$\begin{eqnarray}\displaystyle & \displaystyle {\it\phi}=\mathop{\sum }_{m_{1}=0}^{+\infty }\mathop{\sum }_{m_{2}=-\infty }^{+\infty }\mathop{\sum }_{m_{3}=-\infty }^{+\infty }C_{m_{1},m_{2},m_{3}}^{{\it\phi}}\sin \left(\mathop{\sum }_{i=1}^{3}m_{i}{\it\xi}_{i}\right)\exp \left(\left|\mathop{\sum }_{i=1}^{3}m_{i}\boldsymbol{k}_{i}\right|z\right)\!, & \displaystyle\end{eqnarray}$$
 $C_{m_{1},m_{2},\dots ,m_{{\it\kappa}}}^{{\it\eta}}$
and
$C_{m_{1},m_{2},\dots ,m_{{\it\kappa}}}^{{\it\eta}}$
and
 $C_{m_{1},m_{2},\dots ,m_{{\it\kappa}}}^{{\it\phi}}$
are constants to be determined, and
$C_{m_{1},m_{2},\dots ,m_{{\it\kappa}}}^{{\it\phi}}$
are constants to be determined, and
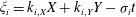 ${\it\xi}_{i}=k_{i,X}X+k_{i,Y}Y-{\it\sigma}_{i}t$
for the progressive wave component. In the framework of the HAM, the initial guesses for the free-surface elevation and velocity potential are
${\it\xi}_{i}=k_{i,X}X+k_{i,Y}Y-{\it\sigma}_{i}t$
for the progressive wave component. In the framework of the HAM, the initial guesses for the free-surface elevation and velocity potential are  $$\begin{eqnarray}{\it\eta}_{0}=0,\end{eqnarray}$$
 $$\begin{eqnarray}\displaystyle {\it\phi}_{0} & = & \displaystyle A_{0,1}\sin ({\it\xi}_{1})\exp (|\boldsymbol{k}_{1}|z)+A_{0,2}\sin ({\it\xi}_{2})\exp (|\boldsymbol{k}_{2}|z)\nonumber\\ \displaystyle & & \displaystyle +\,A_{0,3}\sin ({\it\xi}_{3})\exp (|\boldsymbol{k}_{3}|z)+A_{0,4}\sin ({\it\xi}_{1}+{\it\xi}_{2}-{\it\xi}_{3})\exp (|\boldsymbol{k}_{1}+\boldsymbol{k}_{2}-\boldsymbol{k}_{3}|z),\quad\end{eqnarray}$$
where the unknown constant coefficients
 $A_{0,i}$
is determined in such a way that the secular terms on the right-hand side of the first-order deformation equation are avoided. Forty-eight algebraic solutions are obtained for
$A_{0,i}$
is determined in such a way that the secular terms on the right-hand side of the first-order deformation equation are avoided. Forty-eight algebraic solutions are obtained for
 $A_{0,i}$
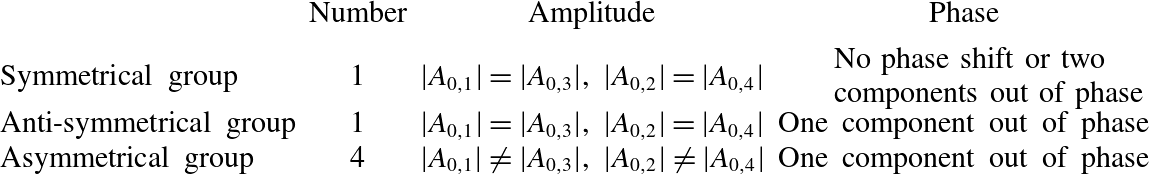
, which are divided into three groups as shown in table 1. The amplitudes in the first two groups are symmetrically distributed within each short-crested waves. Here a negative
$A_{0,i}$
, which are divided into three groups as shown in table 1. The amplitudes in the first two groups are symmetrically distributed within each short-crested waves. Here a negative
 $A_{0,i}$
is regarded as an 180° phase shift of the
$A_{0,i}$
is regarded as an 180° phase shift of the
 $i$
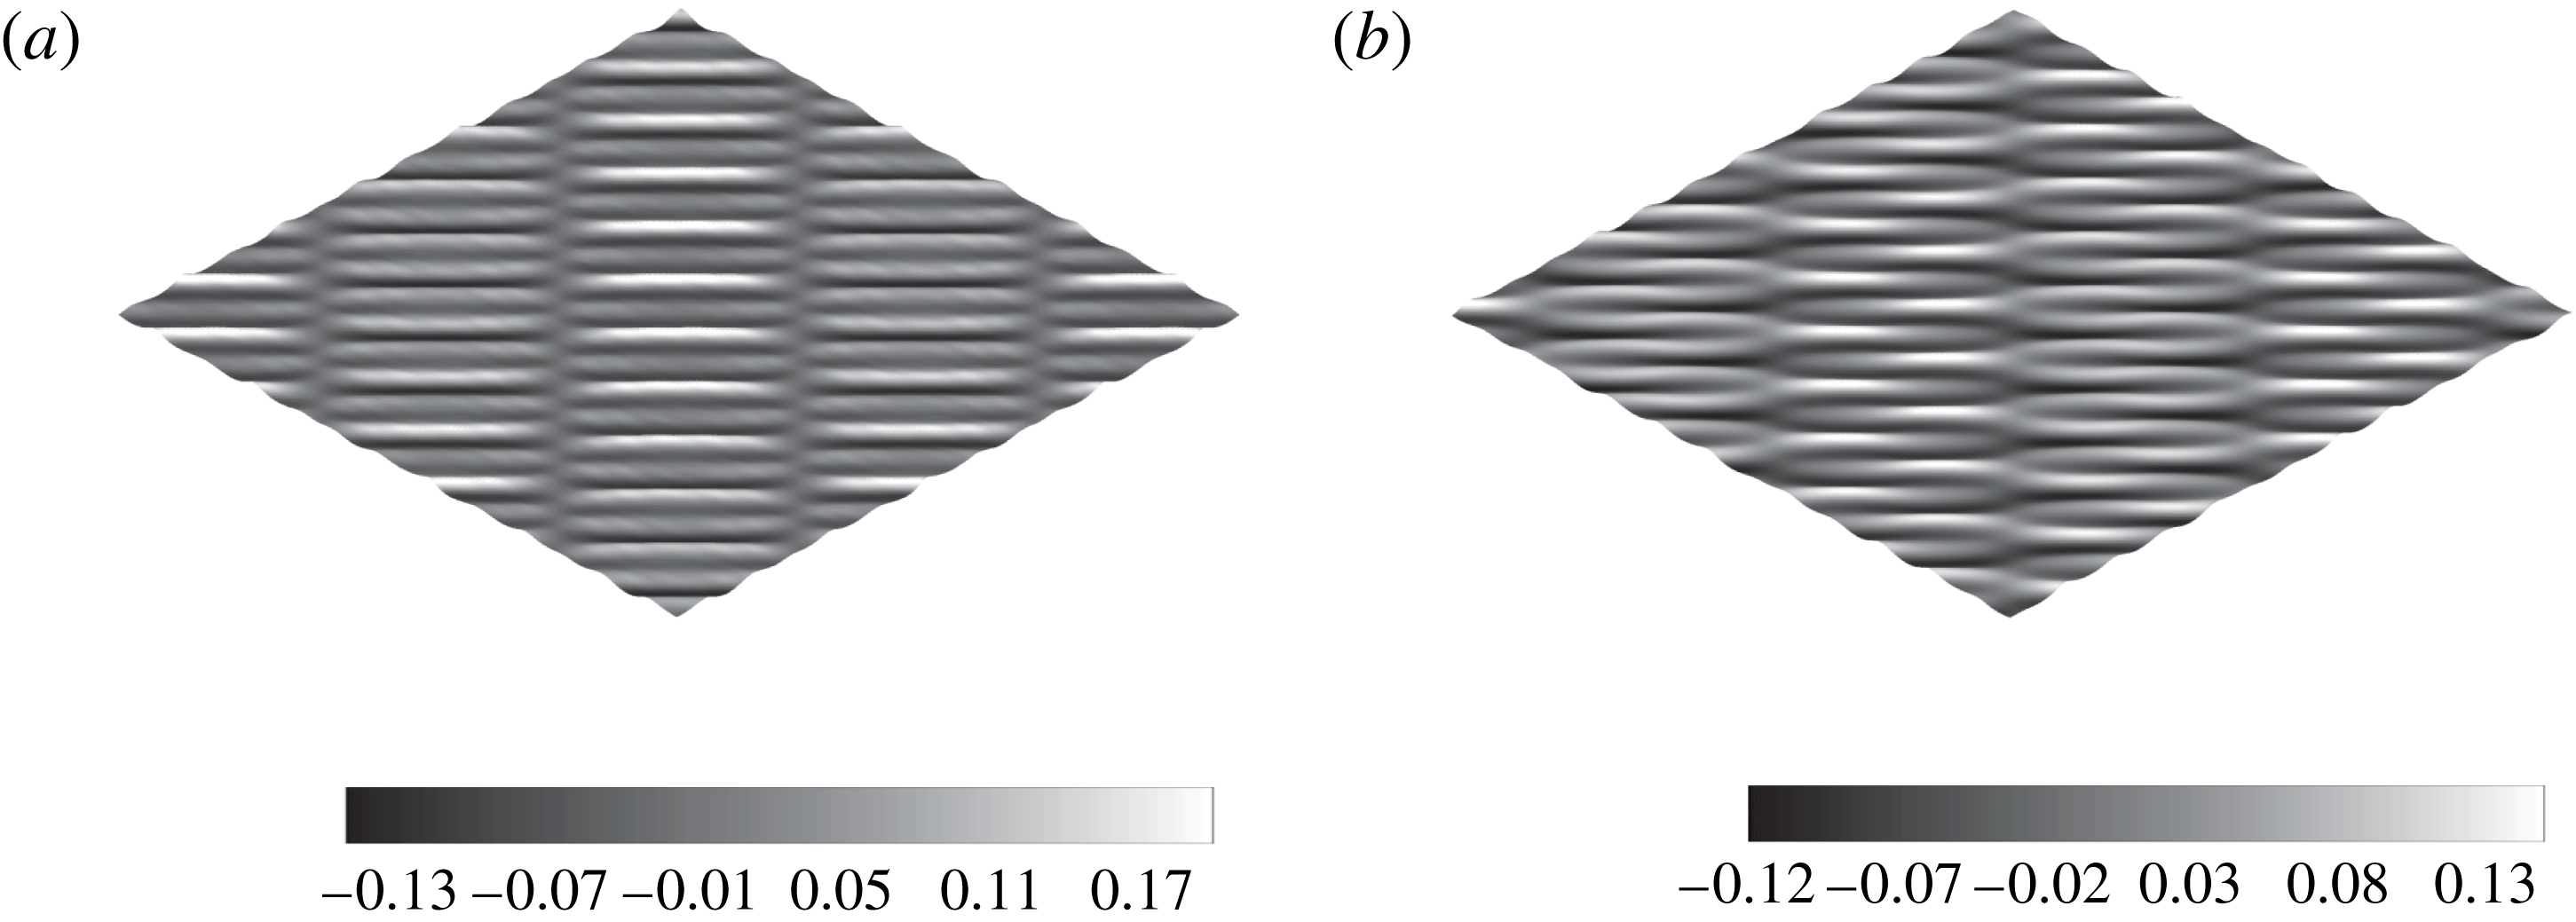
th component. Based on the number of components that have phase shift, the first two groups are further divided into symmetrical and anti-symmetrical groups. This phase shift of components results in different wave patterns, as shown in figure 2. The other 32 solutions, as the amplitudes are non-uniformly distributed within each short-crested wave, belong to the asymmetrical group. Two asymmetrical groups are trivial owing to the symmetry of the wavevector. The sign and magnitude of
$i$
th component. Based on the number of components that have phase shift, the first two groups are further divided into symmetrical and anti-symmetrical groups. This phase shift of components results in different wave patterns, as shown in figure 2. The other 32 solutions, as the amplitudes are non-uniformly distributed within each short-crested wave, belong to the asymmetrical group. Two asymmetrical groups are trivial owing to the symmetry of the wavevector. The sign and magnitude of
 $A_{0,i}$
in the potential function is directly related to that of amplitude
$A_{0,i}$
in the potential function is directly related to that of amplitude
 $a_{i}$
in free-surface elevation. Thus, our analysis is based on
$a_{i}$
in free-surface elevation. Thus, our analysis is based on
 $A_{0,i}$
for the sake of simplicity. For detailed solution procedures, please refer to Liao (Reference Liao2011), Xu et al. (Reference Xu, Lin, Liao and Stiassnie2012) and Liu & Liao (Reference Liu and Liao2014). Based on these theoretical results, it is easy to obtain the corresponding wave spectrum and to find out which wave components contain sufficiently large wave energy and thus must be considered in experiment.
$A_{0,i}$
for the sake of simplicity. For detailed solution procedures, please refer to Liao (Reference Liao2011), Xu et al. (Reference Xu, Lin, Liao and Stiassnie2012) and Liu & Liao (Reference Liu and Liao2014). Based on these theoretical results, it is easy to obtain the corresponding wave spectrum and to find out which wave components contain sufficiently large wave energy and thus must be considered in experiment.
Perspective plot of the free surface of steady-state resonant waves formed by several trains of short-crested waves. The vertical scale is exaggerated two times. (a) Symmetrical group (case S1); (b) anti-symmetrical group (case S3).
Classification of steady-state resonant waves formed by short-crested waves.
As the dimensionless frequencies
 ${\it\varepsilon}_{1}$
and
${\it\varepsilon}_{1}$
and
 ${\it\varepsilon}_{3}$
increase, i.e. the amplitudes of all four related components increase, more components are involved in the resonant interactions (Liu & Liao Reference Liu and Liao2014). The amplitudes of some additional components increase so greatly that they should be included in experiments for the generation of the composite wave groups, as shown in table 2. Compared with the asymmetrical group, the wave energy in the symmetrical and anti-symmetrical groups has a more uniform distribution so that all non-trivial components can be measured by wave gauges. Besides, as shown in figure 2, a symmetrical amplitude distribution leads to specific and easily observed wave patterns. Therefore, we focus on the symmetrical and anti-symmetrical groups of the steady-state resonant waves that are composite of short-crested ones in this paper.
${\it\varepsilon}_{3}$
increase, i.e. the amplitudes of all four related components increase, more components are involved in the resonant interactions (Liu & Liao Reference Liu and Liao2014). The amplitudes of some additional components increase so greatly that they should be included in experiments for the generation of the composite wave groups, as shown in table 2. Compared with the asymmetrical group, the wave energy in the symmetrical and anti-symmetrical groups has a more uniform distribution so that all non-trivial components can be measured by wave gauges. Besides, as shown in figure 2, a symmetrical amplitude distribution leads to specific and easily observed wave patterns. Therefore, we focus on the symmetrical and anti-symmetrical groups of the steady-state resonant waves that are composite of short-crested ones in this paper.
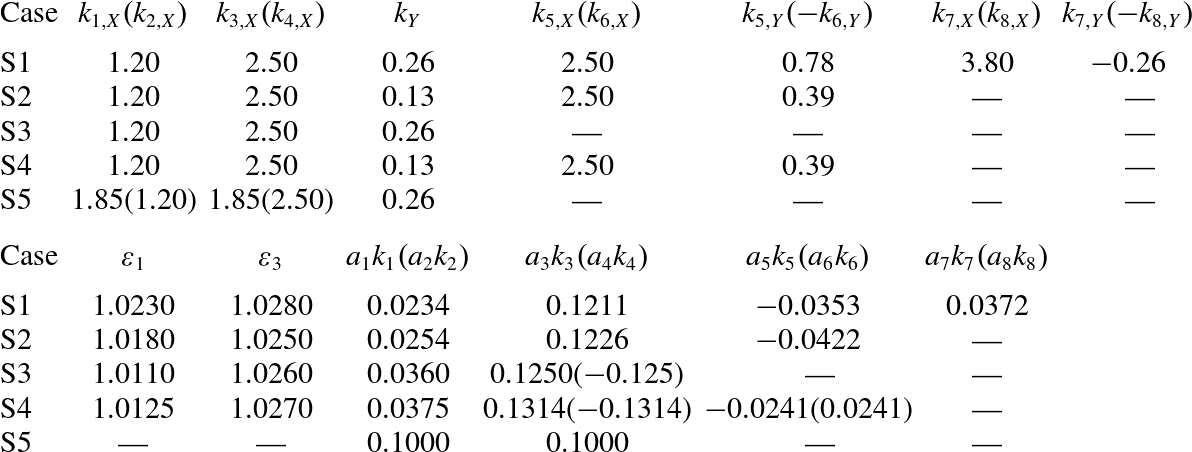
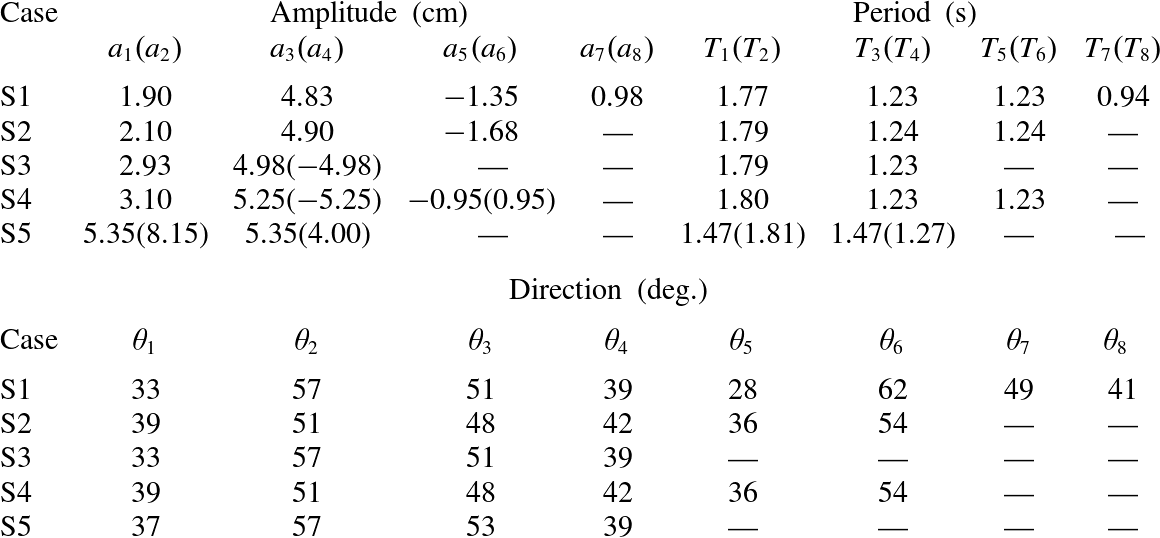
Theoretical parameters in the experimental cases. Here
 $\boldsymbol{k}_{5}=2\boldsymbol{k}_{1}-2\boldsymbol{k}_{2}+\boldsymbol{k}_{3}$
,
$\boldsymbol{k}_{5}=2\boldsymbol{k}_{1}-2\boldsymbol{k}_{2}+\boldsymbol{k}_{3}$
,
 $\boldsymbol{k}_{6}=-\boldsymbol{k}_{1}+\boldsymbol{k}_{2}+\boldsymbol{k}_{3}$
,
$\boldsymbol{k}_{6}=-\boldsymbol{k}_{1}+\boldsymbol{k}_{2}+\boldsymbol{k}_{3}$
,
 $\boldsymbol{k}_{7}=-\boldsymbol{k}_{2}+2\boldsymbol{k}_{3}$
,
$\boldsymbol{k}_{7}=-\boldsymbol{k}_{2}+2\boldsymbol{k}_{3}$
,
 $\boldsymbol{k}_{8}=\boldsymbol{k}_{1}-2\boldsymbol{k}_{2}+2\boldsymbol{k}_{3}$
,
$\boldsymbol{k}_{8}=\boldsymbol{k}_{1}-2\boldsymbol{k}_{2}+2\boldsymbol{k}_{3}$
,
 $k_{Y}=k_{1,Y}=-k_{2,Y}=-k_{3,Y}=k_{4,Y}$
, and a negative
$k_{Y}=k_{1,Y}=-k_{2,Y}=-k_{3,Y}=k_{4,Y}$
, and a negative
 $a_{i}k_{i}$
means a 180° phase shift in that component. Case S5 is an non-steady-state near resonance. Symbol ‘—’ means that the related value is small enough to be neglected.
$a_{i}k_{i}$
means a 180° phase shift in that component. Case S5 is an non-steady-state near resonance. Symbol ‘—’ means that the related value is small enough to be neglected.
Let
 $(x,y,z)$
represent the spatial coordinates in the laboratory frame, as shown in figure 3. The variables in the theoretical framework can be expressed in the laboratory coordinates as follows:
$(x,y,z)$
represent the spatial coordinates in the laboratory frame, as shown in figure 3. The variables in the theoretical framework can be expressed in the laboratory coordinates as follows:
 $$\begin{eqnarray}X=\frac{\sqrt{2}}{2}\left(x+y\right),\quad Y=\frac{\sqrt{2}}{2}\left(-x+y\right).\end{eqnarray}$$
For short-crested waves in deep water, Hammack et al. (Reference Hammack, Henderson and Segur2005) experimentally demonstrated that it looks like a rectangular cell with a
 $Y$
-length scale corresponding to half the
$Y$
-length scale corresponding to half the
 $Y$
-length of each long-crested wave. Due to the symmetry in wavevectors, the final composite wave groups have wavelength
$Y$
-length of each long-crested wave. Due to the symmetry in wavevectors, the final composite wave groups have wavelength
 ${\rm\pi}/k_{Y}$
in the
${\rm\pi}/k_{Y}$
in the
 $Y$
direction. For simplicity, the cases of
$Y$
direction. For simplicity, the cases of
 $k_{Y}=0.26$
and
$k_{Y}=0.26$
and
 $k_{Y}=0.13$
are considered such that the composite wavefield is periodic in the
$k_{Y}=0.13$
are considered such that the composite wavefield is periodic in the
 $Y$
direction every 12 m or 24 m, which covers either half or the whole of the truss (which is 24 m long) of the basin at the State Key Laboratory of Ocean Engineering (SKLOE).
$Y$
direction every 12 m or 24 m, which covers either half or the whole of the truss (which is 24 m long) of the basin at the State Key Laboratory of Ocean Engineering (SKLOE).
Schematic view of the wave basin, showing its two-sided segmented wavemakers (
 $\Box \!\Box$
) and locations of wave gauges and absorbers;
$\Box \!\Box$
) and locations of wave gauges and absorbers;

As pointed out by Liu & Liao (Reference Liu and Liao2014), the primary and resonant wave components contain a smaller percentage of the total wave energy as wave amplitudes increase. So, for resonant waves with large amplitude, not only the primary and resonant components but also some high-order resonant ones should be considered. Table 2 shows the physical parameters of wave components of the five cases considered in our experiments. These parameters are chosen based on the theoretical computations (Liao Reference Liao2011; Xu et al.
Reference Xu, Lin, Liao and Stiassnie2012; Liu & Liao Reference Liu and Liao2014) and are used for the wavemaker to generate the most important wave components, which as a whole contain at least 95 % of the wave energy of the resonant wave system. Case S1 corresponds to a symmetrical group, with
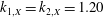 $k_{1,X}=k_{2,X}=1.20$
,
$k_{1,X}=k_{2,X}=1.20$
,
 $k_{3,X}=k_{4,X}=2.50$
and
$k_{3,X}=k_{4,X}=2.50$
and
 $k_{Y}=0.26$
, such that the angle of each component satisfies
$k_{Y}=0.26$
, such that the angle of each component satisfies
 $30^{\circ }\leqslant {\it\theta}_{i}\leqslant 60^{\circ }$
. In case S2, the wavelength in the
$30^{\circ }\leqslant {\it\theta}_{i}\leqslant 60^{\circ }$
. In case S2, the wavelength in the
 $Y$
direction is doubled with
$Y$
direction is doubled with
 $k_{Y}=0.13$
. Cases S3 and S4 belong to anti-symmetrical groups of steady-state resonant waves, and have the same wavevectors as those in cases S1 and S2, respectively. In all of these four cases, different combinations of
$k_{Y}=0.13$
. Cases S3 and S4 belong to anti-symmetrical groups of steady-state resonant waves, and have the same wavevectors as those in cases S1 and S2, respectively. In all of these four cases, different combinations of
 ${\it\varepsilon}_{1}$
and
${\it\varepsilon}_{1}$
and
 ${\it\varepsilon}_{3}$
are properly chosen so that
${\it\varepsilon}_{3}$
are properly chosen so that
 $a_{3}k_{3}=a_{4}k_{4}>0.12$
holds, which guarantees that the related dimensionless scaled variable
$a_{3}k_{3}=a_{4}k_{4}>0.12$
holds, which guarantees that the related dimensionless scaled variable
 $X={\it\epsilon}^{2}k_{0}x$
introduced by Shemer, Kit & Jiao (Reference Shemer, Kit and Jiao2002) reaches 1.5 at the ninth wave gauge, corresponding to a high enough nonlinearity of the considered waves, where
$X={\it\epsilon}^{2}k_{0}x$
introduced by Shemer, Kit & Jiao (Reference Shemer, Kit and Jiao2002) reaches 1.5 at the ninth wave gauge, corresponding to a high enough nonlinearity of the considered waves, where
 $k_{0}$
denotes the wavenumber of the component with the largest amplitude. For each case, the number of wave components generated by the wavemaker is determined in such a way that they in total contain more than 95 % of the wave energy, and also only wave components satisfying
$k_{0}$
denotes the wavenumber of the component with the largest amplitude. For each case, the number of wave components generated by the wavemaker is determined in such a way that they in total contain more than 95 % of the wave energy, and also only wave components satisfying
 $a_{i}k_{i}>0.02$
are considered in the experiments. Note that we had to generate four additional wave components in case S1, and two additional ones in cases S2 and S4, respectively. Case S5 corresponds to a non-steady-state resonant wave, with
$a_{i}k_{i}>0.02$
are considered in the experiments. Note that we had to generate four additional wave components in case S1, and two additional ones in cases S2 and S4, respectively. Case S5 corresponds to a non-steady-state resonant wave, with
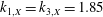 $k_{1,X}=k_{3,X}=1.85$
,
$k_{1,X}=k_{3,X}=1.85$
,
 $k_{2,X}=1.20$
,
$k_{2,X}=1.20$
,
 $k_{4,X}=2.50$
and
$k_{4,X}=2.50$
and
 $a_{1}k_{1}=a_{2}k_{2}=a_{3}k_{3}=a_{4}k_{4}=0.1$
, which provides us with a contrasting experiment to verify the steady-state resonant waves.
$a_{1}k_{1}=a_{2}k_{2}=a_{3}k_{3}=a_{4}k_{4}=0.1$
, which provides us with a contrasting experiment to verify the steady-state resonant waves.
Figure 2 shows the perspective view of the theoretical solutions for symmetrical and anti-symmetrical groups of the steady-state resonant waves, respectively. With all crests keeping parallel to each other, the crests in figure 2(a) are wrapped by several nodal lines along the direction of propagation, while in figure 2(b) the nearby ones are wrapped and connected by saddle-like regions with smaller amplitudes to form several global long crests. The phase shift among different wave components is responsible for different wave patterns for the symmetrical and anti-symmetrical groups. Each pair of symmetrical and anti-symmetrical groups has qualitatively similar wave patterns as shown in figure 2, and different pairs simply correspond to the different length scales in the
 $\boldsymbol{Y}$
direction.
$\boldsymbol{Y}$
direction.
As discussed by Henderson et al. (Reference Henderson, Patterson and Segur2006), many issues may arise when generating periodic wave trains of permanent form in a basin. For two-sided segmented wavemakers, Li et al. (Reference Li, Chen, Li and Lu2012) found that the propagation direction of waves is the key issue affecting the simulation quality. Li et al. (Reference Li, Chen, Li and Lu2012) suggested that the angle
 ${\it\theta}$
between the propagating wave and the positive
${\it\theta}$
between the propagating wave and the positive
 $y$
-axis should satisfy
$y$
-axis should satisfy
 $30^{\circ }\leqslant {\it\theta}\leqslant 60^{\circ }$
. Note that within this restriction of angle, the criterion (4.15) in Fuhrman & Madsen (Reference Fuhrman and Madsen2006) is satisfied, which indicates that the third-order components should be included in the wave generation for short-crested waves. Otherwise, a number of rather pronounced unsteady features may appear in the basin (Hammack et al.
Reference Hammack, Henderson and Segur2005). So, to find the origin of the unsteadiness in the basin, the final composite wave groups are generated in such a way that more components are considered in our experiments, step by step, starting from the simplest oblique long-crested wave.
$30^{\circ }\leqslant {\it\theta}\leqslant 60^{\circ }$
. Note that within this restriction of angle, the criterion (4.15) in Fuhrman & Madsen (Reference Fuhrman and Madsen2006) is satisfied, which indicates that the third-order components should be included in the wave generation for short-crested waves. Otherwise, a number of rather pronounced unsteady features may appear in the basin (Hammack et al.
Reference Hammack, Henderson and Segur2005). So, to find the origin of the unsteadiness in the basin, the final composite wave groups are generated in such a way that more components are considered in our experiments, step by step, starting from the simplest oblique long-crested wave.
Due to the symmetries of wavevectors and amplitudes, the wave components
 $\cos (m_{1}{\it\xi}_{1}+m_{2}{\it\xi}_{2}+m_{3}{\it\xi}_{3})$
and
$\cos (m_{1}{\it\xi}_{1}+m_{2}{\it\xi}_{2}+m_{3}{\it\xi}_{3})$
and
 $\cos ((m_{2}+n){\it\xi}_{1}+(m_{1}-n){\it\xi}_{2}+m_{3}{\it\xi}_{3})$
share the same amplitude and frequency for some integers
$\cos ((m_{2}+n){\it\xi}_{1}+(m_{1}-n){\it\xi}_{2}+m_{3}{\it\xi}_{3})$
share the same amplitude and frequency for some integers
 $n$
. Also, the wave components
$n$
. Also, the wave components
 $\cos (m_{1}{\it\xi}_{1}+m_{2}{\it\xi}_{2}+m_{3}{\it\xi}_{3})$
and
$\cos (m_{1}{\it\xi}_{1}+m_{2}{\it\xi}_{2}+m_{3}{\it\xi}_{3})$
and
 $\cos ((m_{1}+n){\it\xi}_{1}+(m_{2}-n){\it\xi}_{2}+m_{3}{\it\xi}_{3})$
share the same frequency, where
$\cos ((m_{1}+n){\it\xi}_{1}+(m_{2}-n){\it\xi}_{2}+m_{3}{\it\xi}_{3})$
share the same frequency, where
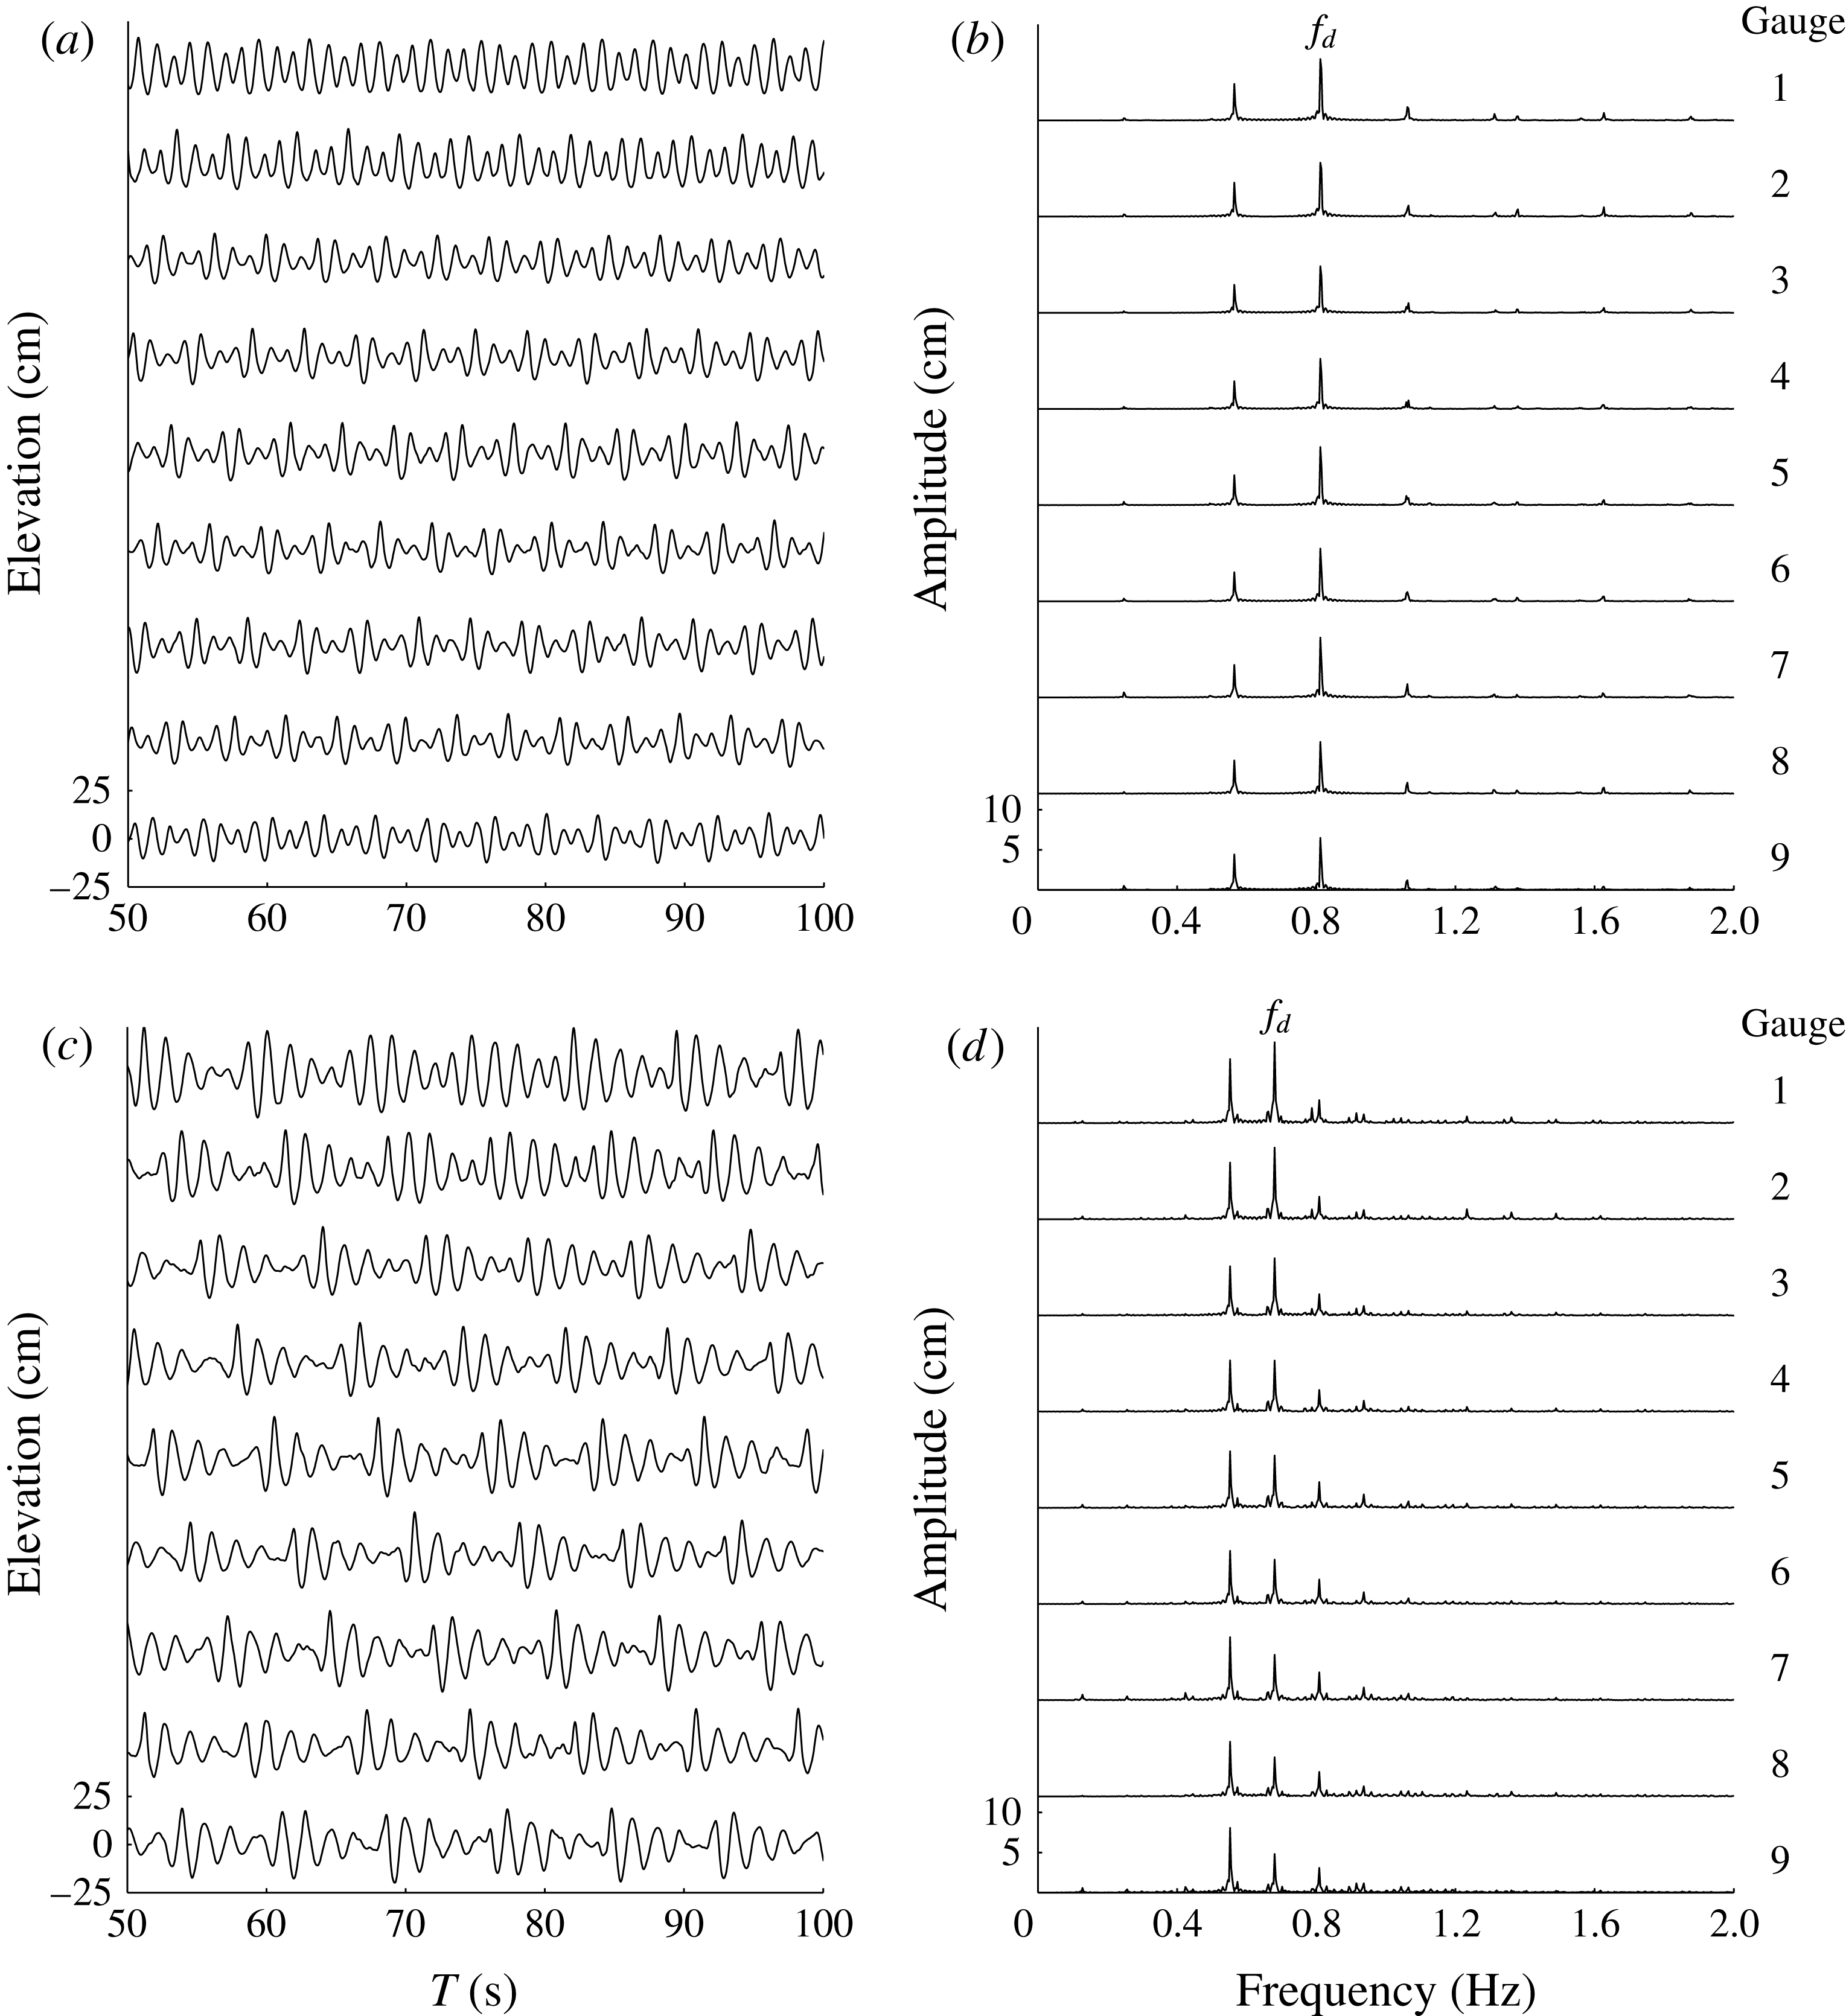
 $n$
is an arbitrary integer. So, for wave groups composite of several trains of short-crested waves, one frequency in the spectrum may contain many different components. For the convenience of quantitative analysis of the spectrum, we introduce the dominant frequency
$n$
is an arbitrary integer. So, for wave groups composite of several trains of short-crested waves, one frequency in the spectrum may contain many different components. For the convenience of quantitative analysis of the spectrum, we introduce the dominant frequency
 $f_{d}$
, at which the amplitude is the largest at the first gauge site. Then, the variance of wave amplitudes at the dominant frequency among wave gauges distributed in the first gauge array (along the direction of propagation of wave groups) represents the degree of amplitude uniformity of the whole wavefield in space.
$f_{d}$
, at which the amplitude is the largest at the first gauge site. Then, the variance of wave amplitudes at the dominant frequency among wave gauges distributed in the first gauge array (along the direction of propagation of wave groups) represents the degree of amplitude uniformity of the whole wavefield in space.
3. Experimental facilities and procedures
Experiments are conducted at the Deep Ocean Engineering Basin, SKLOE, in Shanghai Jiao Tong University.
3.1. Overview of facilities
The schematic layout of the laboratory facilities is shown in figure 3. The basin is 50 m in length and 40 m in width, with a movable floor so that the water depth can be adjusted from 0 to 10 m. The effective water depth of 8 m is used in the current experiment. Two reservoirs and arc-type sloping beaches are located opposite to the two-sided segmented wavemakers (Liang, Yang & Yang Reference Liang, Yang and Yang2006). The satisfactory performance of the wave-absorbing beaches will be verified later. The basin has a controlled,
 $x,y,z$
positioning trailer that rides over the basin, which is used to support wave gauges through a 24 m truss at any desired position and angle.
$x,y,z$
positioning trailer that rides over the basin, which is used to support wave gauges through a 24 m truss at any desired position and angle.
The wave simulation system with the two-sided segmented wavemakers driven by electric servomotors is composite of 222 flap wave generators on two adjacent sides of the basin. There are 122 paddles on the long side and 100 paddles on the short. Each paddle is 0.4 m wide and 1.2 m high under water, and is driven by a servomotor so that it can generate waves independently. The wave simulation system can generate regular waves, and long-crested and short-crested irregular waves. For more details about the equipment and simulation performance, please refer to Li et al. (Reference Li, Chen, Li and Lu2012).
The primary method of wave measurement is a linear array of nine wave gauges on a rigid frame. Supported by the trailer, the frame can rotate 360° around the middle gauge. Each gauge was fixed on the frame 3 m apart. The gauge array was first arranged along the direction of propagation of the composite waves (along the
 $X$
axis) using gauges numbered from 1 to 9. After each case was conducted once, the gauge array was rotated 90° counterclockwise around the middle gauge. Then, each case was conducted again with the gauge array arranged normal to the direction of propagation (along the
$X$
axis) using gauges numbered from 1 to 9. After each case was conducted once, the gauge array was rotated 90° counterclockwise around the middle gauge. Then, each case was conducted again with the gauge array arranged normal to the direction of propagation (along the
 $Y$
axis) using gauges numbered from 10 to 18, as shown in figure 3. Before and after the rotation, a laser target designator was used to fix the middle gauge 20 m away from both the long and short sides of the basin. All wave gauges were calibrated in a quiescent basin, and continuous-time signals for 300 s were obtained in two directions. The analogue signals from these gauges were digitized to produce 25 Hz discrete-time data (filtering with 2.5 Hz cutoff).
$Y$
axis) using gauges numbered from 10 to 18, as shown in figure 3. Before and after the rotation, a laser target designator was used to fix the middle gauge 20 m away from both the long and short sides of the basin. All wave gauges were calibrated in a quiescent basin, and continuous-time signals for 300 s were obtained in two directions. The analogue signals from these gauges were digitized to produce 25 Hz discrete-time data (filtering with 2.5 Hz cutoff).
The images were taken by a D80 Cannon camera above the point denoted
3.2. Generation of oblique long-crested waves
When an oblique long-crested wave is made by two-sided segmented wavemakers, each paddle is used as an independent wave generator. In the laboratory-coordinates system, the control signal of the paddles on the two sides can be expressed by
 $$\begin{eqnarray}\displaystyle & \displaystyle {\it\eta}((101-j)b,n{\rm\Delta}t)=\frac{a}{T(w,{\it\theta})}\cos (nw{\rm\Delta}t-k(\,j-1)b\sin {\it\theta}),\quad 1\leqslant j\leqslant 100, & \displaystyle\end{eqnarray}$$
 $$\begin{eqnarray}\displaystyle & \displaystyle {\it\eta}(\,jb,n{\rm\Delta}t)=\frac{a}{T(w,90-{\it\theta})}\cos (nw{\rm\Delta}t-k(\,j-99)b\sin (90-{\it\theta})),\quad 101\leqslant j\leqslant 222, & \displaystyle \nonumber\\ \displaystyle & & \displaystyle\end{eqnarray}$$
 $a$
is the amplitude,
$a$
is the amplitude,
 $b$
is the width of each paddle,
$b$
is the width of each paddle,
 ${\it\theta}$
is the angle between the propagating wave and the positive
${\it\theta}$
is the angle between the propagating wave and the positive
 $y$
-axis, and
$y$
-axis, and
 $T(w,{\it\theta})$
is the transfer function of wavemakers. Here, the linear wavemaker theory is applied and all angles are in degrees.
$T(w,{\it\theta})$
is the transfer function of wavemakers. Here, the linear wavemaker theory is applied and all angles are in degrees.
Due to the physical set up of the generators (Sand & Mynett Reference Sand and Mynett1987), the amplitude of even a simple regular oblique wave is non-uniformly distributed over whole wavefield. Thus, a wave simulation system in a basin has an inherent error, which is unavoidable. So, to quantify the difference between theoretical and measured amplitudes of a simple regular oblique wave, we define the absolute error
 ${\it\delta}_{a,i}$
:
${\it\delta}_{a,i}$
:
 $$\begin{eqnarray}{\it\delta}_{a,i}=\frac{\left|A_{i}-A^{\ast }\right|}{A^{\ast }},\end{eqnarray}$$
where
 $A_{i}$
denotes the measured amplitude at the
$A_{i}$
denotes the measured amplitude at the
 $i$
th wave gauge, and
$i$
th wave gauge, and
 $A^{\ast }$
denotes the corresponding theoretical one. For each oblique long-crested wave, the stroke of the wavemakers was adjusted so that the absolute error of the middle gauge
$A^{\ast }$
denotes the corresponding theoretical one. For each oblique long-crested wave, the stroke of the wavemakers was adjusted so that the absolute error of the middle gauge
 ${\bf\delta}_{a,5}\leqslant 0.05$
in the initial 30 s starting from
${\bf\delta}_{a,5}\leqslant 0.05$
in the initial 30 s starting from
 $T=50~\text{s}$
. Records starting from
$T=50~\text{s}$
. Records starting from
 $T=50~\text{s}$
are used so as to exclude the quiescent and transient intervals.
$T=50~\text{s}$
are used so as to exclude the quiescent and transient intervals.
Note that the primary objective of this work is to confirm the existence of a steady-state discrete wave spectrum when the resonance mechanism is triggered. Due to the inherent error of the wave simulation system, it is necessary to clarify to what extent the wavefield of an oblique regular long-crested wave keeps its uniformity in space. Thus, we define here the two dimensionless spatial variations of amplitude
 $$\begin{eqnarray}\displaystyle {\it\delta}_{r,2}=\frac{\sqrt{\displaystyle \frac{1}{2}[(A_{1}-\widetilde{A})^{2}+(A_{9}-\widetilde{A})^{2}]}}{\widetilde{A}},\quad {\it\delta}_{r,9}=\frac{\sqrt{\displaystyle \frac{1}{9}\left[\mathop{\sum }_{i=1}^{9}(A_{i}-\widetilde{A})^{2}\right]}}{\widetilde{A}}, & & \displaystyle\end{eqnarray}$$
where
 $\widetilde{A}$
is the average amplitude of two or all nine wave gauges.
$\widetilde{A}$
is the average amplitude of two or all nine wave gauges.
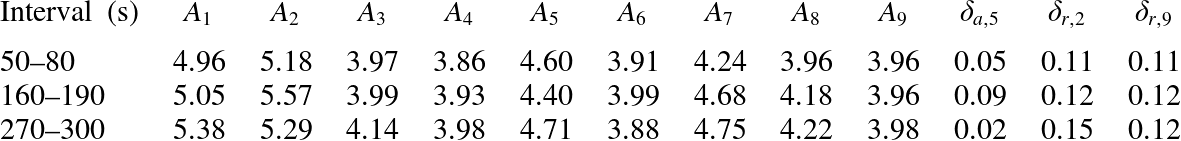
Taking the third wave component in case S1 as an example, table 3 shows the measured amplitudes for three 30 s intervals at the nine gauge sites in the first array. In the first interval 50–80 s, we have the absolute error
 ${\it\delta}_{a,5}=0.05$
(this is used to adjust the wavemakers) and the spatial variations
${\it\delta}_{a,5}=0.05$
(this is used to adjust the wavemakers) and the spatial variations
 ${\it\delta}_{r,2}={\it\delta}_{r,9}=0.11$
that indicate the inherent error of the wave simulation system. In the two subsequent 30 s intervals, the wave amplitude at every gauge site
${\it\delta}_{r,2}={\it\delta}_{r,9}=0.11$
that indicate the inherent error of the wave simulation system. In the two subsequent 30 s intervals, the wave amplitude at every gauge site
 $A_{i}$
changes slightly (so does the absolute error
$A_{i}$
changes slightly (so does the absolute error
 ${\it\delta}_{a,5}$
), while the spatial variations, especially
${\it\delta}_{a,5}$
), while the spatial variations, especially
 ${\it\delta}_{r,9}$
, keep almost constant. This indicates that the spatial steadiness of oblique long-crested waves is reliable over a long time in the basin and
${\it\delta}_{r,9}$
, keep almost constant. This indicates that the spatial steadiness of oblique long-crested waves is reliable over a long time in the basin and
 ${\it\delta}_{r,9}\approx 0.11$
may serve as the inherent system error for a steady-state wave in the basin. In other words, if the spatial variation
${\it\delta}_{r,9}\approx 0.11$
may serve as the inherent system error for a steady-state wave in the basin. In other words, if the spatial variation
 ${\it\delta}_{r,9}$
of a wavefield is approximately 0.11, we may regard it as a steady state.
${\it\delta}_{r,9}$
of a wavefield is approximately 0.11, we may regard it as a steady state.
Wave amplitudes (cm) and related errors for the third wave component in the first gauge array, for three 30 s intervals, for case S1.
3.3. Generation of composite short-crested waves
Following Hammack et al. (Reference Hammack, Scheffner and Segur1989, Reference Hammack, Henderson and Segur2005), we use the following procedure to generate the steady-state resonant waves. First, the wavemakers were programmed to generate each oblique long-crested wave separately. Then, two oblique long-crested waves, which share the same height and period and propagate at an angle to each other, are generated together. Thereafter, the four components (three components in case S5) with larger amplitude are generated simultaneously. Finally, the whole composite wave system is superposed by all the separate signals in each case. The final forcing signal used for the wavemakers to generate the steady-state resonant waves was given by
 $$\begin{eqnarray}{\it\eta}((101-j)b,n{\rm\Delta}t)=\mathop{\sum }_{m=1}^{N}\frac{a_{m}}{T(w_{m},{\it\theta}_{m})}\cos (nw_{m}{\rm\Delta}t-k_{m}(\,j-1)b\sin {\it\theta}_{m})\end{eqnarray}$$
for
 $1\leqslant j\leqslant 100$
and
$1\leqslant j\leqslant 100$
and
 $$\begin{eqnarray}{\it\eta}(\,jb,n{\rm\Delta}t)=\mathop{\sum }_{m=1}^{N}\frac{a_{m}}{T(w_{m},90-{\it\theta}_{m})}\cos (nw_{m}{\rm\Delta}t-k_{m}(\,j-99)b\sin (90-{\it\theta}_{m}))\end{eqnarray}$$
for
 $101\leqslant j\leqslant 222$
, where
$101\leqslant j\leqslant 222$
, where
 $N$
is the number of wave components finally generated by the wavemakers in each case.
$N$
is the number of wave components finally generated by the wavemakers in each case.
Five cases were examined. Cases S1, S2 and S3, S4 correspond to the symmetrical and anti-symmetrical groups of the steady-state resonant waves, respectively, while case S5 is a non-steady-state near-resonance case that provides us a with contrasting experiment. For each case, we control the wave amplitude
 $a_{i}$
, the wave period
$a_{i}$
, the wave period
 $T_{i}$
and the angle
$T_{i}$
and the angle
 ${\it\theta}_{i}$
of wave propagation, as listed in table 4. These input parameters are based on the theoretical calculations given in table 2. Note that the third-to-sixth wave components share the same period
${\it\theta}_{i}$
of wave propagation, as listed in table 4. These input parameters are based on the theoretical calculations given in table 2. Note that the third-to-sixth wave components share the same period
 $T=1.23~\text{s}$
so that only three or even fewer significant peaks might appear in the wave spectrum, as shown in § 4. Each case was conducted twice, with the gauge array first fixed along the direction of the wave propagation and then normal to it.
$T=1.23~\text{s}$
so that only three or even fewer significant peaks might appear in the wave spectrum, as shown in § 4. Each case was conducted twice, with the gauge array first fixed along the direction of the wave propagation and then normal to it.
Parameters for experiments using the linear superposition of oblique long-crested waves. A negative
 $a_{i}$
means a 180° phase shift in that component and ‘—’ denotes that the value is not considered.
$a_{i}$
means a 180° phase shift in that component and ‘—’ denotes that the value is not considered.
4. Analysis of experimental results
Experimental data are first presented to demonstrate the existence of steady-state resonant waves through quantitative comparisons with the contrasting experiment for the non-steady-state case. Then, more detailed experimental data are presented to demonstrate the properties of symmetrical and anti-symmetrical groups of the steady-state resonant waves. For each experimental case, not only is a qualitative and quantitative analysis made, but a comparison with the theoretical results is also given.
4.1. Existence of the steady-state resonant waves
To confirm the existence of a steady-state wave spectrum when a resonant wave group is evolving in space, we investigate the amplitude uniformity along the direction of wave propagation. Taking the cases S1 and S5 as examples, figure 4 shows the initial 50 s record data obtained from the first gauge array and the corresponding Fourier transforms during 50–300 s. Most quasi-periodic data records shown in figure 4(a,c) resemble their time series in case S1 (figure 4 a), but not in case S5 (figure 4 c). The wave spectra in figure 4(b,d) show the difference in amplitude distribution along the direction of propagation more clearly. In case S1 amplitudes of all frequencies are almost constant from one gauge site to the next, corresponding to a steady-state wave, while in case S5 the amplitudes change dramatically among different gauge sites, especially the amplitude at the dominant frequency, corresponding to non-steady-state ones.
50 s data record from the first gauge array (a,c), with corresponding Fourier transforms during 50–300 s (b,d). (a,b) Steady-state case S1; (c,d) non-steady-state case S5. The dominant frequency is denoted
 $f_{d}$
.
$f_{d}$
.
To further investigate the spatial variation of wave amplitudes in all cases considered, S1–S5, comparisons (with amplitude in log scale) of wave spectra between the first and ninth gauge site are shown in figures 5–7. Note that we first adjust, separately, each oblique long-crested wave component using the criterion
 ${\it\delta}_{a,5}\leqslant 0.05$
, and then generate the final resonant wave system, step by step, by adding more and more wave components as listed in tables 2 and 4. The wave spectra given by different numbers of wave components generated by wavemakers in case S1 are shown in figure 5. Figure 5(a,d) corresponds to the spectrum of waves generated by the third and forth wave components: the wave amplitude at the dominant frequency
${\it\delta}_{a,5}\leqslant 0.05$
, and then generate the final resonant wave system, step by step, by adding more and more wave components as listed in tables 2 and 4. The wave spectra given by different numbers of wave components generated by wavemakers in case S1 are shown in figure 5. Figure 5(a,d) corresponds to the spectrum of waves generated by the third and forth wave components: the wave amplitude at the dominant frequency
 $f_{d}=0.81$
decreases as the wave propagates from the first gauge site (
$f_{d}=0.81$
decreases as the wave propagates from the first gauge site (
 $A_{1}=9.16~\text{cm}$
) to the ninth one (
$A_{1}=9.16~\text{cm}$
) to the ninth one (
 $A_{9}=6.30~\text{cm}$
), with the spatial variance
$A_{9}=6.30~\text{cm}$
), with the spatial variance
 ${\it\delta}_{r,9}=0.17$
, as listed in table 5. Compared with the inherent system error
${\it\delta}_{r,9}=0.17$
, as listed in table 5. Compared with the inherent system error
 ${\it\delta}_{r,9}=0.11$
for steady-state waves, the increase of the spatial non-uniformity of amplitude for the short-crested waves is due to the neglect of the hight-order components. Figure 5(b,e) shows the spectra of waves generated by the first four components in case S1: the amplitude at the dominant frequency still decreases from
${\it\delta}_{r,9}=0.11$
for steady-state waves, the increase of the spatial non-uniformity of amplitude for the short-crested waves is due to the neglect of the hight-order components. Figure 5(b,e) shows the spectra of waves generated by the first four components in case S1: the amplitude at the dominant frequency still decreases from
 $A_{1}=7.49~\text{cm}$
at the first gauge to
$A_{1}=7.49~\text{cm}$
at the first gauge to
 $A_{9}=5.00~\text{cm}$
at the ninth one, with the spatial variation
$A_{9}=5.00~\text{cm}$
at the ninth one, with the spatial variation
 ${\it\delta}_{r,9}=0.18$
, as listed in table 5. This is mainly because the first four wave components in case S1 do not contain enough wave energy greater than 95 %. Finally, the spectra of the resonant wave system generated by the eight wave components listed in tables 2 and 4 are as shown in figure 5(c,f): the amplitudes of the dominant frequency vary from
${\it\delta}_{r,9}=0.18$
, as listed in table 5. This is mainly because the first four wave components in case S1 do not contain enough wave energy greater than 95 %. Finally, the spectra of the resonant wave system generated by the eight wave components listed in tables 2 and 4 are as shown in figure 5(c,f): the amplitudes of the dominant frequency vary from
 $A_{1}=7.65~\text{cm}$
at the first gauge to
$A_{1}=7.65~\text{cm}$
at the first gauge to
 $A_{9}=6.48~\text{cm}$
at the ninth gauge, while the amplitude spatial variance decreases to
$A_{9}=6.48~\text{cm}$
at the ninth gauge, while the amplitude spatial variance decreases to
 ${\it\delta}_{r,9}=0.08$
as listed in table 5, which is even smaller than the inherent system error
${\it\delta}_{r,9}=0.08$
as listed in table 5, which is even smaller than the inherent system error
 ${\it\delta}_{r,9}=0.11$
for steady-state waves. Note that the generation of the additional four wave components increases the wave energy but decreases the degree of spatial non-uniformity of amplitude. This is mainly because a large enough number of wave components of the corresponding resonant wave system are generated by the wavemaker. All of this supports our conclusion that the wave spectrum in case S1 corresponds to a steady-state resonant wave.
${\it\delta}_{r,9}=0.11$
for steady-state waves. Note that the generation of the additional four wave components increases the wave energy but decreases the degree of spatial non-uniformity of amplitude. This is mainly because a large enough number of wave components of the corresponding resonant wave system are generated by the wavemaker. All of this supports our conclusion that the wave spectrum in case S1 corresponds to a steady-state resonant wave.
Fourier transforms of the experimental records in the time interval 50–300 s at the first gauge site (a–c), and the ninth gauge site (d–f), for case S1: (a,d) only third and fourth wave components generated; (b,e) the first four wave components generated; (c, f) all eight wave components generated. The dominant frequency is
 $f_{d}=0.81~\text{Hz}$
.
$f_{d}=0.81~\text{Hz}$
.

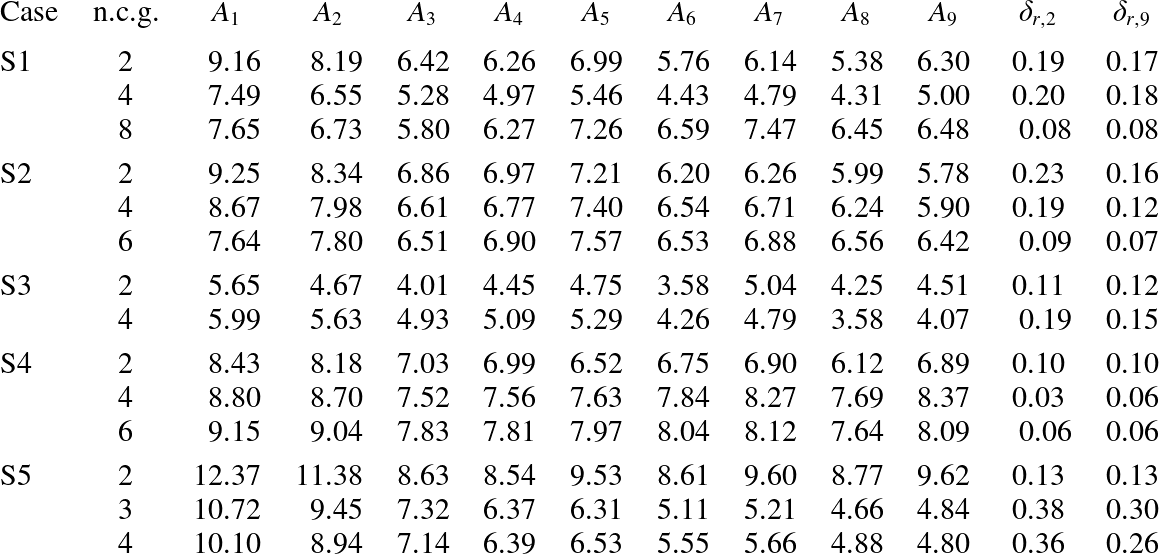
Amplitudes (cm) at the dominant frequencies and the corresponding spatial variations based on Fourier transforms of the experimental records at the first gauge array for all cases. Here, ‘n.c.g.’ is an abbreviation for ‘number of components generated’.
Similarly, the corresponding spectra for case S5 at the first gauge and the ninth gauge are shown in figures 6(a–c) and 6(d–f), respectively. Figure 6(a,d) corresponds to the spectra of waves generated by the first and third components only, with the spatial variation of wave amplitude
 ${\it\delta}_{r,9}=0.13$
. Figure 6(b,e) corresponds to the spectra of waves generated by the first three components: compared to figure 6(a,d), the amplitude at the dominant frequency decreases remarkably, from
${\it\delta}_{r,9}=0.13$
. Figure 6(b,e) corresponds to the spectra of waves generated by the first three components: compared to figure 6(a,d), the amplitude at the dominant frequency decreases remarkably, from
 $A_{1}=10.72~\text{cm}$
at the first gauge to
$A_{1}=10.72~\text{cm}$
at the first gauge to
 $A_{9}=4.84~\text{cm}$
at the ninth gauge, with the spatial variation
$A_{9}=4.84~\text{cm}$
at the ninth gauge, with the spatial variation
 ${\it\delta}_{r,9}=0.30$
. Figure 6(c,f) gives the spectra of waves generated by all four components: the wave amplitude varies greatly from
${\it\delta}_{r,9}=0.30$
. Figure 6(c,f) gives the spectra of waves generated by all four components: the wave amplitude varies greatly from
 $A_{1}=10.10~\text{cm}$
at the first gauge to
$A_{1}=10.10~\text{cm}$
at the first gauge to
 $A_{9}=4.80~\text{cm}$
at the ninth one, with the spatial variation
$A_{9}=4.80~\text{cm}$
at the ninth one, with the spatial variation
 ${\it\delta}_{r,9}=0.26$
that is two times larger than the inherent system error
${\it\delta}_{r,9}=0.26$
that is two times larger than the inherent system error
 ${\it\delta}_{r,9}=0.11$
. Obviously, as more components are generated, the closer the corresponding wavefield gets to the non-steady-state resonant one for case S5. The comparison between spectra in figure 6 eliminates other possible reasons except the nonlinear resonant interactions that result in the loss of steadiness in case S5. All of this supports our conclusion that the wave spectrum in case S5 belongs to a non-steady-state one.
${\it\delta}_{r,9}=0.11$
. Obviously, as more components are generated, the closer the corresponding wavefield gets to the non-steady-state resonant one for case S5. The comparison between spectra in figure 6 eliminates other possible reasons except the nonlinear resonant interactions that result in the loss of steadiness in case S5. All of this supports our conclusion that the wave spectrum in case S5 belongs to a non-steady-state one.
Fourier transforms of the experimental records for case S5 at the first gauge site (a–c), and the ninth gauge site (d–f), during the interval 50–300 s: (a,d) first and third components generated; (b,e) first three components generated; (c, f) all four components generated. The dominant frequency is
 $f_{d}=0.68~\text{Hz}$
.
$f_{d}=0.68~\text{Hz}$
.

Fourier transforms of the experimental records at the first gauge site (a–c), and ninth gauge site (d–f), in the time interval 50–300 s when all components are generated: (a,d) case S2; (b,e) case S3; (c, f) case S4. The dominant frequency is
 $f_{d}=0.81~\text{Hz}$
, 0.56 Hz and 0.56 Hz, respectively.
$f_{d}=0.81~\text{Hz}$
, 0.56 Hz and 0.56 Hz, respectively.
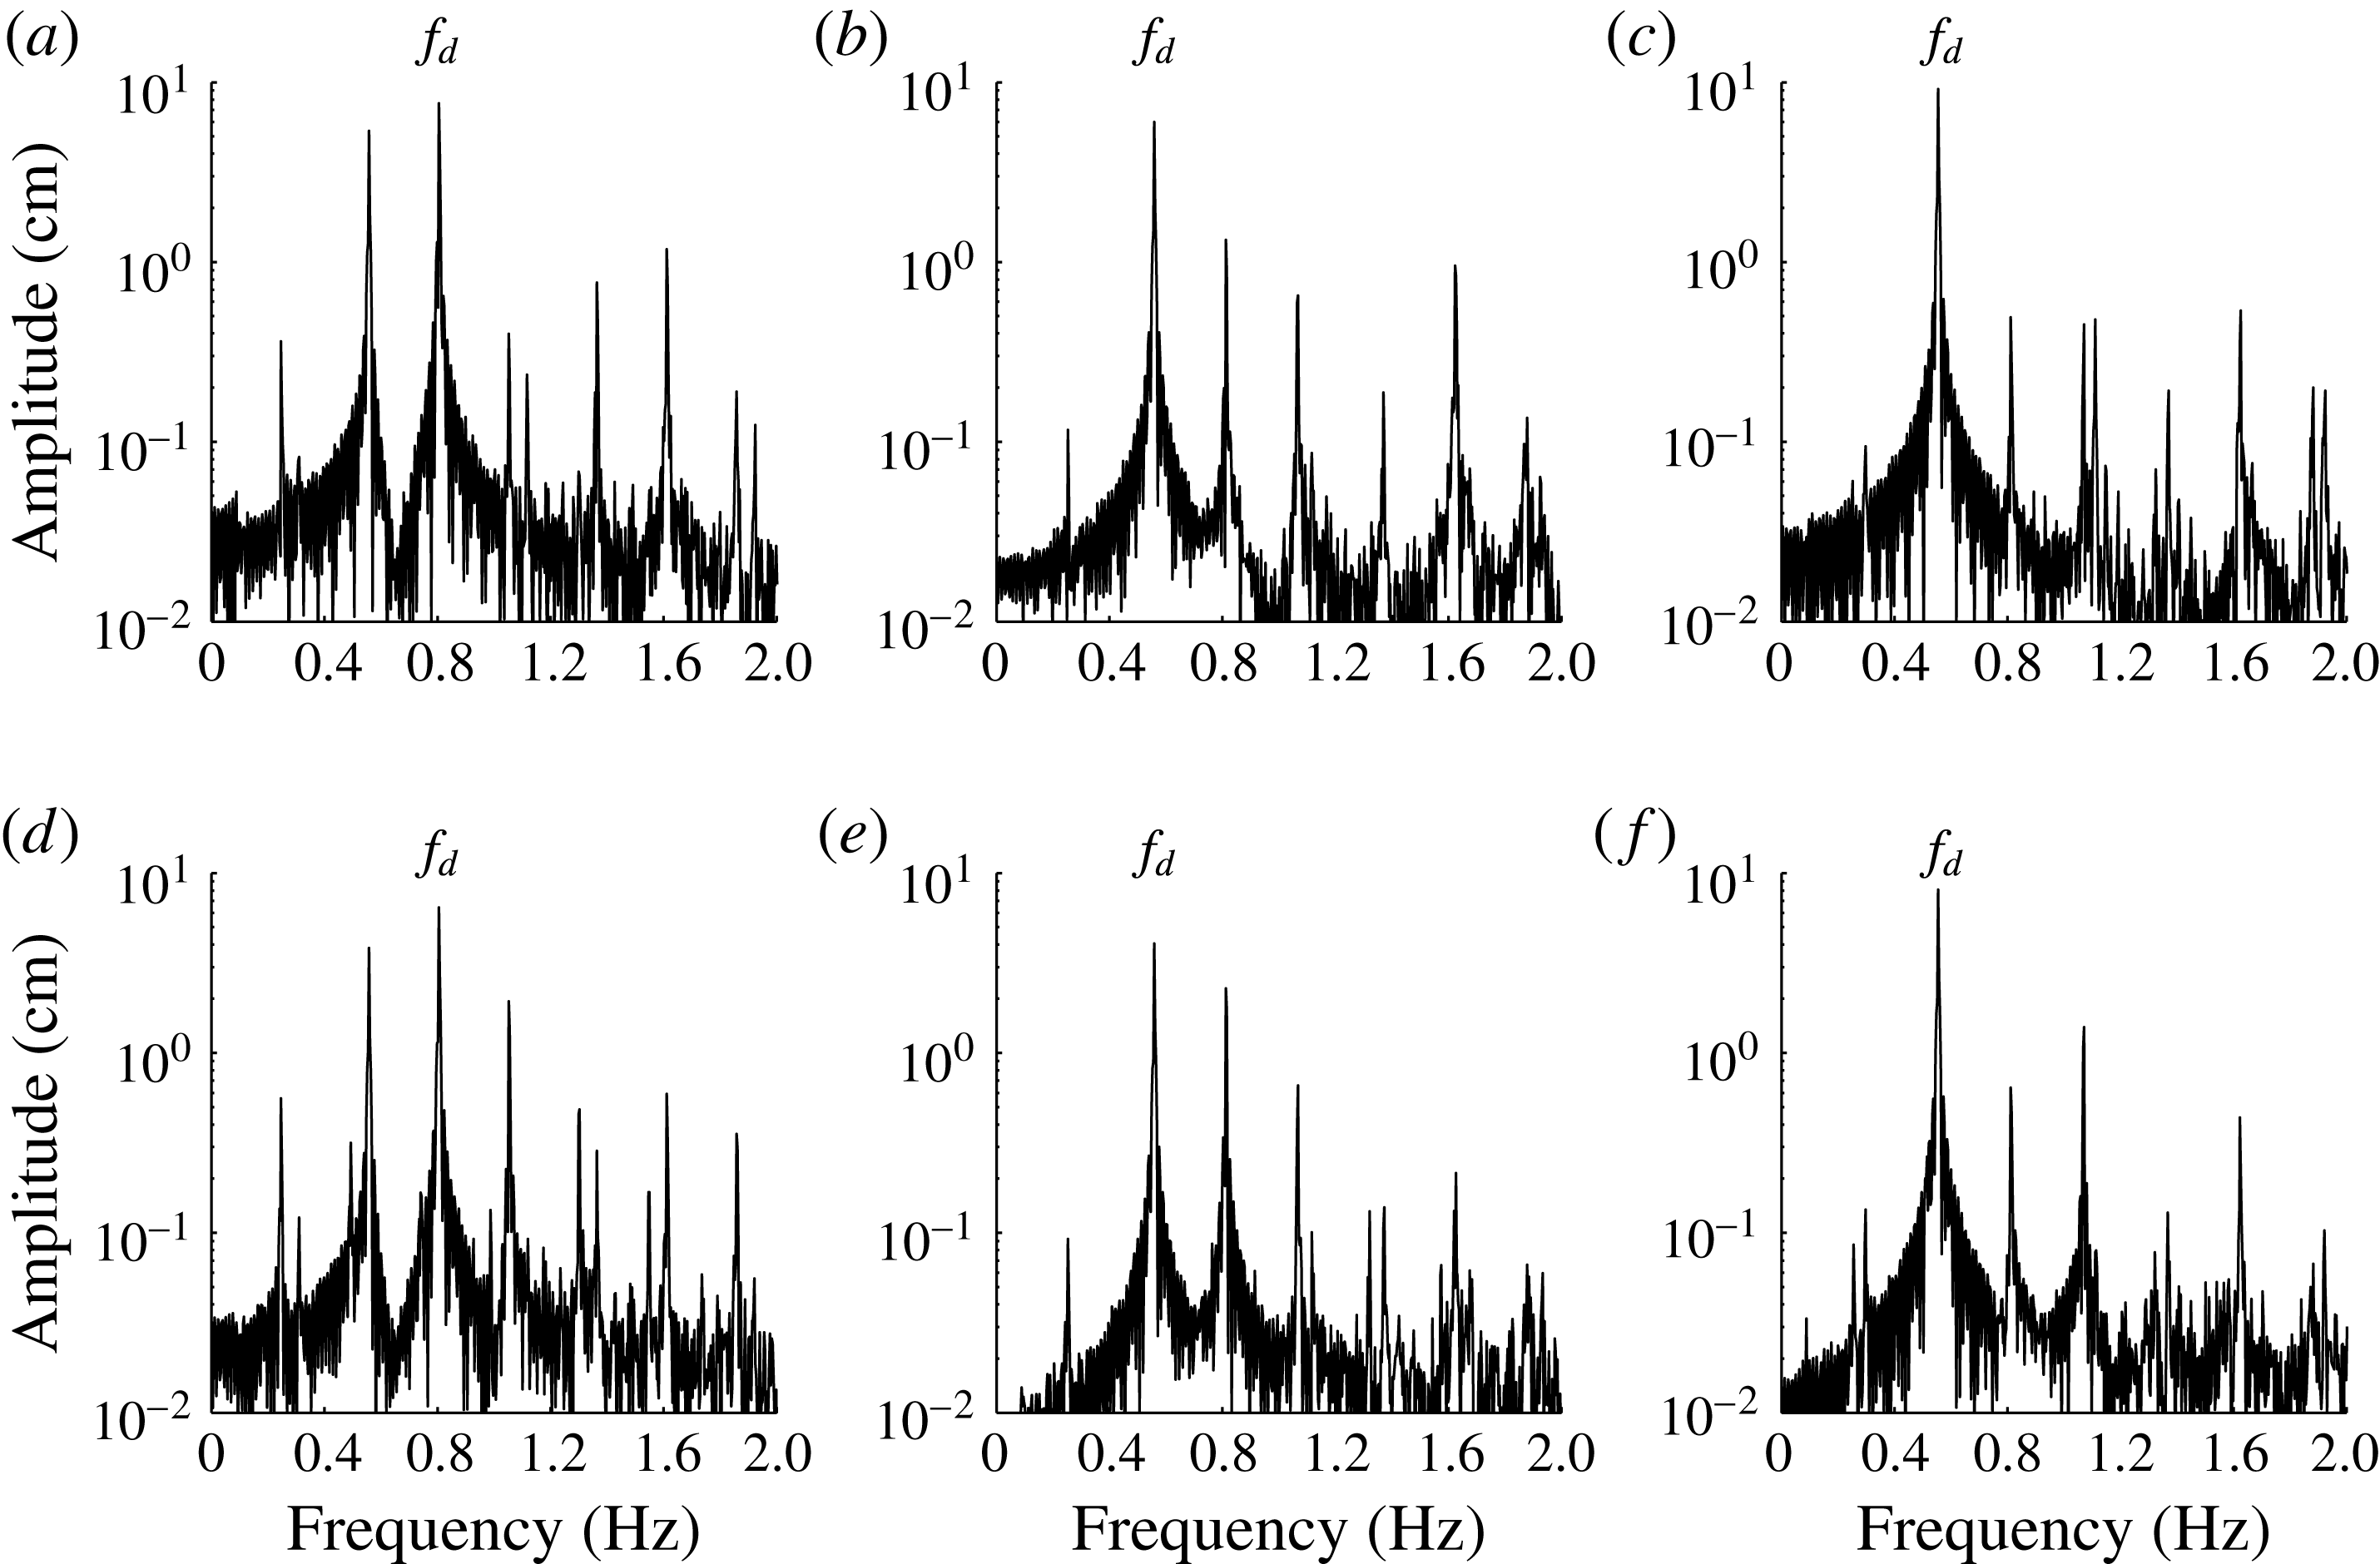
For the other three cases S2, S3 and S4, figure 7 shows the comparison of spectra of waves generated by all components listed in table 2 at the first gauge (figure 7
a–c) and the ninth one (figure 7
d–f). In all three cases the evidence of nonlinear interactions is obvious. In cases S2 and S4, the amplitudes at the dominant frequency remain almost constant, with
 ${\it\delta}_{r,9}=0.07$
and
${\it\delta}_{r,9}=0.07$
and
 ${\it\delta}_{r,9}=0.06$
, respectively, as listed in table 5. In case S3, the amplitude reduces by one-third from
${\it\delta}_{r,9}=0.06$
, respectively, as listed in table 5. In case S3, the amplitude reduces by one-third from
 $A_{1}=5.99~\text{cm}$
to
$A_{1}=5.99~\text{cm}$
to
 $A_{9}=4.07~\text{cm}$
, with the spatial variance
$A_{9}=4.07~\text{cm}$
, with the spatial variance
 ${\it\delta}_{r,9}=0.15$
, which is a little larger than the inherent system error
${\it\delta}_{r,9}=0.15$
, which is a little larger than the inherent system error
 ${\it\delta}_{r,9}=0.11$
. This is possibly due to the neglect of high-order components that are too small to be generated in our basin, since only four components are generated in case S3. Even though the amplitude uniformity in case S3 is not very well satisfied, the amplitude variance is much smaller than that in case S5 for the non-steady-state resonant waves. The case S3 illustrates that it seems impossible to generate steady-state resonant waves of moderate steepness without including high-order components. It is necessary to reconsider the case S3 by using better wave simulation systems with some high-order resonant components.
${\it\delta}_{r,9}=0.11$
. This is possibly due to the neglect of high-order components that are too small to be generated in our basin, since only four components are generated in case S3. Even though the amplitude uniformity in case S3 is not very well satisfied, the amplitude variance is much smaller than that in case S5 for the non-steady-state resonant waves. The case S3 illustrates that it seems impossible to generate steady-state resonant waves of moderate steepness without including high-order components. It is necessary to reconsider the case S3 by using better wave simulation systems with some high-order resonant components.
Table 5 presents the amplitudes of the dominant frequencies at the first nine gauge sites and the corresponding spatial variations
 ${\it\delta}_{r,2}$
and
${\it\delta}_{r,2}$
and
 ${\it\delta}_{r,9}$
for all five cases. Here, ‘n.c.g.’ is an abbreviation for ‘number of components generated’. It is found that, in cases S1, S2 and S4, when n.c.g. increases to 6 or 8, the spatial variations
${\it\delta}_{r,9}$
for all five cases. Here, ‘n.c.g.’ is an abbreviation for ‘number of components generated’. It is found that, in cases S1, S2 and S4, when n.c.g. increases to 6 or 8, the spatial variations
 ${\it\delta}_{r,2}$
and
${\it\delta}_{r,2}$
and
 ${\it\delta}_{r,9}$
decrease to a value smaller than the inherent system error
${\it\delta}_{r,9}$
decrease to a value smaller than the inherent system error
 ${\it\delta}_{r,2}={\it\delta}_{r,9}=0.11$
, indicating that the corresponding resonant waves are steady-state. However, in case S5, the spatial variations
${\it\delta}_{r,2}={\it\delta}_{r,9}=0.11$
, indicating that the corresponding resonant waves are steady-state. However, in case S5, the spatial variations
 ${\it\delta}_{r,2}$
and
${\it\delta}_{r,2}$
and
 ${\it\delta}_{r,9}$
increase and are respectively three and two times larger than the inherent system error, which strongly suggests that the corresponding resonant wave should be not steady-state. Note that the spatial variation in case S3 is a little larger than the inherent system error. This is possibly because all high-order resonant components are too small to be neglected in case S3. So, as mentioned above, case S3 should be reconsidered in the future, using a better wave simulation system and more accurate measuring equipment together with some high-order resonant components.
${\it\delta}_{r,9}$
increase and are respectively three and two times larger than the inherent system error, which strongly suggests that the corresponding resonant wave should be not steady-state. Note that the spatial variation in case S3 is a little larger than the inherent system error. This is possibly because all high-order resonant components are too small to be neglected in case S3. So, as mentioned above, case S3 should be reconsidered in the future, using a better wave simulation system and more accurate measuring equipment together with some high-order resonant components.
In summary, our experiments support the existence of the steady-state resonant waves.
4.2. Symmetrical group steady-state resonant waves
For representative symmetrical group steady-state resonant waves, figure 8 shows a perspective plot of the surface elevation in case S1. Both experimental and theoretical images are shown. It is found that the experimental wave pattern (figure 8 a) matches well with the theoretical one (figure 8 b). The corresponding movies are available online as supplementary material (movies 1 and 2).
Perspective plot of the free-surface in case S1. Crests in the middle region are marked as yellow lines. (a) Experimental result; (b) theoretical result.

To validate the theoretical solutions, figure 9 shows a comparison between experimental (black line) and theoretical (grey line, red online) wave profiles at the first gauge array for cases S1 and S2. The agreement between measured and theoretical data over 50 s (which covers 27 wave periods) is excellent. The wave groups evolving with constant amplitudes and frequencies is confirmed further through the free-surface comparison.
Comparison of the free surface between the experimental wave records (black) and the theoretical results (grey, red online) at the first gauge array for case S1 (a) and case S2 (b).
For data at the second gauge array, figure 10(a,c) indicates that the experimental records (black) agree well with the theoretical ones (grey, red online) for cases S1 and S2. The final wave patterns are composite of several short-crested waves with the same
 $Y$
-length scale; therefore it is found from figure 10(a–d) that the amplitudes for case S1 (S2) vary periodically within 5 (9) adjacent gauge sites, with two nodes located between gauges 12 (10) and 16 (18), respectively. Also, a global symmetry of time series around the middle gauge 14 can also been seen in figure 10, which indicates the symmetry of the wavefield in space and amplitude. The symmetrically distributed surface elevations among the nine equally spaced gauge sites indicate that the wavenumbers are indeed symmetrically distributed along the
$Y$
-length scale; therefore it is found from figure 10(a–d) that the amplitudes for case S1 (S2) vary periodically within 5 (9) adjacent gauge sites, with two nodes located between gauges 12 (10) and 16 (18), respectively. Also, a global symmetry of time series around the middle gauge 14 can also been seen in figure 10, which indicates the symmetry of the wavefield in space and amplitude. The symmetrically distributed surface elevations among the nine equally spaced gauge sites indicate that the wavenumbers are indeed symmetrically distributed along the
 $\boldsymbol{Y}$
axis; therefore the linear resonance condition is automatically satisfied. In addition, the symmetrically distributed amplitudes and phases around gauge 14 indicate that the nonlinear resonance condition is automatically satisfied, too. Thus, the symmetry in time series in figure 10 confirms that cases S1 and S2 belong to the symmetrical steady-state resonant wave groups.
$\boldsymbol{Y}$
axis; therefore the linear resonance condition is automatically satisfied. In addition, the symmetrically distributed amplitudes and phases around gauge 14 indicate that the nonlinear resonance condition is automatically satisfied, too. Thus, the symmetry in time series in figure 10 confirms that cases S1 and S2 belong to the symmetrical steady-state resonant wave groups.
Comparison of the free surface between experimental wave records (black) and theoretical ones (grey, red online) during 50–100 s (a,c), and the corresponding Fourier transforms on the whole 50–300 s interval (b,d), at the second gauge array: (a,b) case S1; (c,d) case S2.

4.3. Anti-symmetrical group steady-state resonant waves
For representative anti-symmetrical group steady-state resonant waves, figure 11 presents a perspective plot of the surface elevation for case S3. Again, both experimental and theoretical images are shown, and the crests in the middle region are marked as yellow lines. Different from figure 8, local short crests join together to form several global long ones. It clearly demonstrates the three-dimensional wave pattern of the anti-symmetrical group. Also, the experimental wave pattern (figure 11 a) matches well with the theoretical one (figure 11 b). The corresponding movies are available online (movies 3 and 4).
Perspective plot of the free surface for case S3. Crests in the middle region are marked as yellow lines. (a) Experimental result; (b) theoretical result.
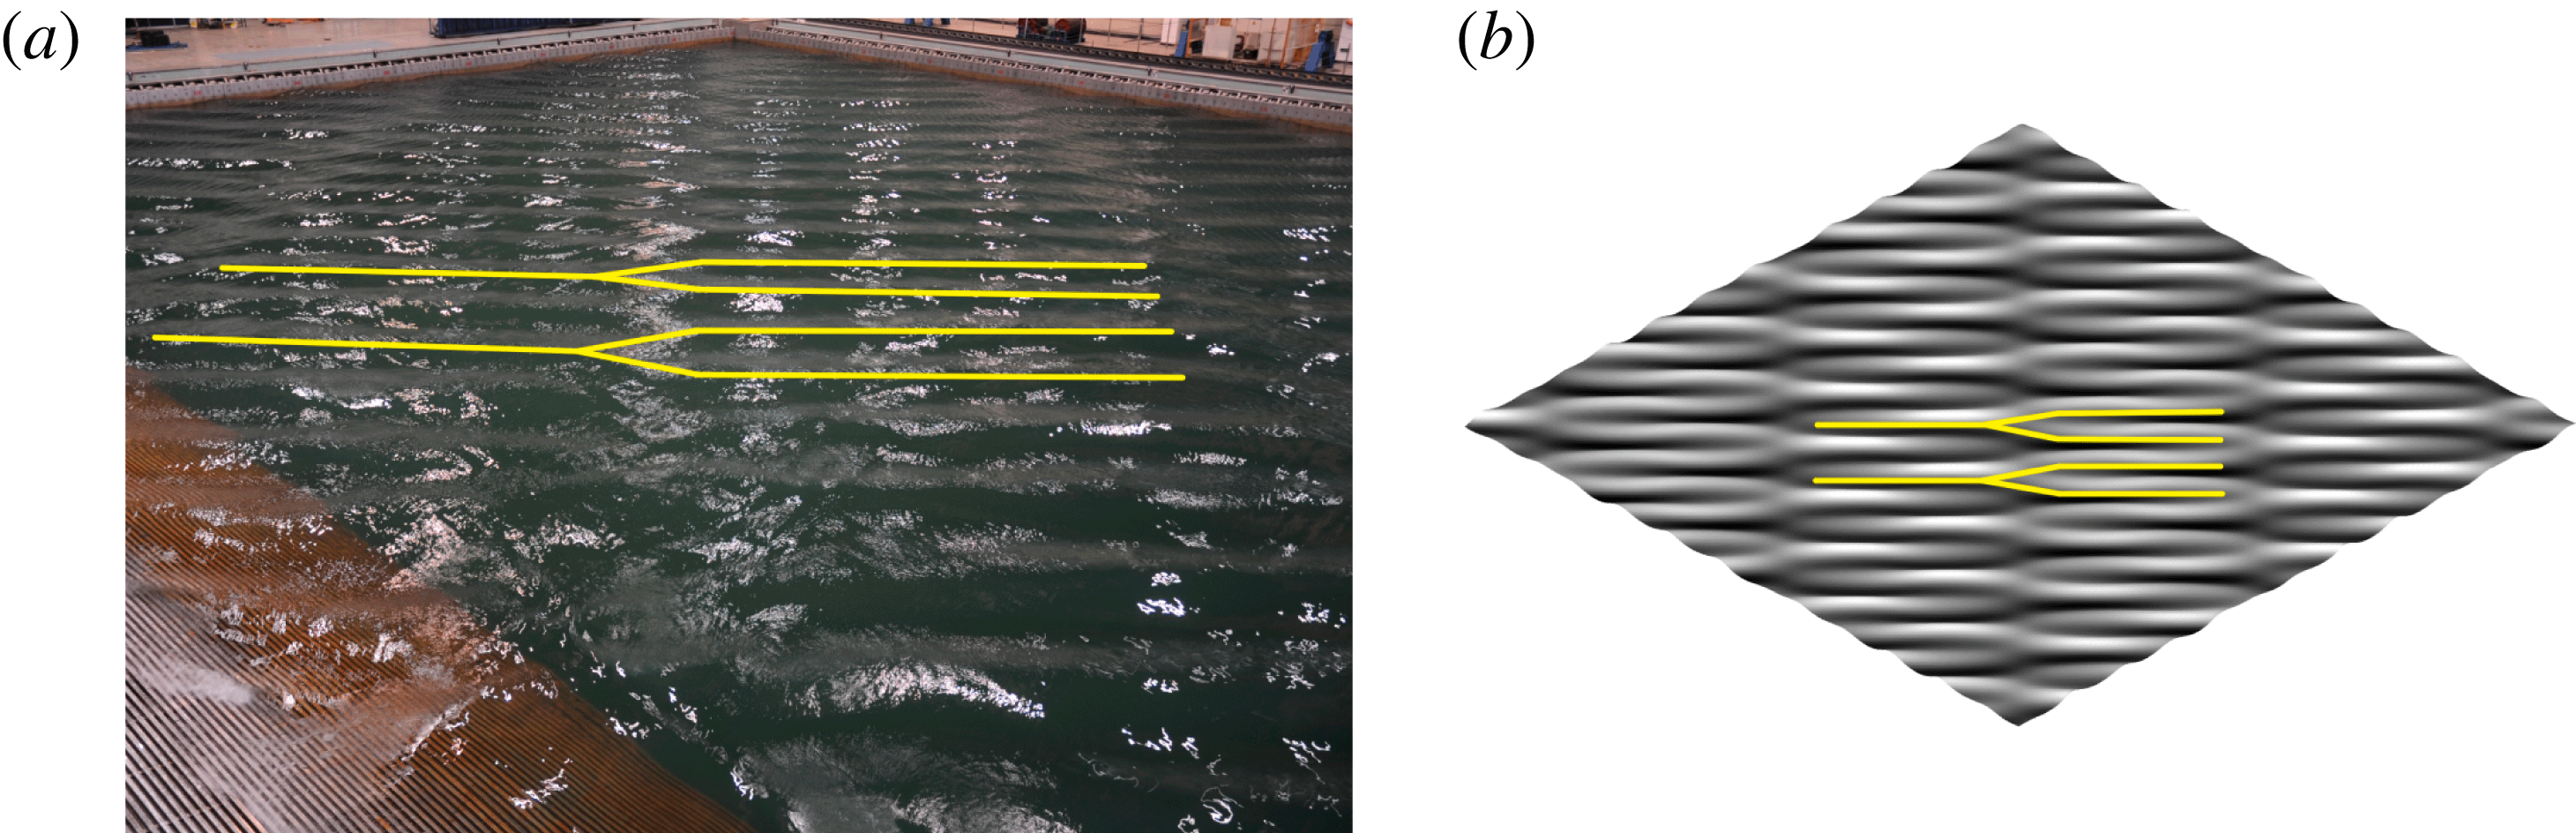
Figure 12 shows comparisons between experimental (black line) and theoretical (grey, red online) line) wave profiles at the first gauge array for cases S3 and S4. As the first gauge array is located on the anti-nodal line of the short-crested waves composite of the first and second components and on the nodal line of the short-crested waves formed by the rest of the two or four components, the corresponding time series appear as the uniform signature of a single travelling wave. The agreement between experimental and theoretical data over 50 s (which covers 27 wave periods) is satisfactory. Thus, the steady-state wave spectrum is further confirmed through the qualitative comparison of the free surfaces.
Comparison of the free surface between experimental wave records (black) and theoretical ones (grey, red online) at the first gauge array for case S3 (a) and case S4 (b).

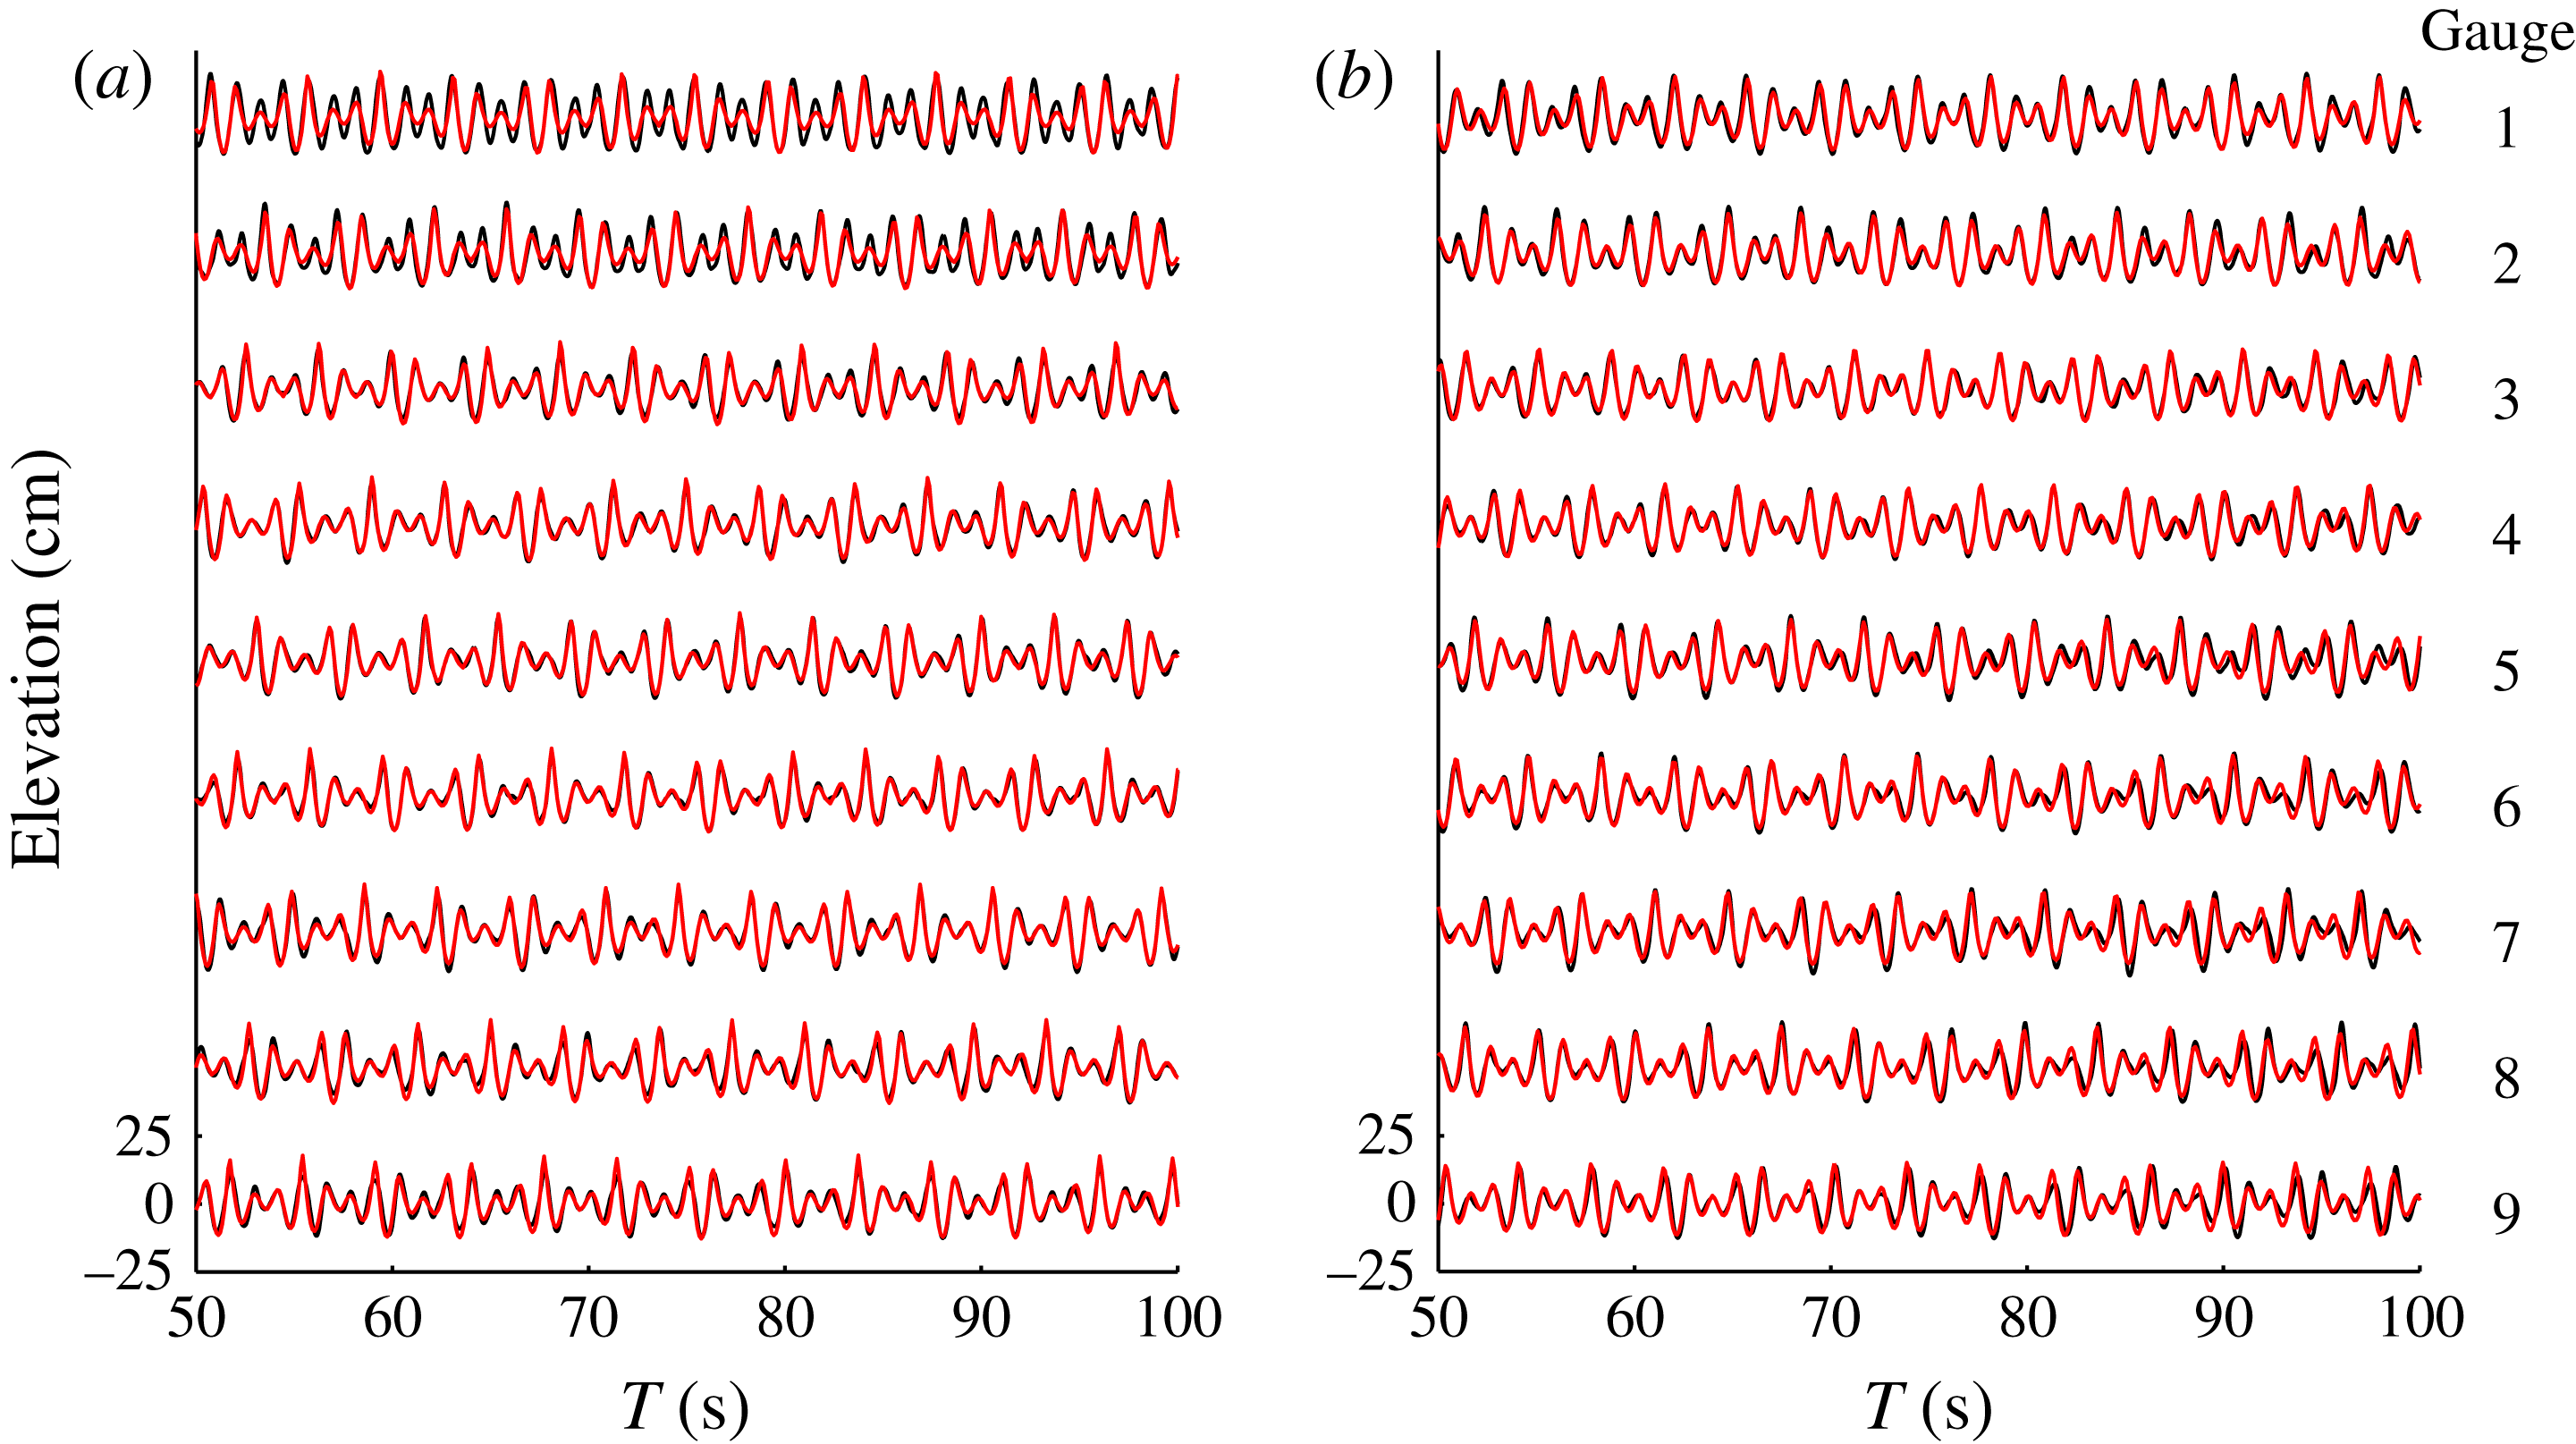
Figure 13 shows the time series and related Fourier transforms at the second gauge array for cases S3 and S4. The theoretical free surfaces are also presented. Due to the phase shift in components, the time series normal to the direction of wave propagation in the symmetrical and anti-symmetrical groups behave totally differently. For the anti-symmetrical group, the amplitudes still change periodically within 5 or 9 adjacent gauge sites, but no node was found on any gauge sites. Instead, the peak values of two significant components appear alternatively within every 3 or 5 adjacent gauge sites.
Comparison of the free surface between experimental wave records (black) and theoretical ones (grey, red online) during the interval 50–100 s (a,c), and the corresponding Fourier transforms on the whole 50–300 s interval (b,d), at the second gauge array: (a,b) case S3; (c,d) case S4.

The experimental data in figure 13(a,c) indicate the symmetry in space and amplitude around the middle gauge site 14, and the related Fourier transforms in figure 13(b,d) show it more clearly. Therefore, the anti-symmetrical groups automatically satisfy the linear and nonlinear resonance conditions, too. Whenever the amplitudes at the second significant frequency
 $f=0.81~\text{Hz}$
are non-trivial in the spectra, the related time series show anti-symmetry in phase around gauge site 14: a wave trough/group node at the
$f=0.81~\text{Hz}$
are non-trivial in the spectra, the related time series show anti-symmetry in phase around gauge site 14: a wave trough/group node at the
 $i$
th gauge site means a wave crest/group antinode at the
$i$
th gauge site means a wave crest/group antinode at the
 $(28-i)$
th gauge site. Thus, the time series in figure 13 confirm that cases S3 and S4 belong to the anti-symmetrical steady-state resonant wave groups.
$(28-i)$
th gauge site. Thus, the time series in figure 13 confirm that cases S3 and S4 belong to the anti-symmetrical steady-state resonant wave groups.
5. Conclusion
Phillips (Reference Phillips1960) gave a linear criterion of wave resonance and pointed out that the amplitude of the tertiary component grows linearly with time when its amplitude is initially zero. In general cases, Benney (Reference Benney1962) established the evolution equations of wave mode amplitudes, and demonstrated the well-known time-dependent periodic exchange of wave energy when the Phillips resonance criterion is fully or nearly satisfied. However, perturbation methods fail to obtain steady-state resonant waves without exchange of wave energy, mainly due to the singularities in the transfer functions, as mentioned by Madsen & Fuhrman (Reference Madsen and Fuhrman2012). By means of the ‘homotopy analysis method’ (Liao Reference Liao1992, Reference Liao1997, Reference Liao2004, Reference Liao2012), an analytic technique for highly nonlinear problems, multiple steady-state resonant waves in deep water were first found by Liao (Reference Liao2011) in theory, then investigated theoretically by Xu et al. (Reference Xu, Lin, Liao and Stiassnie2012) in shallow water and by Liu & Liao (Reference Liu and Liao2014) in rather more general cases. In this paper, we further confirm, for the first time, the existence of the multiple steady-state resonant waves by physical experiments in the advanced basin of the SKLOE, Shanghai Jiao Tong University, China.
First of all, using some experiments on regular waves whose wave spectra should be time-independent in theory, the inherent system error (
 ${\it\delta}_{r,9}=0.11$
) in the spatial variation of wave amplitude was determined, which provides a criterion to verify and check the existence of steady-state resonant waves in this basin. Then, five cases of resonant waves in deep water are considered: the first four cases (S1–S4) correspond to steady-state resonant waves, while case S5 relates to an non-steady-state ones that provides a contrasting experiment. The four resonant waves are obtained theoretically (Liao Reference Liao2011; Xu et al.
Reference Xu, Lin, Liao and Stiassnie2012; Liu & Liao Reference Liu and Liao2014) by means of the HAM (Liao Reference Liao1992, Reference Liao1997, Reference Liao2004, Reference Liao2012). They are chosen in such a way that the related dimensionless scaled variable
${\it\delta}_{r,9}=0.11$
) in the spatial variation of wave amplitude was determined, which provides a criterion to verify and check the existence of steady-state resonant waves in this basin. Then, five cases of resonant waves in deep water are considered: the first four cases (S1–S4) correspond to steady-state resonant waves, while case S5 relates to an non-steady-state ones that provides a contrasting experiment. The four resonant waves are obtained theoretically (Liao Reference Liao2011; Xu et al.
Reference Xu, Lin, Liao and Stiassnie2012; Liu & Liao Reference Liu and Liao2014) by means of the HAM (Liao Reference Liao1992, Reference Liao1997, Reference Liao2004, Reference Liao2012). They are chosen in such a way that the related dimensionless scaled variable
 $X={\it\epsilon}^{2}k_{0}x$
introduced by Shemer et al. (Reference Shemer, Kit and Jiao2002) reaches 1.5 at the ninth wave gauge, corresponding to sufficiently high nonlinearity of the waves considered, where
$X={\it\epsilon}^{2}k_{0}x$
introduced by Shemer et al. (Reference Shemer, Kit and Jiao2002) reaches 1.5 at the ninth wave gauge, corresponding to sufficiently high nonlinearity of the waves considered, where
 $k_{0}$
denotes the wavenumber of the component with the largest amplitude. A large enough number of wave components (with more than 95 % of the total wave energy) were generated so that the corresponding wavefields measured in the basin are close to the theoretical ones. Compared to the inherent system error of the basin and especially to the contrasting experiment (case S5), our experiments strongly suggest that the resonant waves in cases S1, S2, S3 and S4 are steady-state, say their wave spectra are independent of time. Also, both symmetrical and anti-symmetrical steady-state resonant waves were observed.
$k_{0}$
denotes the wavenumber of the component with the largest amplitude. A large enough number of wave components (with more than 95 % of the total wave energy) were generated so that the corresponding wavefields measured in the basin are close to the theoretical ones. Compared to the inherent system error of the basin and especially to the contrasting experiment (case S5), our experiments strongly suggest that the resonant waves in cases S1, S2, S3 and S4 are steady-state, say their wave spectra are independent of time. Also, both symmetrical and anti-symmetrical steady-state resonant waves were observed.
It should be emphasized that the so-called steady-state resonant waves were first found theoretically (Liao Reference Liao2011; Xu et al. Reference Xu, Lin, Liao and Stiassnie2012; Liu & Liao Reference Liu and Liao2014) by means of the HAM (Liao Reference Liao1992, Reference Liao1997, Reference Liao2004, Reference Liao2012), and then confirmed experimentally in this paper. This illustrates that the HAM is indeed a new method with great potential, since every new method should bring something new and/or different.
In summary, our experiments confirm the existence of multiple steady-state resonant waves in practice. This is helpful to deepen and enrich our understandings about resonance waves. Obviously, it would be very interesting to confirm the existence of the steady-state resonant waves in shallow water. This might be done in future, if possible.
Acknowledgements
We are indebted to the Director of the State Key Laboratory of Ocean Engineering, Professor J. M. Yang, for the use of the Deep Ocean Engineering Basin in SKLOE. Generous assistance was given by Dr W. H. Zhao, Y. F. Kou and Dr X. L. Tian and some other members of the SKLOE staffs, to whom we express our thanks. Thanks to Y. L. Zhao, J. F. Cui and X. M. Li for their help in the experiments. Thanks also go to Professor L. Shemer (Tel-Aviv University, Israel), Professor J. H. Duncan (University of Maryland, USA) and the anonymous reviewers for their valuable comments and suggestions, which greatly enhanced the quality of this article. This work is partly supported by the National Natural Science Foundation of China (Approval No. 11272209 and 11432009), State Key Laboratory of Ocean Engineering (Approval No. GKZD010063), the Lloyd’s Register Foundation (LRF), and the Deanship of Scientific Research (DSR) of King Abdulaziz University (KAU) under Grant No. 37-130-35-HiCi.
Supplementary movies
Supplementary movies are available online at http://dx.doi.org/10.1017/jfm.2014.658.


 Open access