


Non-technical Summary
Every animal and plant interacts with many other individuals, including disease-causing organisms, prey items, or pollinators, throughout their lives. These interactions necessarily contribute to the ecological and evolutionary processes that are associated with the diverse forms of life that we observe. It is comparatively easy to study such biotic interactions among living organisms, but more challenging to investigate such relationships when the organisms involved are dead or their species extinct. We discuss how paleobiologists have studied biotic interactions in the last 50 years, then suggest new avenues of research we could continue to fruitfully explore.
Introduction
There has been a historical tension in paleobiology with regard to the dominance of biotic versus abiotic forces in contributing to macroevolutionary patterns and processes (Vermeij Reference Vermeij1994; Barnosky Reference Barnosky2001; Jablonski Reference Jablonski2008; Benton Reference Benton2009). This academic duality, in retrospect, was a fruitful one, as it steered the field toward a more nuanced view of how interactions among organisms, environmental change, phylogenetic constraints, and the interplay of all three might lead to the macroevolutionary patterns that we infer (Jablonski Reference Jablonski2008; Voje et al. Reference Voje, Holen, Liow and Stenseth2015). There is no doubt that many biotic interactions, be they positive (mutualisms, symbioses) or negative (competition, predation, diseases), have consequences on the survival and reproduction of the organisms involved. This is despite the acceptance that it is not always straightforward to recognize biotic interactions and to understand their downstream effects, even among living organisms (Connell Reference Connell1983, Reference Connell, Grace and Tilman1990). Specific biotic interactions may have minimal consequences when averaged over the life spans of those individuals involved or may have huge impacts. Regardless of their impacts, biotic interactions are current and historical processes that contribute to the biological diversity we observe in the fossil record and in living, contemporary communities when we study macroevolution. In this contribution for the celebration of Paleobiology’s 50th anniversary, we share our views on the way forward for further understanding how biotic interactions might influence macroevolutionary patterns and processes.
Paleobiology and its associated scientific community set the stage for our understanding of taxonomic diversity over geological timescales (Van Valen Reference Van Valen1973; Raup Reference Raup1978; Raup and Sepkoski Reference Raup and Sepkoski1982). Prominently, Sepkoski’s models demonstrated that some temporal diversity patterns are consistent with interclade competitive processes. While such patterns of what we could loosely term diversity dependence offer a window into plausible long-term biotic controls on diversity (Sepkoski Reference Sepkoski1978, Reference Sepkoski1981), studies of biotic interactions in deep time, many published in Paleobiology, have also been based on inferred direct interactions between individual fossil organisms. These interactions include competition (Stanley and Newman Reference Stanley and Newman1980; Lidgard et al. Reference Lidgard, McKinney and Taylor1993), predation (Gahn and Baumiller Reference Gahn and Baumiller2005; Bellwood et al. Reference Bellwood, Hoey, Bellwood and Goatley2014), including herbivory (Labandeira et al. Reference Labandeira, Dilcher, Davis and Wagner1994), parasitism (Baumiller Reference Baumiller1990; De Baets et al. Reference De Baets, Huntley, Scarponi, Klompmaker and Skawina2021), and mutualism, some of the most conspicuous cases being plant–pollinator interactions (Labandeira and Currano Reference Labandeira and Currano2013) and coral–zooxanthellae symbiosis (Coates and Jackson Reference Coates and Jackson1987; Tornabene et al. Reference Tornabene, Martindale, Wang and Schaller2017).
We begin by briefly discussing in three sections how paleobiologists have used the fossil record (1) to infer the effects of interspecific interactions on lineage diversification, (2) to understand changes in biogeographic distributions due to interspecific interactions, and (3) to study trait evolution as a result of interspecific interactions, focusing on topics that were given less attention in recent reviews on a similar theme (Hembry and Weber Reference Hembry and Weber2020; Bush and Payne Reference Bush and Payne2021; Fraser et al. Reference Fraser, Soul, Tóth, Balk, Eronen, Pineda-Munoz and Shupinski2021). We explicitly exclude intraspecific interactions, which can have important and detectable macroevolutionary consequences (Martins et al. Reference Martins, Puckett, Lockwood, Swaddle and Hunt2018), and processes more amenable to study using contemporary species, such as introgression (Baack and Rieseberg Reference Baack and Rieseberg2007). We do not attempt to thoroughly review the literature or critique specific methods that have been used in understanding biotic interactions and their consequences for macroevolution, but rather point to approaches we feel are more promising after brief summaries. Because the specifics of the approaches we promote will depend on how the questions are formulated and which empirical systems are studied, we do not suggest concrete investigative paths or protocols, but hope to stimulate discussion and novel research. After each of the three sections, we suggest fruitful venues that could continue naturally in the vein of the research that has already been done and highlight some key remaining questions. We try to be explicit about the hierarchical level of organization on which data and/or processes are focused on, both when discussing the literature and in suggesting new avenues of research (Fig. 1). All the levels illustrated in Figure 1 are relevant to the study of biotic interactions. Being clear and explicit in the hierarchical level of analyses and inference can help in integrating findings from diverse approaches and aids us in examining our assumptions surrounding the evidence for past interactions between two organisms and any detectable consequences for evolution. Then we turn to newer or rarer approaches, particularly those that “explicitly model species interactions and connect them to macroevolutionary patterns” (Harmon et al. Reference Harmon, Andreazzi, Débarre, Drury, Goldberg, Martins and Melián2019: p. 179). Ending with a list of general recommendations, we call for cross-disciplinary, integrative approaches in studying past biotic interactions. It is our hope to inspire another fun-filled half century of collaborative research harnessing the strength of the fossil record to answer questions on evolution and biodiversity.
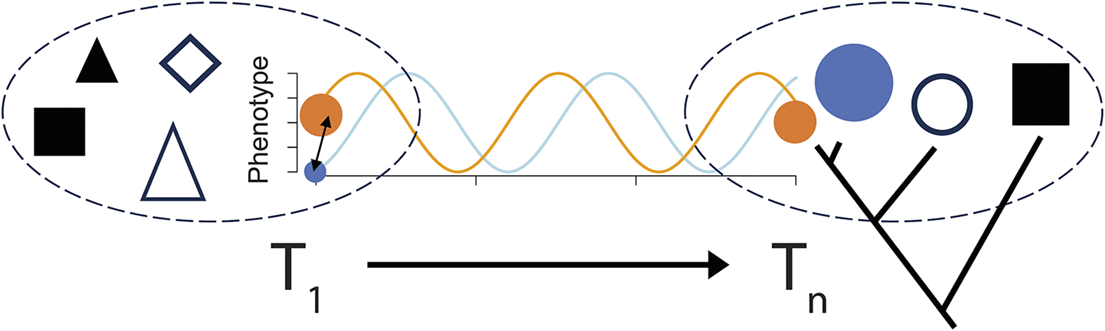
A temporal, hierarchical view of the context of interspecific biotic interactions. We illustrate two temporal, evolutionarily continuous communities (delimited by dashed ovals) observed in two separate time intervals T 1 and Tn with some shared species represented by shapes and colors. The size of the shapes indicates phenotype (or abundance). The temporal instances between the snapshots of the communities at T 1 and Tn are not preserved and hence not observable. Two of these species (orange and blue circles) are illustrated as directly interacting with each other, where their phenotypes (or abundance) cyclically change as a consequence of their interactions (indicated by an arrow between them in T 1). In Tn, we include a phylogenetic hypothesis that links the illustrated species, where the three circle-shaped species are more closely related, to indicate that phylogenetic/clade-level approaches have also been used in inferring biotic interactions and their consequences. While both the orange and blue species are extant in T 1 and Tn, some other species have turned over, indicating that diffuse biotic interactions may be changing with respect to the two focal species. The levels of biological hierarchy directly illustrated in this figure include temporal populations (of the orange and blue species), the communities they have found themselves, and the clade they are part of (only drawn in Tn). Although individuals of the blue and orange species are not figured, it is implicit that the biotic interactions are between such individuals.
Species Interactions and Lineage Diversification
Most paleobiological work devoted to investigating the effect of species interactions on diversification dynamics has focused on interspecific competition (Van Valen Reference Van Valen1973; Sepkoski Reference Sepkoski1978, Reference Sepkoski, Jablonski, Erwin and Lipps1996) and predation (Vermeij Reference Vermeij1987; Dietl and Kelley Reference Dietl and Kelley2002; Huntley and Kowalewski Reference Huntley and Kowalewski2007; Stanley Reference Stanley2008). A common and superficially straightforward approach is to match a diversification scenario in which interspecific interactions could have contributed substantially to temporal diversity patterns. For instance, interspecific competition is implied in equilibrium diversity, where the number of species reach a stable limit (Sepkoski Reference Sepkoski1978) or where the increase in diversity slows down due to diversity-dependent dynamics (Rabosky Reference Rabosky2013; Moen and Morlon Reference Moen and Morlon2014; Foote et al. Reference Foote, Edie and Jablonski2024). The underlying assumption here is that limited resources cause speciation rates to decrease and/or promote an increase in extinction rates as new species enter the system and ecological opportunities are exploited (Sepkoski Reference Sepkoski1978; Walker and Valentine Reference Walker and Valentine1984; Schluter Reference Schluter2000; Moen and Morlon Reference Moen and Morlon2014). Similarly, Van Valen’s Red Queen hypothesis is motivated by the pattern of age-independent extinction that he argued is consistent with interspecific competition and evolution (Van Valen Reference Van Valen1973). Likewise, the so-called double-wedge diversity pattern that manifests as a temporally coincident rise and decline in taxonomic richness of two potentially competitor clades has been used to argue for plausible role of interspecific competition on driving speciation and extinction dynamics (Krause Reference Krause1986; Sepkoski Reference Sepkoski, Jablonski, Erwin and Lipps1996; Van Valkenburgh Reference Van Valkenburgh1999). Comparisons of prey (and predator) temporal diversity changes and proxies of predation rates have also been presented to argue the case for negative biotic interactions being drivers of diversity (Huntley and Kowalewski Reference Huntley and Kowalewski2007; Gorzelak et al. Reference Gorzelak, Salamon and Baumiller2012; Klompmaker et al. Reference Klompmaker, Kowalewski, Huntley and Finnegan2017). In later studies, estimates of speciation and extinction rates, rather than taxonomic diversity, were used to infer diversity-dependent or competition-associated diversification dynamics both within (Alroy Reference Alroy1996, Reference Alroy, Butlin, Bridle and Schluter2009) and between clades (Liow et al. Reference Liow, Reitan and Harnik2015; Silvestro et al. Reference Silvestro, Antonelli, Salamin and Quental2015). Phylogenetic and functional diversity has also been used to investigate the signatures of interspecific competition and diversity saturation in local communities (Fraser and Lyons Reference Fraser and Lyons2020). Several of the cited papers used genus- or higher taxonomic-level data to study clade- and/or community-level dynamics but imply some form of individual-level interactions via resource competition (at the same trophic level) or predation (across trophic levels).
Consider Spatial Overlap and Interactions in Life
While the fossil record is irreplaceable for its direct temporal evidence of how diversity changes through time (Quental and Marshall Reference Quental and Marshall2010; Benton Reference Benton2015; Benson et al. Reference Benson, Butler, Close, Saupe and Rabosky2021), there is usually little direct evidence of how species interact ecologically, nor are there data explicitly collected in the majority of Phanerozoic-scale paleontological studies to robustly estimate spatial and resource-use overlap between purported interactors. Studies done at broad spatial scales (i.e., globally or regionally; Gould and Calloway Reference Gould and Calloway1980; Alroy Reference Alroy1996, Reference Alroy, Butlin, Bridle and Schluter2009; Liow et al. Reference Liow, Reitan and Harnik2015; Silvestro et al. Reference Silvestro, Antonelli, Salamin and Quental2015) often do not explicitly verify the interactions implied. Some paleontological studies rely on a priori assumptions of relevant niche overlap, typically based on ecomorphological inferences and/or on the ecology of extant relatives (Van Valkenburgh Reference Van Valkenburgh1995; Nascimento et al. Reference Nascimento, Blanco, Domingo, Cantalapiedra and Pires2024). Therefore, it is the initial choice of the species pool (e.g., species within a clade or species of different clades), usually based on natural history knowledge (Van Valkenburgh Reference Van Valkenburgh1999; Nascimento et al. Reference Nascimento, Blanco, Domingo, Cantalapiedra and Pires2024), that defines the ecological arena where interactions are thought to be relevant and where we might expect to see changes in diversity or diversification rates. Because the fossil record is strongly unevenly distributed over space (Allison and Briggs Reference Allison and Briggs1993; McGowan and Smith Reference McGowan and Smith2008; Vilhena and Smith Reference Vilhena and Smith2013; Close et al. Reference Close, Benson, Alroy, Carrano, Cleary, Dunne and Mannion2020), and because some key ecological mechanisms (including biotic interactions) that control biodiversity change or operate at more local scales, spatial (Benson et al. Reference Benson, Butler, Close, Saupe and Rabosky2021) and more direct ecological (Liow et al. Reference Liow, Di Martino, Voje, Rust and Taylor2016) information should be explicitly incorporated in these diversity and diversification analyses where possible (see “Newer Avenues”). Some studies are more explicit about individual-level biotic interactions and their underlying mechanisms at local scales (e.g., Baumiller Reference Baumiller1990; Robins and Klompmaker Reference Robins and Klompmaker2019), even when evaluating diversification dynamics over larger geographic areas (Lupia et al. Reference Lupia, Lidgard and Crane1999; Lidgard et al. Reference Lidgard, Di Martino, Zagorsek and Liow2021; Toivonen et al. Reference Toivonen, Fortelius and Žliobaitė2022), and we encourage more of those. There should also be more studies that systematically explore the relationship between spatial overlap and potential interactions, including the extreme case of competitive exclusion (e.g., Klompmaker and Finnegan Reference Klompmaker and Finnegan2018).
Consider the Changing Intensity of Interactions Experienced by Species
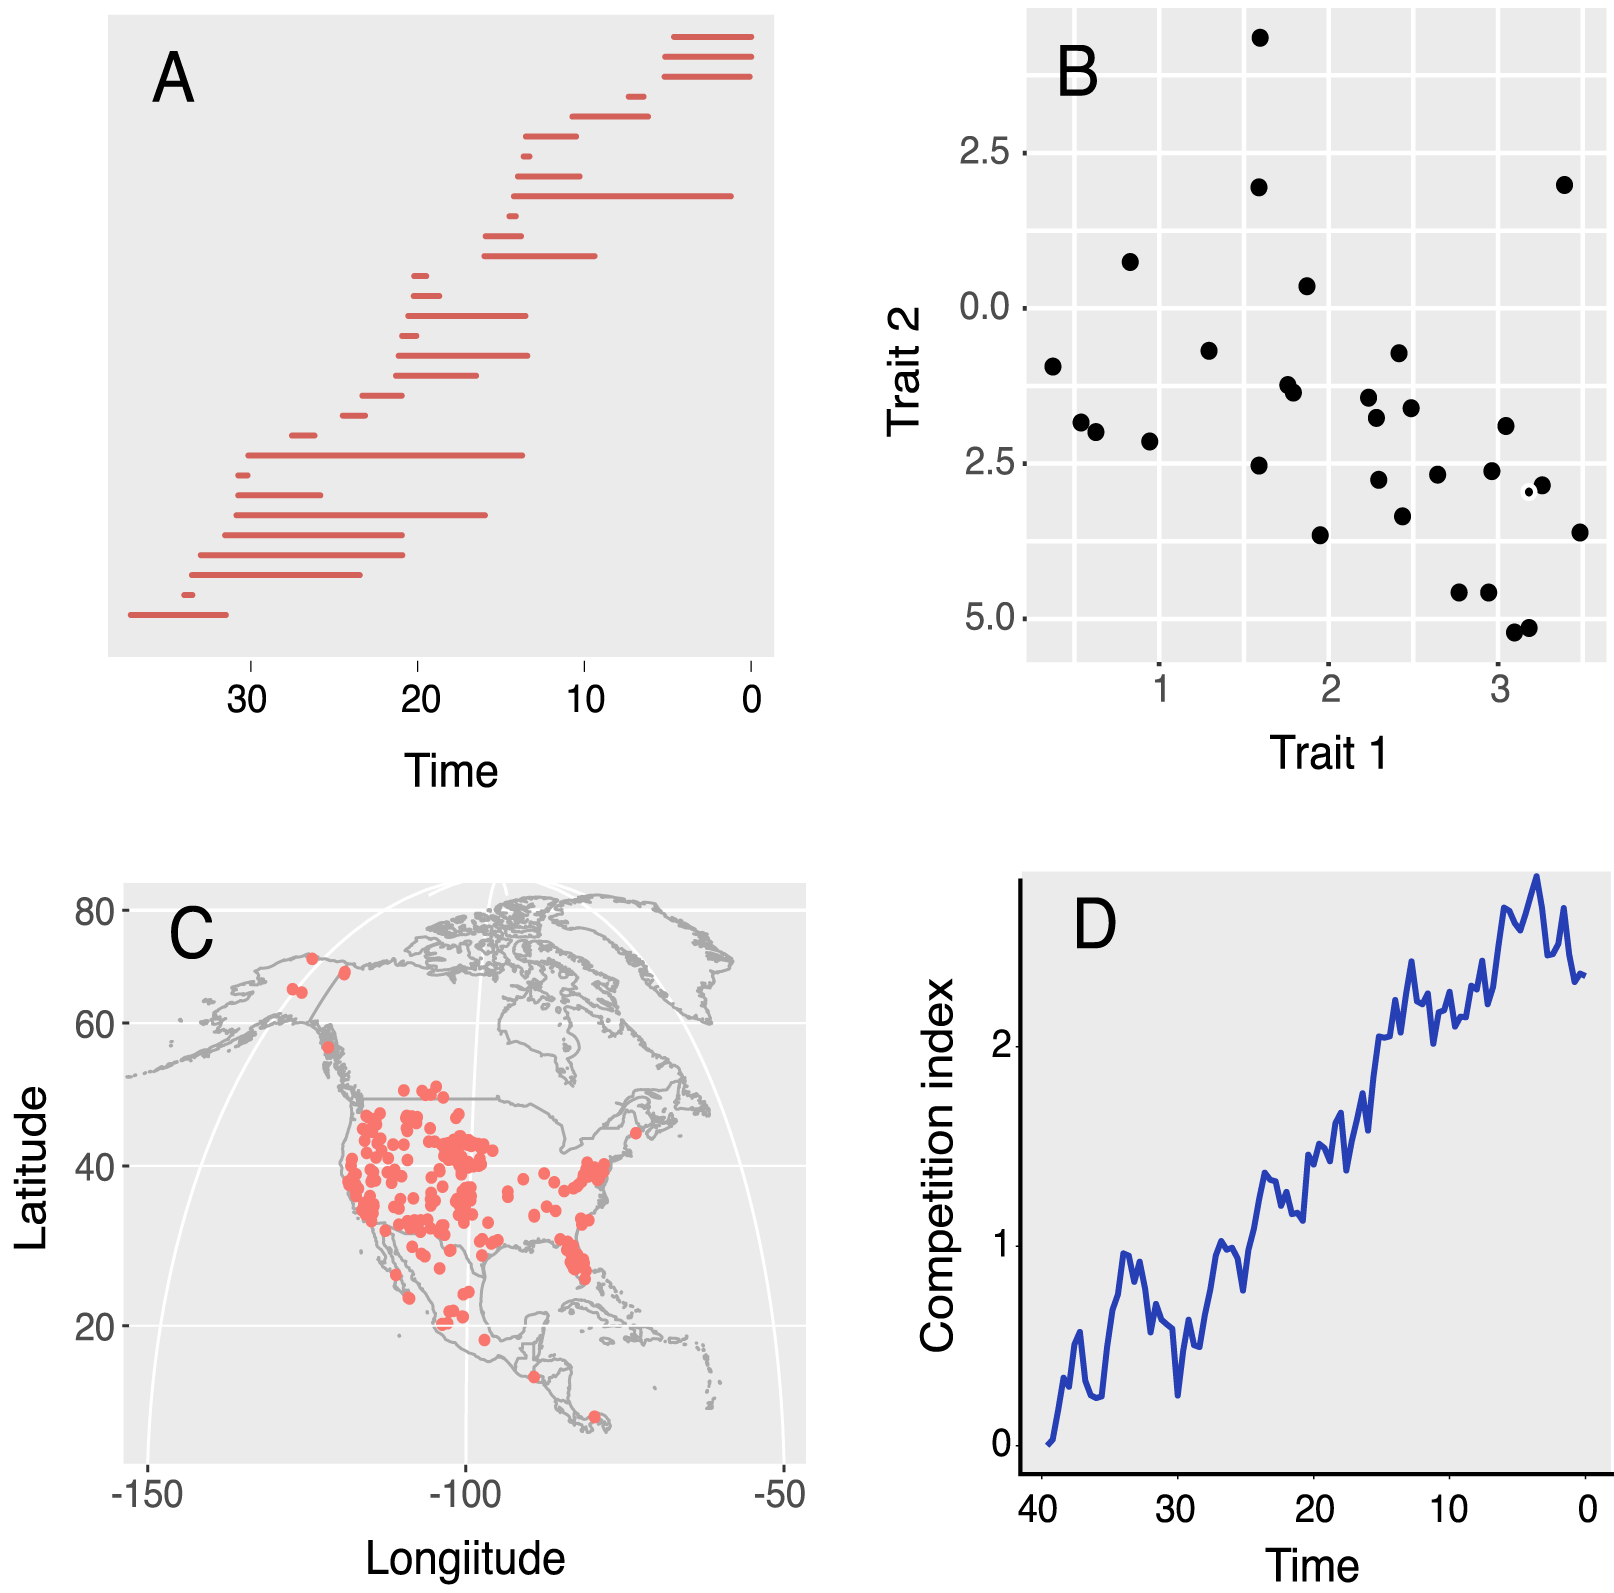
A population or a species may be exposed to different important interactors through its evolutionary lifespan (Fig. 1). Capturing the changing composition (Fig. 2), and intensity of combined interspecific competition experienced through the evolutionary history of an individual lineage (e.g., a species) can give more information on ecological and evolutionary processes (Graciotti et al. Reference Graciotti, Porto and Quental2023). Graciotti et al. (Reference Graciotti, Porto and Quental2023) characterized potentially shared ecological resources among temporally and spatially overlapping species (Fig. 2A) in the Canidae using similarity in tooth morphology and body size (Fig. 2B), spatial overlap (Fig. 2C), or the lack thereof due to competitive exclusion (Hardin Reference Hardin1960), with the aim of quantifying the average changing intensity of biotic interactions for species within a given clade (Fig. 2D). Although measuring ecological and spatial overlap per se is not new (Pineda-Munoz et al. Reference Pineda-Munoz, Jukar, Tóth, Fraser, Du, Barr and Amatangelo2021; Christison et al. Reference Christison, Gaidies, Pineda-Munoz, Evans, Gilbert and Fraser2022), such measurements can be used to explicitly investigate whether substantial increase in temporal, spatial, and/or ecological intersections among species are associated with changes in speciation and extinction regimes (Graciotti et al. Reference Graciotti, Porto and Quental2023).
The changing intensity of interspecific interactions experienced by species within a given clade. A, Estimates of species longevities allow one to estimate temporal coexistence among species within a given region. B, Morphospace characterization allows one to estimate the distance (similarity) of species within a region. C, The geographic coordinates of fossil specimens allow one to estimate the spatial overlap among different species. D, A time series (competition index) that takes into account temporal, spatial, and morphological overlap is built to describe the average intensity of competition among species within a given clade. Here, smaller distances among species represent a more “crowded” scenario and hence higher intensity of competition.
Consider Trait-based Diversification Models
It is increasingly common to apply trait-dependent diversification models, commonly known as state-dependent speciation and extinction (SSE) models (Maddison et al. Reference Maddison, Midford and Otto2007; FitzJohn Reference FitzJohn2010, Reference FitzJohn2012) to comparative data given the increasing availability of larger phylogenies. Here, phenotypic and behavioral traits can be used as proxies for specific biotic interactions, making it possible to investigate whether biotic interactions are associated with different diversification regimes (Gómez and Verdú Reference Gómez and Verdú2012; Foisy et al. Reference Foisy, Albert, Hughes and Weber2019). For example, by characterizing plant species with respect to the presence or absence of traits that allow them to engage in mutualistic interaction with ants, it has been demonstrated that plant lineages in mutualistic relationships with ants have higher diversification rates (Weber and Agrawal Reference Weber and Agrawal2014). In the same vein, how plant defenses affect diversification regimes has also been studied (Foisy et al. Reference Foisy, Albert, Hughes and Weber2019). The effect of different diets on diversification regimes, where taxa with more omnivorous diets have lower diversification rates, possibly due to lower speciation rates rather than lower extinction rates (Price et al. Reference Price, Hopkins, Smith and Roth2012; Burin et al. Reference Burin, Kissling, Guimarães, Şekercioğlu and Quental2016), can also be investigated in the fossil record, for instance, in mammals (Jernvall and Fortelius Reference Jernvall and Fortelius2004).
While many of the empirical examples cited stem from extant lineages, it is highly feasible to apply similar trait-dependent diversification models (Porto et al. Reference Porto, Maestri, Janzen and Etienne2023) on the phylogenies of extinct taxa (Wright et al. Reference Wright, Bapst, Barido-Sottani and Warnock2022) or, in the absence of phylogenies, by using traits as covariates in commonly used diversification rate models that are phylogeny-free (Liow and Nichols Reference Liow, Nichols, Hunt and Alroy2010; Silvestro et al. Reference Silvestro, Salamin and Schnitzler2014; Warnock et al. Reference Warnock, Heath and Stadler2020).
Open Questions in Species Interactions and Lineage Diversification
Many questions remain to be answered, for instance: Do regional patterns and lower spatial scale processes simply scale-up to global levels, hence allowing us to detect global signals? In other words, what are the mechanisms that allow local ecological processes to cascade to macroevolutionary rates? Do interspecific biotic interactions have a major role in maintaining biological diversity? Are there circumstances under which ecological processes quantified as “strong” on short timescales will be erased over macroevolutionary timescales? How do abiotic variables interact with ecological interactions to influence lineage diversification rates? Can we build trait-dependent models to infer the role of species interactions where the trait itself (and hence the description of how a species interacts with other species) changes through time? Are the macroevolutionary effects of species interactions predictable from their ecological effects on individual survival or population dynamics (sensu Jablonski Reference Jablonski2008; Zeng and Wiens Reference Zeng and Wiens2021)?
Species Interactions and Biogeographic Dynamics
Interactions among species can influence the biogeographic distribution of whole clades by causing them to go extinct in some regions or by preventing them from entering others (Pires et al. Reference Pires, Silvestro and Quental2015, Reference Pires, Silvestro and Quental2017; Silvestro et al. Reference Silvestro, Antonelli, Salamin and Quental2015; Cantalapiedra et al. Reference Cantalapiedra, Prado, Fernández and Alberdi2017; Stigall Reference Stigall2019). Dispersals into new regions range from ephemeral invasions of a single lineage to a restricted region to the synchronous invasions of multiple lineages at a global scale (Stigall Reference Stigall2019). Such dispersals might produce no noticeable changes in biodiversity structure at the local scale (Fraser and Lyons Reference Fraser and Lyons2020) but at the other extreme may result in faunal homogenization and biotic crisis at a global scale (Stigall Reference Stigall2019). Even though the preservation of fossils is spatially heterogeneous (Benson et al. Reference Benson, Butler, Close, Saupe and Rabosky2021), the fossil record is the only direct information on the past geographic distribution of species. Relying only on extant species for historical biogeographic inferences can be misleading (Lieberman Reference Lieberman2002; Wisniewski et al. Reference Wisniewski, Lloyd and Slater2022). Previous paleontological studies have shown how different regions exchanged lineages over time (Marshall et al. Reference Marshall, Webb, Sepkoski and Raup1982; Webb Reference Webb1991; Webb and Opdyke Reference Webb and Opdyke1995; Woodburne Reference Woodburne2010), how continental isolation resulted in unique faunas (Simpson Reference Simpson1980), how immigration of new lineages changed community structure (Patzkowsky and Holland Reference Patzkowsky and Holland2007), and how the arrival of novel lineages into new regions might have affected the diversification dynamics of both the newcomers and the residents through ecological interactions (Silvestro et al. Reference Silvestro, Antonelli, Salamin and Quental2015; Pires et al. Reference Pires, Silvestro and Quental2017; Stigall Reference Stigall2019).
In the terrestrial realm, for instance, it has been suggested that the -Great American Biotic Exchange was strongly influenced by predation (Faurby and Svenning Reference Faurby and Svenning2016), using arguments supported by phenotypic and behavioral traits. Here, successful mammal dispersal from South American into North America is associated with larger body size and arboreality, and presumably lower predation risks. In the marine realm, the “great Devonian interchange” is a well-documented event of biotic exchange (McGhee Reference McGhee1996; Rode and Lieberman Reference Rode and Lieberman2004; Stigall Reference Stigall2010, Reference Stigall2012, Reference Stigall2019) that could be further studied using model-based inference from a species interaction point of view (see sections “Modeling Immigration, Emigration, and Regional Extinction” and “Integrate Trait and Biogeographic Evolution”.).
Interspecific interactions have been suggested as the underlying reason for clade replacement or the incumbency of resident species among different biogeographic regions, largely based on indirect evidence, including temporal patterns of waxing and waning in the taxonomic richness of different clades, or from fits to diversity-dependent models (Webb Reference Webb1976; Marshall et al. Reference Marshall, Webb, Sepkoski and Raup1982; Silvestro et al. Reference Silvestro, Antonelli, Salamin and Quental2015; Pires et al. Reference Pires, Silvestro and Quental2017). However, some morphological and temporal analyses of fossil data have found no evidence for the role of species interactions in patterns suggesting clade–clade competition. For example, the “replacement” of Sparassodonta (a South American lineage of carnivorous marsupials) has been interpreted to result from the immigration of carnivores belonging to the placental order Carnivora, suggesting that the negative interaction between these predators caused the extinction of Sparassodonta. Yet the environmental changes due to the Andean uplift and changes in temperature and sea level, as well as changes in their prey diversity better explain the decline in Sparassodonta, than biotic interactions with their putative placental competitors as shown using model-based analysis, including diversity-dependent models (Pino et al. Reference Pino, Vallejos-Garrido, Espinoza-Aravena, Cooper, Silvestro, Hernández and Rodríguez-Serrano2022; Tarquini et al. Reference Tarquini, Ladevèze and Prevosti2022). Moreover, there is no evidence of substantial temporal overlap of ecomorphological similar species among Carnivora and Sparassodonta, suggesting that the later invasion by large predators such as felids and canids represent the occupation of ecological roles left empty by the extinction of Sparassodonta (Prevosti et al. Reference Prevosti, Forasiepi and Zimicz2013; Pino et al. Reference Pino, Vallejos-Garrido, Espinoza-Aravena, Cooper, Silvestro, Hernández and Rodríguez-Serrano2022; Tarquini et al. Reference Tarquini, Ladevèze and Prevosti2022). Yet, in all these studies, while patterns are observed at the community level (dashed ovals in Fig. 1) and/or at clade level, the processes implied are at the level of individuals.
Modeling Immigration, Emigration, and Regional Extinction
The Sparassodonta/Carnivora case exemplifies the importance of considering ecological information and model-based approaches when studying biogeographic dynamics using fossil data (Silvestro et al. Reference Silvestro, Zizka, Bacon, Cascales-Minana, Salamin and Alexander2016). Dispersal, extinction, and fossil sampling rates can be jointly estimated, while simultaneously examining the potential roles of phenotypic trait changes or external time series such as temperature via covariate modeling (Silvestro et al. Reference Silvestro, Zizka, Bacon, Cascales-Minana, Salamin and Alexander2016). One can allow diversity-dependent immigration and extinction rates and build models in which the immigration of lineages to a new region is associated with higher extinction rates of resident lineages or with a given trait (Hauffe et al. Reference Hauffe, Pires, Quental, Wilke and Silvestro2022). An empirical application of such biogeographic models found higher immigration rates with increased body size for carnivorous mammals that moved between North America and Eurasia (Hauffe et al. Reference Hauffe, Pires, Quental, Wilke and Silvestro2022). There are many ways to expand on the abovementioned and other biogeographically explicit models (see Sukumaran and Knowles Reference Sukumaran and Knowles2017 and references therein), for instance, by considering the ecological similarity or functional overlap between invaders and residents or by allowing for the explicit interaction between biotic (e.g., phenotypic traits that are demonstrably linked to ecological interactions) and abiotic environmental factors to dictate immigration and extinction dynamics. By building models that estimate comparable parameters, we might be able to start seeing commonalities among known invasions or biotic exchange, for example, the great American biotic exchange and great Devonian interchange mentioned earlier, among others (Roy Reference Roy1996; Patzkowsky and Holland Reference Patzkowsky and Holland2007).
Integrate Trait and Biogeographic Evolution
Quintero and Landis (Reference Quintero and Landis2020) presented a phylogenetic model wherein trait and geographic evolution affect each other by expanding on a model wherein the traits in a set of lineages depend on the traits of other (interacting) lineages (Nuismer and Harmon Reference Nuismer and Harmon2015). This allows for a more coherent view of how species interactions might influence both traits and dispersal and therefore how such interactions mediate species and functional diversity in different regions. As Quintero and Landis (Reference Quintero and Landis2020) admitted, their implementation does not include extinct species and their interactions. We could take advantage of being able to infer past spatial distributions and the changing occupation of morpho(eco)-space more directly using the fossil record when building such biogeographic models, with or without explicit topological information from phylogenies. Species distribution models, used with both fossil and contemporary data, are also crucial to projecting future climate impacts, including range shifts and extinction risk, and should include biotic interactions for better inferences (Cosentino et al. Reference Cosentino, Seamark, Van Cakenberghe and Maiorano2023; Franklin Reference Franklin2023).
Include Biotic Interactions in Niche Modeling
The latitudinal diversity gradient (LDG) is a phenomenon well-documented in both contemporary species and in the fossil record (Fraser et al. Reference Fraser, Hassall, Gorelick and Rybczynski2014; Mannion et al. Reference Mannion, Upchurch, Benson and Goswami2014; Marcot et al. Reference Marcot, Fox and Niebuhr2016; Jablonski et al. Reference Jablonski, Huang, Roy and Valentine2017; Saupe Reference Saupe2023) with standing hypotheses that the LDG could be at least in part driven by the intensity of biotic interactions (Schemske et al. Reference Schemske, Mittelbach, Cornell, Sobel and Roy2009). Yet niche modeling, commonly pursued in paleobiology also when considering LDGs (Saupe et al. Reference Saupe, Myers, Peterson, Soberón, Singarayer, Valdes and Qiao2019), seldom explicitly considers species interactions. Because species interactions, rather than just dispersal limits or environmental constraints, can limit geographic range expansion over evolutionary time (Pigot and Tobias Reference Pigot and Tobias2013), it will be fruitful to explicitly include species interactions when modeling niches to study the changing distribution of species, whether in an LDG context or beyond.
Open Questions in Species Interactions and Biogeographic Dynamics
What are the relative contributions of species interactions (versus abiotic niche or climate shifts) to successful dispersal and survival of residents in the face of invaders? Are “exchanges” and “invasions” predictable, given the potential invaders and residents and their traits, or given the spatial or environmental backdrop of such biogeographic dynamics? Are certain types of interactions (e.g., mutualisms, predation, or disease) more prevalent in restricting or permitting such dynamics? Are biogeographic processes dictated by biotic interactions different in the marine versus terrestrial realm? How do we incorporate information on interactions between individuals into biogeographic analyses?
Species Interactions and Trait Evolution
Vermeij argued that interspecific enemies are the most important agents of evolution on geological timescales, where morphological traits pertaining to negative interactions are key inferential data (Vermeij Reference Vermeij1987, Reference Vermeij1994). Escalation, the evolution of functional traits to counter increasing pressure from predators and competitors, is thought to have promoted the “Mesozoic marine revolution” (Vermeij Reference Vermeij1977), a restructuring of the functional ecology of especially the benthic realm, accompanied by the origination and decline of different groups. Evidence for (Aberhan et al. Reference Aberhan, Kiessling and Fürsich2006; Sallan et al. Reference Sallan, Kammer, Ausich and Cook2011) and against escalation (Madin et al. Reference Madin, Alroy, Aberhan, Fursich, Kiessling, Kosnik and Wagner2006) as a driving force in diversity changes has been presented, although traits relevant for the implied interactions are seldom the focus of such analyses. Lindberg and Pyenson (Reference Lindberg and Pyenson2007) argued that echolocation in early whales (implied by acoustically isolated fossil ear bones) could have been an adaptation for feeding on cephalopods, and they used a combination of temporal, geographic, and depth distribution data to test their idea (see also Kiel et al. Reference Kiel, Goedert and Tsai2022). A rare example with a trait focus is a recent study of body-size evolution in lagomorphs (Tomiya and Miller Reference Tomiya and Miller2021). Here, lagomorphs were found to be morphologically constrained by other distantly related herbivores that co-occurred and used similar resources.
Competition can occur across unrelated species (e.g., Tomiya and Miller Reference Tomiya and Miller2021), among individuals of the same species, or among closely related species (e.g., Meachen and Samuels Reference Meachen and Samuels2012). Trait changes that occur as a consequence of interspecific interactions among closely related species were termed “character displacement” (and its converse, “character release”) in a seminal paper by Brown and Wilson (Reference Brown and Wilson1956), a topic heavily researched among contemporary species. Such evolutionary trait changes attributable to competition and predation, while more easily demonstrated in contemporary species (Grant and Grant Reference Grant and Grant2006), have also been demonstrated in scattered studies using the fossil record (Schindel and Gould Reference Schindel and Gould1977; Meachen and Samuels Reference Meachen and Samuels2012). One particularly satisfying example fulfilling the criteria set up by Schluter and McPhail (Reference Schluter and McPhail1992) to identify character release is a scenario in which a relaxation of competitive pressure from a close relative due to the latter’s extinction demonstrably led to morphological changes in the surviving Montastraea corals (Pandolfi et al. Reference Pandolfi, Lovelock and Budd2002). The concept of character displacement have also been applied in clade-wide patterns of trait evolution that could arguably have resulted from clade-level competition (Benson et al. Reference Benson, Frigot, Goswami, Andres and Butler2014).
Pursuing More Fossil Studies of Character Displacement
There are few fossil studies as detailed and stringent as the one on Montastraea (Pandolfi et al. Reference Pandolfi, Lovelock and Budd2002), and without similar studies in different ecosystems and taxa, generalities in the relationship between trait evolution and biotic interactions may be difficult to uncover. It is perhaps challenging to fulfill criteria including co-existence, ruling out environmental drivers of phenotypic change, and associating phenotypic change with resource shifts (Schluter and McPhail Reference Schluter and McPhail1992), among others, when studying species in the fossil record, which Pandolfi et al. (Reference Pandolfi, Lovelock and Budd2002) achieved for their system. However, benthic systems in which sessile congeneric species (including corals, bryozoans, sponges, and bivalves, all of which are preserved in the fossil record) potentially co-occur could be good candidates for generating more case studies.
Focusing on Morphological Traits with Clear Implications for Biotic Interactions
Some commonly studied fossil traits like mammal teeth are gateways to understanding biotic interactions, because they reflect the types of plants and/or animal prey the organism is ingesting (Van Valkenburgh Reference Van Valkenburgh1995; Fortelius and Solounias Reference Fortelius and Solounias2000; Pineda-Munoz et al. Reference Pineda-Munoz, Lazagabaster, Alroy and Evans2017; Hopkins et al. Reference Hopkins, Price and Chiono2022). For instance, Slater (Reference Slater2015) studied the “relative lower grinding area” that exhibits distinctly different values in hyper- through hypocarnivorous canids in the context of ecological opportunity and interspecies competition. There is also a vast literature on vegetation/climate change and herbivore tooth evolution (MacFadden Reference MacFadden2000; Mihlbachler et al. Reference Mihlbachler, Rivals, Solounias and Semprebon2011; Strömberg et al. Reference Strömberg, Dunn, Madden, Kohn and Carlini2013; Toljagić et al. Reference Toljagić, Voje, Matschiner, Liow and Hansen2017). One natural expansion of these types of studies is to examine a phenotypic time series of an aspect of morphology that is demonstrably related to an “interactor” for single lineages with the main aim of estimating how much influence the interactor has on the morphology of the focal lineage. Dietary information can also be attained in the form of stable isotopes to answer different ecological questions (West et al. Reference West, Bowen, Cerling and Ehleringer2006; Clementz Reference Clementz2012), including the study of resource partitioning (MacFadden et al. Reference MacFadden, Higgins, Clementz and Jones2004; Domingo et al. Reference Domingo, Domingo, Badgley, Sanisidro and Morales2013; Hassler et al. Reference Hassler, Martin, Amiot, Tacail, Godet, Allain and Balter2018). Independent sources of phenotypic information such as stable isotopes and morphology can complement each other to better characterize the interspecific interactions of extinct species.
Open Questions in Species Interactions and Trait Evolution
Are traits better explained by constraints (developmental, genetic, geometric, phylogenetic), biotic interactions, the abiotic environment, their interactions, or some combination of these, and on what timescales? Do negative interactions (like predation) matter more than positive ones (like mutualism) for trait evolution, and on what timescales? How often are important biotic interaction traits not morphological ones (e.g., chemical defenses) or unpreserved (soft tissue), and do we have ways of inferring them using contemporary analogues or other signatures left in the fossil record or on inferred phylogenies? How can diverse sources of information (e.g., morphological and isotopic) be combined to better study biotic interactions in deep time?
Newer Avenues
In the previous sections, we described some natural directions, based on the more recent literature, in which to extend our research into realms of more nuanced understanding of the consequences of biotic interactions for diversification, biogeographic distributions, and trait evolution. In the following sections, we highlight and expand on these and more avenues that we feel are potentially fruitful.
Estimate Changing Biotic Interactions Perceived by Focal Lineages as They Age
Paleobiologists are in a particularly good position to study if and how the changing composition of species interactions might modulate rates of speciation and extinction rates. Using the fossil record, we could more directly characterize how individual species interact with other species since its time of origin until it goes extinct. This approach would represent a natural extension to the approach proposed by Graciotti et al. (Reference Graciotti, Porto and Quental2023). Instead of estimating an average “competition index” for a pool of species, we could estimate a competition index for each species individually, akin to what has been done for measuring niche overlap and partitioning for contemporary species (Lovari et al. Reference Lovari, Pokheral, Jnawali, Fusani and Ferretti2015), but with one very important difference: temporal information. Here, the trait is viewed as dynamic over the evolutionary life span of each individual species. Under this approach, the intensity of competition for each individual species can vary differently as new species are added to the system (Fig. 3), where the fossil record can help to estimate times of origination and extinction for individual species. While methodological development will be needed (such as building a trait-dependent process model, e.g., using stochastic differential equations (SDEs); see Reitan and Liow Reference Reitan and Liow2019), this seems a plausible way forward (Kelley et al. Reference Kelley, Dietl and Handley2024). This type of approach could also be adapted to evaluate the effect of predation on species extinction probability, by estimating the temporal and spatial overlap between each species and its putative predators.
Illustration of how to consider the effect of competition on individual species. A, Species longevities displaying the focal species (longevity shown in red) and the other species with which the focal species coexists in space and time (longevities shown in blue). B, The resulting hypothetical index of competition, showing how the “crowding effect” (as measured by temporal, spatial, and ecomorphological overlap) felt by the focal species (red) increases as it “ages” through time. The competition index could be estimated by measuring the temporal, spatial, and niche overlaps for each species individually in a similar manner, as presented in Fig. 2. The main difference is that here the temporal, spatial, and ecomorphological similarities are measured with respect to a single focal species.

Link Short-Term Ecological Processes to the Long-Term Patterns
There is evidence that competition among species of planktonic foraminifera affected macroevolutionary patterns (Ezard et al. Reference Ezard, Aze, Pearson and Purvis2011), yet competition among individuals of different foraminiferal species does not seem to drive shorter-term population dynamics (Rillo et al. Reference Rillo, Sugawara, Cabella, Jonkers, Baranowski, Kučera and Ezard2019). This mismatch between levels/scales suggests new questions and analyses that can help shed light on the underlying processes of biotic interactions, trait and lineage evolution. Trade-offs between individual survival and reproduction, both of which have consequences for population growth, dispersal, and the invasion of new areas, are processes that are modulated by resource competition, predation, and disease, typifying the biotic interactions paleobiologists often study using fossils. Studies of inferred (fossil) population structure (Kurtén Reference Kurtén1958; Van Valen Reference Van Valen1963) shows us how to estimate population structure and infer reproduction and survival, the latter of which can also be modeled directly (e.g., using predation scar data; Budd and Mann Reference Budd and Mann2019). This can be combined with phenotypic time series and biotic interactions of the same species to understand how biotic interactions might influence longer-term processes. One example of such a study uses cheilostome bryozoans to investigate any detectable signal of spatial competition on the evolution of trait size within a lineage (Di Martino and Liow Reference Di Martino and Liow2021), given a signal of larger size is advantageous when encountering spatial competitors. In this example, individual colonies with smaller autozooids present higher fecundity, but the long-term trend in autozooid size evolution does not suggest a consistent decrease through geological time, suggesting that biotic interactions (and perhaps climatic factors such as temperature), might influence long-term evolutionary outcomes (Di Martino and Liow Reference Di Martino and Liow2021). In addition, studies of biotic interactions linked to macroevolutionary patterns often collate ecological characters at levels higher than the individual (Fig. 1). We suggest that it might be important to weigh the impact of any such biotic interactions by the size and density of the organisms involved (e.g., the abundance of parasites and competitors), rather than just the presence thereof. For example, in Figure 3, many species spatially and temporally overlap with the focal (red) species, but commonly or densely occurring interacting species may impact the focal species more than rarer ones, and the abundance of each species is likely to change through its lineage duration (Foote et al. Reference Foote, Crampton, Beu, Marshall, Cooper, Maxwell and Matcham2007; Liow et al. Reference Liow, Skaug, Ergon and Schweder2010). We also note that while some interactions are chronic (e.g., herbivory), others are rare but sometimes impose extreme demographic consequences (e.g., disease that causes rapid mortality).
Use Phylogenetic Approaches beyond Typical Trait-based Diversification Models
Some species interactions are easier to observe than others. Parasites are pervasive; there is no known organism where parasites are absent, and their evolutionary consequences are well studied in some groups (e.g., Wolbachia) (Werren et al. Reference Werren, Baldo and Clark2008). They are also postulated to drive adaptive radiations (Karvonen and Seehausen Reference Karvonen and Seehausen2012). The fossil record of hosts, which are often more “visible” than their parasites, provides information on the timing of host diversification, which in combination with other types of information (e.g., the phylogeny of parasites) can help us estimate the evolutionary history of interactors that may not leave as much of a record in rocks (Warnock and Engelstädter Reference Warnock, Engelstädter, De Baets and Huntley2021). Cophylogenetic models (Dismukes et al. Reference Dismukes, Braga, Hembry, Heath and Landis2022; Mulvey et al. Reference Mulvey, Warnock and De Baets2022) could help estimate the timings and rates of evolutionary changes that can be potentially attributed to biotic interactions, even when one of the partners is “invisible.” Hence, the combined use of fossil record and molecular phylogenies might help us better investigate types of interactions that are not easily studied when using either type of data alone.
Explore Theoretical Ecological Models Using Simulations
Ecological theory is rightly incorporated in studying the fossil record. For instance, as already mentioned, Sepkoski used growth models commonly used in population ecology to understand taxonomic diversification and interclade dynamics on the timescales of millions of years. Likewise, more recent studies use extended versions of island and historical biogeography models to investigate the potential role of biotic interactions (by assuming a carrying capacity and a diversity-dependent dynamics) in determining lineage dispersal and extinction rates (Hauffe et al. Reference Hauffe, Delicado, Etienne and Valente2020). Because paleoecological biotic interactions and communities are no different in their generating processes than contemporary ones, we should be seeing a greater use of established and/or promising ecological (and other biologically rooted) theories as conceptual frameworks for understanding expectations and deviations (Hubbell Reference Hubbell2005). One new example uses Hubbell’s neutral theory (Hubbell Reference Hubbell2001) to explore models of population growth and species survival, the latter which can be studied best in the fossil record (Saulsbury et al. Reference Saulsbury, Parins-Fukuchi, Wilson, Reitan and Liow2024). Although there is a body of work estimating past trophic networks within communities (Roopnarine et al. Reference Roopnarine, Angielczyk, Weik and Dineen2019; Shaw et al. Reference Shaw, Coco, Wootton, Daems, Gillreath-Brown, Swain and Dunne2021), inferring biotic interactions via proxies is not trivial (Morales-Castilla et al. Reference Morales-Castilla, Matias, Gravel and Araújo2015). A combination of modeling and simulations, whether at the level of populations and phenotypes (Yoder and Nuismer Reference Yoder and Nuismer2010) or individuals within networks (Maliet et al. Reference Maliet, Loeuille and Morlon2020), may be very helpful in interpreting past communities and inferring interactions among taxa. Even though there are difficult challenges of inference posed for contemporary (and past) communities (Morales-Castilla et al. Reference Morales-Castilla, Matias, Gravel and Araújo2015), some of these challenges are being gradually resolved (Pomeranz et al. Reference Pomeranz, Thompson, Poisot and Harding2019).
General Recommendations
Ditch the Dichotomy
Continued obsession in the dichotomous choice of trying to answer the question “is it climate or is it biotic interactions that drive diversity” is still commonplace in the literature. We advocate for including presumably important variables, both environmental and biotic, and for studying how environmental and biotic factors interact (Jablonski Reference Jablonski2008) when the aim is to understand the contributions of each to evolution (Ezard et al. Reference Ezard, Aze, Pearson and Purvis2011; Condamine et al. Reference Condamine, Romieu and Guinot2019), rather than just using a single purported class of drivers as an alternative hypothesis to test against a strawman null.
Distinguish Correlation versus Causation
Many studies still verbally interpret statistical associations (e.g., correlations, significant slopes) as causal relationships, but we argue that we should be mindful when talking about “drivers” when analyses are designed to demonstrate statistical associations rather than driven processes, and, when possible, use approaches that more directly establish causal connections (Hannisdal and Liow Reference Hannisdal and Liow2018). We should also explicitly consider unmeasured (aka hidden or latent) variables where reasonable (Reitan and Liow Reference Reitan and Liow2017; Boyko and Beaulieu Reference Boyko and Beaulieu2021), as the measured/analyzed factor or variable may not be the (direct or even indirect) underlying force behind the pattern.
Focus on Ecological Mechanisms
Diversity dependence and other approaches to study biotic interactions ultimately aim at understanding the macroevolutionary consequences of ecological processes happening at the level of the individual. Harnessing the limits of what is possible in the fossil record, we urge more effort on verifying purported ecological interactions using different lines of evidence beyond co-occurrence (Pandolfi et al. Reference Pandolfi, Lovelock and Budd2002; Tomiya and Miller Reference Tomiya and Miller2021) with focus on (individual) specimen-level information and/or devising time series that more closely depict the interaction (Graciotti et al. Reference Graciotti, Porto and Quental2023). Can we eliminate other factors (e.g., environmental shifts, sampling artifacts) and attribute evolutionary change to biotic interactions? What mechanisms at the ecological level are responsible for the downstream evolutionary changes? Biotic interactions inferred from the fossil record and their downstream consequences can be “ground-truthed” using living relatives or analogous systems based on laboratory or natural experiments.
Emphasize Model-based Inferences and Method Development
Model-based inferences in macroevolution (Harmon et al. Reference Harmon, Andreazzi, Débarre, Drury, Goldberg, Martins and Melián2019) and paleobiology are highly desirable, as these can not only help us test hypotheses but also give estimates of evolutionary, ecological, and observational parameters to advance understanding and help link empirical estimates in paleobiology to those in related fields. Much of paleontology is still descriptive, even though the descriptions are now more quantitative rather than verbal. A focus on method development, drawing strength from related but more established fields, rather than ad hoc (re)inventions can help paleobiology mature faster. For instance, Silvestro and colleagues build models that carefully consider speciation and extinction rates that are (more) equivalent to those estimated using birth–death processes with estimated genealogies (Silvestro et al. Reference Silvestro, Warnock, Gavryushkina and Stadler2018, Reference Silvestro, Salamin, Antonelli and Meyer2019). Similarly, statistical ecology is a well-established but rapidly developing field that has barely been harnessed in paleobiology (Nichols and Pollock Reference Nichols and Pollock1983; Reitan et al. Reference Reitan, Ergon and Liow2022; Smith et al. Reference Smith, Handley and Dietl2022). Formal time-series analyses are crucial for our historical field, but tidy tools developed in economics and finance need to be expanded to include unevenly spaced, complex data like the paleontological and geological data we work with (Hannisdal Reference Hannisdal2011; Hannisdal and Liow Reference Hannisdal and Liow2018; Reitan and Liow Reference Reitan and Liow2019).
Contribute Actively to Common, Integrative Goals
Sciences with greater maturity tend to have common goals and become more collaborative. Increasingly, macroevolutionary patterns and their potential drivers are inferred not just from the fossil record (Raup and Sepkoski Reference Raup and Sepkoski1982) or molecular phylogenies alone (Jetz et al. Reference Jetz, Thomas, Joy, Hartmann and Mooers2012) but using a combination of the two (Slater and Harmon Reference Slater and Harmon2013; Warnock and Engelstädter Reference Warnock, Engelstädter, De Baets and Huntley2021; Wright et al. Reference Wright, Bapst, Barido-Sottani and Warnock2022). Diverse data, including morphology, spatial distribution, ecology, environment, and biochemicals can all be used to model and/or constrain our inferences (Liow et al. Reference Liow, Uyeda and Hunt2023). It is time for paleobiology to become even more collaborative and coordinated. The Paleobiology Database serves us well for many purposes, but specimen-based interaction databases (Klompmaker et al. Reference Klompmaker, Kelley, Chattopadhyay, Clements, Huntley and Kowalewski2019; Petsios et al. Reference Petsios, Portell, Farrar, Tennakoon, Grun, Kowalewski and Tyler2021; Huntley et al. Reference Huntley, Skawina, Dowding, Dentzien-Dias, De Baets, Kocsis and Labandeira2023) can help propel us into the next generation of analyses for biotic interactions. Currently, biotic interaction papers based on the fossil record are idiosyncratic, but if we have clearer ideas about what is important to estimate for drawing general inferences (e.g., interaction strength; Wootton and Emmerson Reference Wootton and Emmerson2005), we can all aim at comparable quantification.
Conclusion
Biotic interactions can seem to be more amenable to study among contemporary flora and fauna, yet without the fossil record, it is extremely challenging to estimate their contributions to macroevolution, especially extinction, or to infer extinct interactors, traits, and ancient environments. The deep past leaves marks of bottlenecks, constraints, and revolutions, all of which can influence the current day eco-evolutionary dynamics of species interactions. The fossil record is also a superior source of information for long-term population dynamics. By studying (paleo)ecology, we can fruitfully investigate consequences of biotic interactions on macroevolution and contribute to the micro–macro debate.
Acknowledgments
This project received funding from the European Research Council (ERC) under the European Union’s Horizon 2020 research and innovation program (grant agreement no. 724324 to L.H.L.) and from FAPESP (grant no. 2021/06780-4 to T.B.Q.). We thank D. Fraser, an anonymous reviewer, G. Dietl, and K. De Baets for their insightful suggestions. We thank Rodolfo Graciotti for help designing figure 2. L.H.L. thanks the BITE working group supported by the Paleosynthesis project at Friedrich-Alexander-Universität Erlangen-Nürnberg for continued discussion on biotic interactions.
Competing Interests
The authors declare no competing interests.


 Open access