


1. Introduction
Natural convection induced by heating a fluid body from below and cooling it at the top, so-called Rayleigh–Bénard (RB), has been the subject of intense investigation over a long time due to its scientific and practical relevance in various engineering processes and natural phenomena. Rayleigh number,  $Ra=g\alpha \Delta TH^{3}/\kappa \nu$, Prandtl number, $Pr=\nu /\kappa$, the aspect ratio of the enclosure, $\varGamma =L/H$ and boundary conditions are central parameters characterizing bulk features, which directly influence heat transport in RB convection (Chen & Lavine Reference Chen and Lavine1996; Yu, Chang & Lin Reference Yu, Chang and Lin1996, Reference Yu, Chang and Lin1997; Bailon-Cuba, Emran & Schumacher Reference Bailon-Cuba, Emran and Schumacher2010; Wagner & Shishkina Reference Wagner and Shishkina2013; Stevens, Lohse & Verzicco Reference Stevens, Lohse and Verzicco2014); here, $g$ is the gravitational acceleration, $\alpha$ is the thermal expansion coefficient, $\Delta T$ is the temperature difference between the bottom and top walls, $\kappa$ is the thermal diffusivity, $\nu$ is the fluid kinematic viscosity and $L$ and $H$ are the lengths and the height in a rectangular enclosure, respectively.
At sufficiently high  $Ra$, the flow is dominated by turbulence. It exhibits rich multiscale dynamics with a persistent tendency to organize into a dominant convection roll broadly, usually referred to as a large-scale circulation (LSC), at least for sufficiently small aspect ratios ( $\varGamma \sim 1$) (Krishnamurti & Howard Reference Krishnamurti and Howard1981; Qiu & Tong Reference Qiu and Tong2001a; Xia, Sun & Zhou Reference Xia, Sun and Zhou2003; Xi, Lam & Xia Reference Xi, Lam and Xia2004; Zhang et al. Reference Zhang, Huang, Jiang, Liu, Lu, Qiu and Zhou2017; Ji & Brown Reference Ji and Brown2020). In such a turbulent RB system, a coherent LSC coexists with bursts of thermal plumes from thermal boundary layers, which modulates the flow statistics (Castaing et al. Reference Castaing, Gunaratne, Heslot, Kadanoff, Libchaber, Thomae, Wu, Zaleski and Zanetti1989; Wu et al. Reference Wu, Kadanoff, Libchaber and Sano1990). For example, bulk velocity fluctuations are larger with unstable LSC and extended thermal plumes, whereas they are comparatively smaller with stable LSC and concentrated thermal plumes near the cell edge (Xia et al. Reference Xia, Sun and Zhou2003; Zhang et al. Reference Zhang, Huang, Jiang, Liu, Lu, Qiu and Zhou2017). The competition between these two features sometimes results in a flow reversal, which has been observed in many studies. Sugiyama et al. (Reference Sugiyama2010) experimentally and numerically analysed LSC reversal in a quasi-two-dimensional square geometry and observed growing corner rolls that take the energy from detaching plumes from the boundary layers. Podvin & Sergent (Reference Podvin and Sergent2012) used proper orthogonal decomposition (POD) to their direct numerical simulation and noted a growth of corner flow during the flow reversal process in a two-dimensional square RB cell. The interaction between small- and large-scale flow also makes complicated mechanisms that drive turbulent energy cascade at different length scales. Bolgiano (Reference Bolgiano1959) and Obukhov (Reference Obukhov1959) first suggested a scaling for stably stratified convection. For large length scales, namely those above the Bolgiano length, $l_B$, they assumed that the buoyancy force is more dominant than the inertia and proposed that the mean thermal dissipation rate and the production of thermal expansion coefficient and gravity are relevant parameters to the cascade of turbulent energy in the inertial subrange. The dimensional analysis considering these parameters resulted in a so-called BO59 scaling $E_u(k)\sim k^{-11/5}$ for the energy spectrum. The Bolgiano length is defined as $l_B = (Nu^{1/2}d)/(Pr\,Ra)$, where $Nu$ is Nusselt number and $d$ is the vertical height of the container. Below $l_B$, inertia becomes more dominant, and one has Kolmogorov–Obukhov scaling (KO41) with a power-law $k^{-5/3}$ for the energy spectrum. See also Bodenschatz, Pesch & Ahlers (Reference Bodenschatz, Pesch and Ahlers2000) for RB convection developments.
The temperature distribution modulates the dynamics of LSC and the statistical properties of thermal plumes in RB convection. Associated effects can be achieved by the sidewall thermal boundary conditions. Verzicco (Reference Verzicco2002) numerically studied the effects of sidewall with different thermal conductivity on turbulent RB convection for  $Ra$ = $2\times 10^6 \sim 2\times 10^9$ and $Pr = 0.7$. They found that the fluid takes additional momentum due to a vertical thermal layer generated by the modified temperature distribution of the sidewall, which causes mean flow alteration. Zhang et al. (Reference Zhang, Chen, Xia, Xi, Zhou and Chen2021) numerically and experimentally showed that flow reversal and vertical heat transfer could be controlled by adjusting the configurations with locally isothermal sidewalls in two-dimensional and quasi-two-dimensional RB convection at $Ra \sim 10^8$ and $Pr = 2$ and 5.7. With modulated temperature field near locally isothermal sidewalls, corner rolls against large-scale motions can be restrained or strengthened, affecting flow reversal and heat transfer. Wan et al. (Reference Wan, Wei, Verzicco, Lohse, Ahlers and Stevens2019) studied the effect of sidewall using experiments and direct numerical simulation for a cylindrical RB cell at $Ra = 2\times 10^5 \sim 4\times 10^{10}$ and $Pr \sim 0.7$. They noted a strong thermodynamic coupling between the sidewall and fluid that can significantly influence the flow structure and heat transport.
Despite significant progress from previous studies, the effects of asymmetric thermal sidewall boundary conditions in turbulent RB remain obscure. Here, we experimentally investigate features of the LSC and statistics of turbulent fluctuations in RB convection with an asymmetric lateral thermal condition, specifically, one sidewall cooling, and compared with a similar counterpart with adiabatic walls at two reference  $Ra=1.6\times 10^{10}$ and $2\times 10^{9}$, and $Pr=5.4$ to aid insight. This study provides a first experimental inspection of the problem and a basic understanding of natural convection in related asymmetric conditions.
2. Experimental set-up
Laboratory experiments were carried out at two scales in two customized convection tanks (Kim et al. Reference Kim, Shen, DiMarco, Jin and Chamorro2018, Reference Kim, Nam, Shen, Lee and Chamorro2020) with the addition of an asymmetric sidewall cooling, one of them having double dimensions. Complementary experiments for each case were also performed in standard RB conditions with adiabatic walls, which served as reference.
The base rectangular tank has adiabatic vertical walls made of double-pane insulated-evacuated glass panels. Each panel is 3.2 mm thick and separated by a 9.5 mm inert gas barrier to minimize heat loss. The side glass walls are sealed using high-temperature RTV (room-temperature-vulcanizing) silicone. The bottom wall of the tank is made of an 11 mm-thick, hydrodynamically smooth aluminium plate. An 800 W flat silicon heater attached to the underside of the plate with a high-temperature silicone adhesive is operated with a temperature controller, which is set to maintain the heating plate at  $35\,^{\circ }$C. The backside of the heating structure is lined with a pyramidal patterned silicone matt layer that offers an encapsulated air barrier for insulation. A 63.5 mm-thick layer of fire foam was added under the matt coating. A temperature sensor was placed in contact with the underside of the heater and embedded within the foam. A 9.5 mm-thick aluminium plate serves as the seating surface of the underside of the tank. The tank is finished in a solid oak trim secured with fiberglass mesh impregnated with high-temperature silicone; see Kim et al. (Reference Kim, Shen, DiMarco, Jin and Chamorro2018, Reference Kim, Nam, Shen, Lee and Chamorro2020) for additional details of the tank. Two customized L-shaped, 25 mm-thick aluminium plates were fabricated to provide cooling at the top and one sidewall. A cooling flow was recirculated on these plates by a 1000 W capacity PolyScience refrigerated circulator. It allowed us to keep the temperature of the cooling plates constant, which was set at $25\,^{\circ }$C using continuous feedback control. During the experiments, the temperature of heated and cooled plates was monitored using thermocouples (DT4208SD, General Tools & Instruments) at 1 Hz with a measurement resolution of $0.1\,^{\circ }$C, and the variation in the temperature of the plates was within $0.2\,^{\circ }$C.
The large prismatic tank is  $H = 400$ mm high, $B = 500$ mm wide and $L = 250$ mm long and was filled with distilled water. The other set-up is half the size of the large unit. The aspect ratio of the two tanks was $\varGamma =1.25$, defined by the width per height, or $\varGamma =0.625$ considering the depth to height ratio. The Prandtl number was $Pr \approx 5.4$ and the reference $Ra$ defined with the temperature difference between bottom and top plates was $Ra=1.6\times 10^{10}$ and $Ra = 2\times 10^9$ for the large and small tanks. Overall, the boundary conditions are given by three adiabatic sidewalls and isothermal conditions $T_H=35\,^{\circ }$C at the bottom wall, and $T_C=25\,^{\circ }$C at the top and one sidewall in the asymmetric single sidewall temperature scenario.
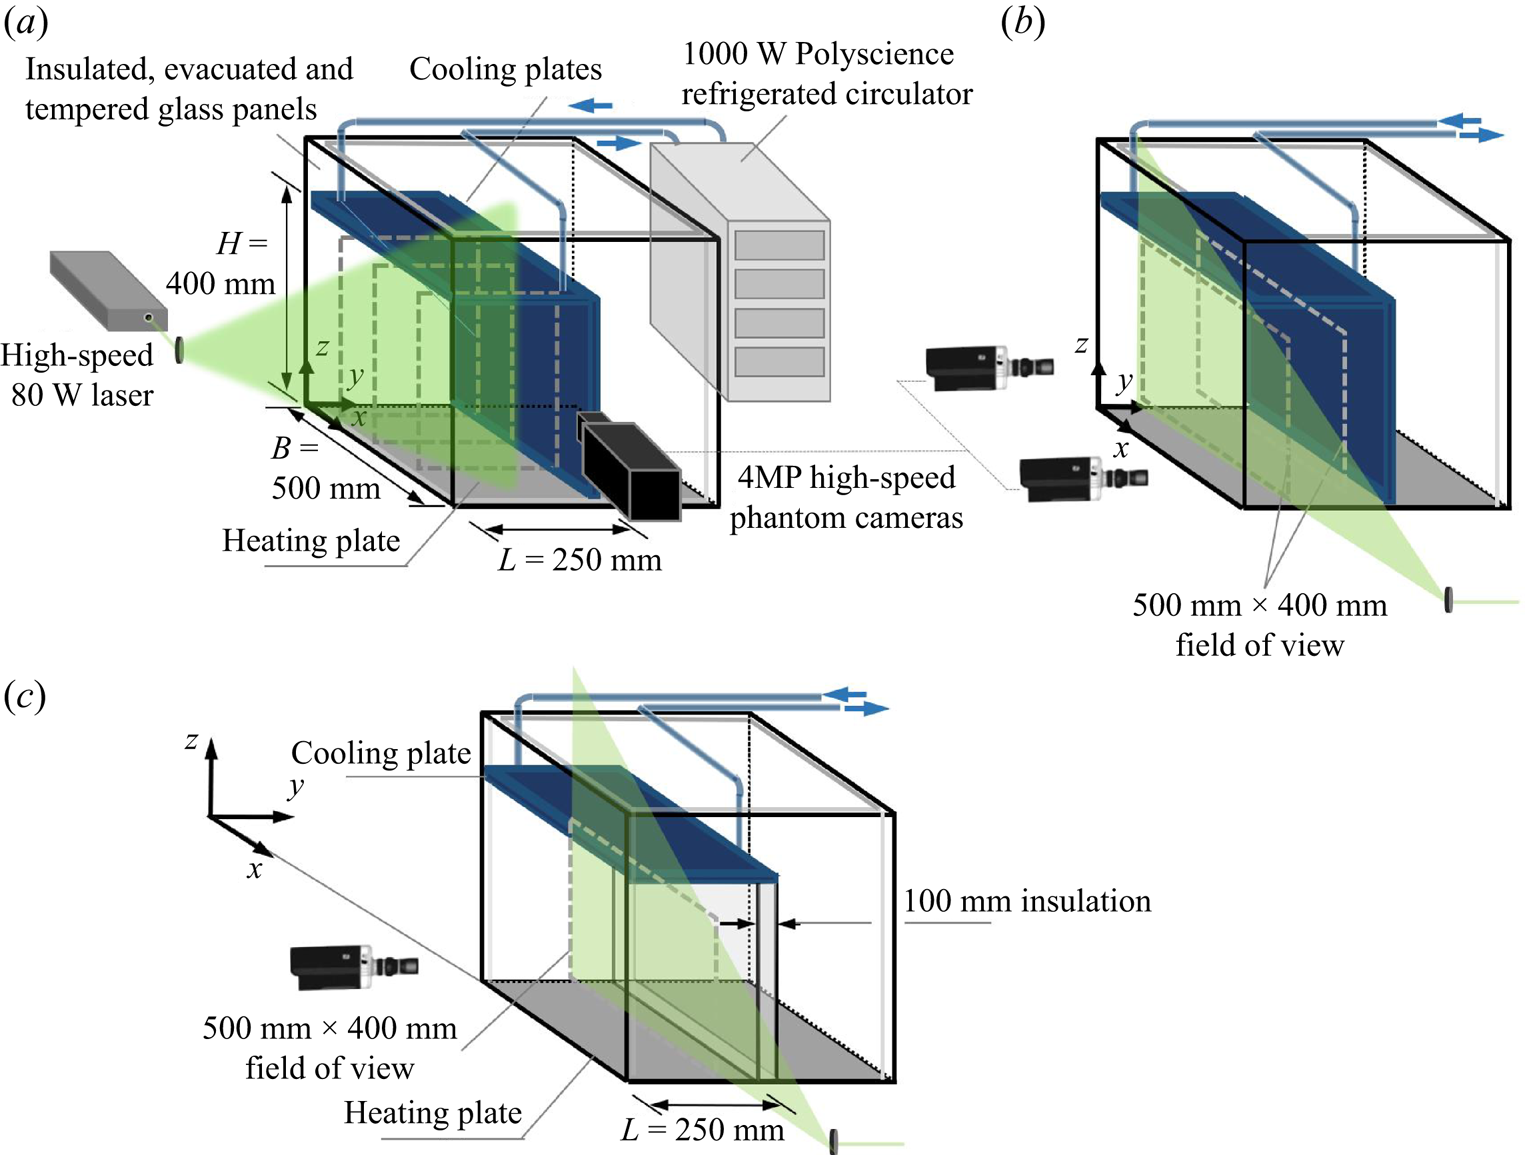
Flow measurements were obtained in various planes in two distinct sets, one of a relatively short duration of approximately 360 s per plane at 10 Hz to characterize critical motions, henceforth Group 1. The other set, referred to as Group 2, considered comparatively long runs of 6000 s at lower frequency sampling of 0.67 Hz to obtain representative statistics. Instantaneous flow fields in Group 1 were captured at five vertical planes perpendicular and parallel to the cooling sidewall using particle image velocimetry (PIV). Specifically, in-plane flow was obtained in three  $y$–
$y$– $z$ parallel planes at $x/B = 1/4$, 1/2 and 3/4 covering a FOV of $250\,{\rm mm} \times 400\,{\rm mm}$ (see figure 1a), and two $x$–
$x$– $z$ parallel planes at $y/L = 1/3$ and 2/3 covering an investigation area of $500\,{\rm mm} \times 400\,{\rm mm}$ (see figure 1b). A 4-MP CMOS high-speed camera was used to capture the flow in the $y$–
$y$– $z$ planes and two cameras for the $x$–
$x$– $z$ planes, which shared an overlap region of $100\,{\rm mm} \times 400\,{\rm mm}$ in the middle of FOV. Before each experiment, the system was allowed to reach steady conditions by waiting for at least 30 minutes; it minimized the transient effects on the flow. The FOVs were illuminated with an 80 W, 532 nm high-speed laser during the investigation. There were 4000 and 3000 instantaneous fields obtained in each of $y$–
$y$– $z$ and $x$–
$x$– $z$ FOVs, all at a sampling rate of 10 Hz. For PIV processing, two-dimensional velocity fields were obtained from cross-correlation between two consecutive images with a time interval of 100 ms. Each velocity vector was calculated in a subwindow of 60 pixels $\times$ 60 pixels with 50 % overlap resulting in approximately 4 mm vector grid spatial resolution. The complementary experiments on the smaller rectangular tank considered experimental conditions identical to those in Group 2. The smaller set-up had a FOV of $250\,{\rm mm} \times 200\,{\rm mm}$, which allowed a higher grid resolution of $\Delta x = \Delta y = 1$ mm.
Basic schematic of the experimental set-ups with the large tank illustrating the case with single sidewall cooling with (a) three field of views (FOVs) in the  $y$–
$y$– $z$ planes at $x/B$ = 1/4, 1/2 and 3/4 and (b) two FOVs in the $x$–
$x$– $z$ planes at $y/L$ = 1/3 and 2/3. (c) Standard RB configuration (no sidewall cooling) showing an $x$–
$x$– $z$ FOV plane at $y/L = 1/2$. A similar set-up was studied with a smaller tank of half the size; see Appendix A.
Long-duration experiments in Group 2 considered flow characterization for 100 minutes to explore statistical quantities and the LSC motion. The PIV with an 8 MP CCD camera and a 250 mJ, 532 nm low-speed laser was performed at a sampling frequency of 0.67 Hz in two vertical parallel planes  $y/L = 1/3$ and 2/3. The vector grid resolution and investigation area in Group 2 was same as that in Group 1. Flow field characterization was also obtained at one vertical parallel plane $y/L = 1/2$ for the base case without single sidewall cooling. A 100 mm-thick insulation board with a thermal conductivity similar to the other side air-gap walls replaced the sidewall cooling. This set-up produced a typical RB convection domain with a geometry the same as the single sidewall cooling case. Here, the heating and cooling plate temperatures were also maintained at 35 $^{\circ }$C and 25 $^{\circ }$C, the same as the single sidewall cooling case. Interestingly, a reversal of LSC appeared after a relatively long time for this case without single sidewall cooling. This phenomenon is discussed later. An additional long-duration experiment was conducted at $y/L = 1/2$ and $y/L = 1/3$ planes, avoiding flow reversal to obtain time-averaged statistics. This was possible by slightly tilting the convection cell with a slight angle $\sim 1^{\circ }$ as suggested by Qiu et al. (Reference Qiu, Shang, Tong and Xia2004) and Ciliberto, Cioni & Laroche (Reference Ciliberto, Cioni and Laroche1996).
3. Results
3.1. Time-averaged flow field statistics
3.1.1. On the mean flow
Characterizing the mean flow field using experiments in Group 1 provides a first assessment of the LSC signature. Unless specified otherwise, the discussion is centred at larger  $Ra$ and complemented at lower $Ra$ when appropriate and in Appendix A. The velocities are normalized by a freefall velocity
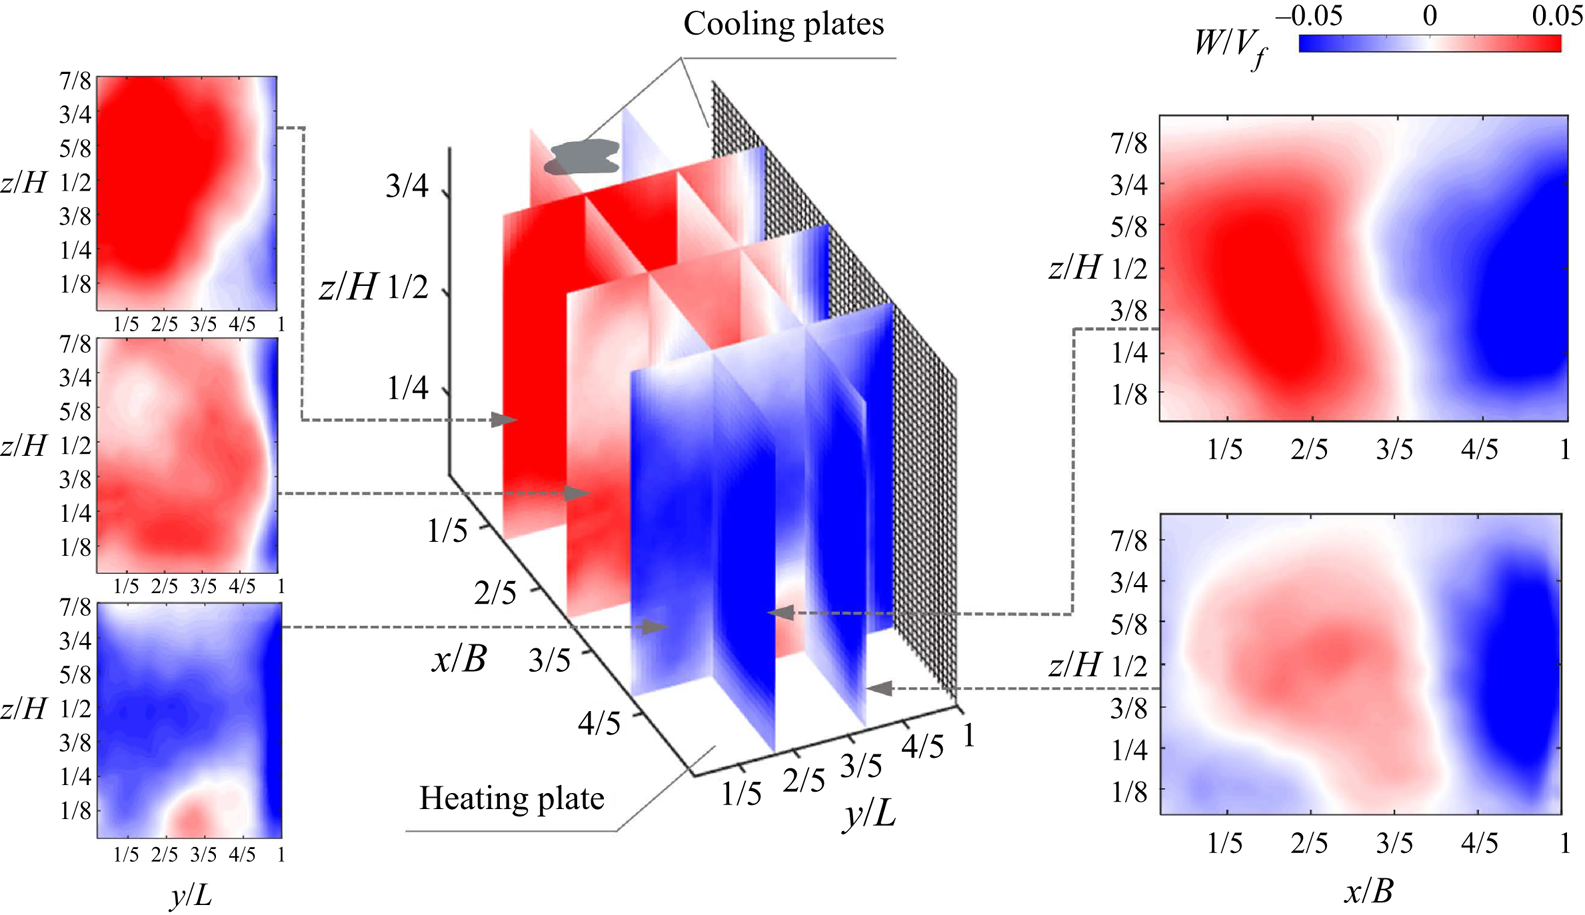
  $V_f = \sqrt {\alpha g \Delta T H}$. It demonstrates the modulation of the asymmetric single sidewall cooling on the circulation pattern. In particular, the distribution of the vertical velocity component, $W$, shown in figure 2, highlights a dominant LSC pattern and local and non-local effects due to single sidewall cooling. A comparable downward and upward flow region in spatial extent and velocity level occurs in the parallel plane far from the cooling wall, i.e. $y/L=1/3$. However, this is not the case at the plane closer to the cooling sidewall, $y/L=2/3$; the spatial distribution and relative magnitude of the maximum vertical velocity differ significantly with locally stronger descending bulk flow. The downward motion particularly dominates near the side cooling wall. The $W$ distribution in all $y$–
$y$– $z$ planes indicates the effect of the induced density gradient with a denser medium in the proximity to the vertical cooling wall. As a result, the ascending and descending flows of the LSC undergo spatial changes. It is also worth highlighting the match between the intersected planes, which gives qualitative evidence of the repeatability of the process. Indeed, given the large domain in each plane, flow characterization in the normal planes was obtained separately. Overall, the planes show an LSC with a significant bulk sense of rotation pointing in the $y$ axis induced by the thermal gradient from the top and bottom walls. The single sidewall cooling directly caused a secondary rotating pattern in the $x$ axis. Note that for a conventional RB in a rectangular geometry, the LSC is expected to rotate pointing to the shorter horizontal dimension (Huang, Hu & Li Reference Huang, Hu and Li2019), which is parallel to the $y$ axis in this case. Inspection of these axes of rotation allows for characterizing the bulk motions of the LSC, which will be given in the last section.
Time-averaged vertical velocity component,  $W$, at various $x$–
$x$– $z$ and $y$–
$y$– $z$ planes for the Group 1 measurements.
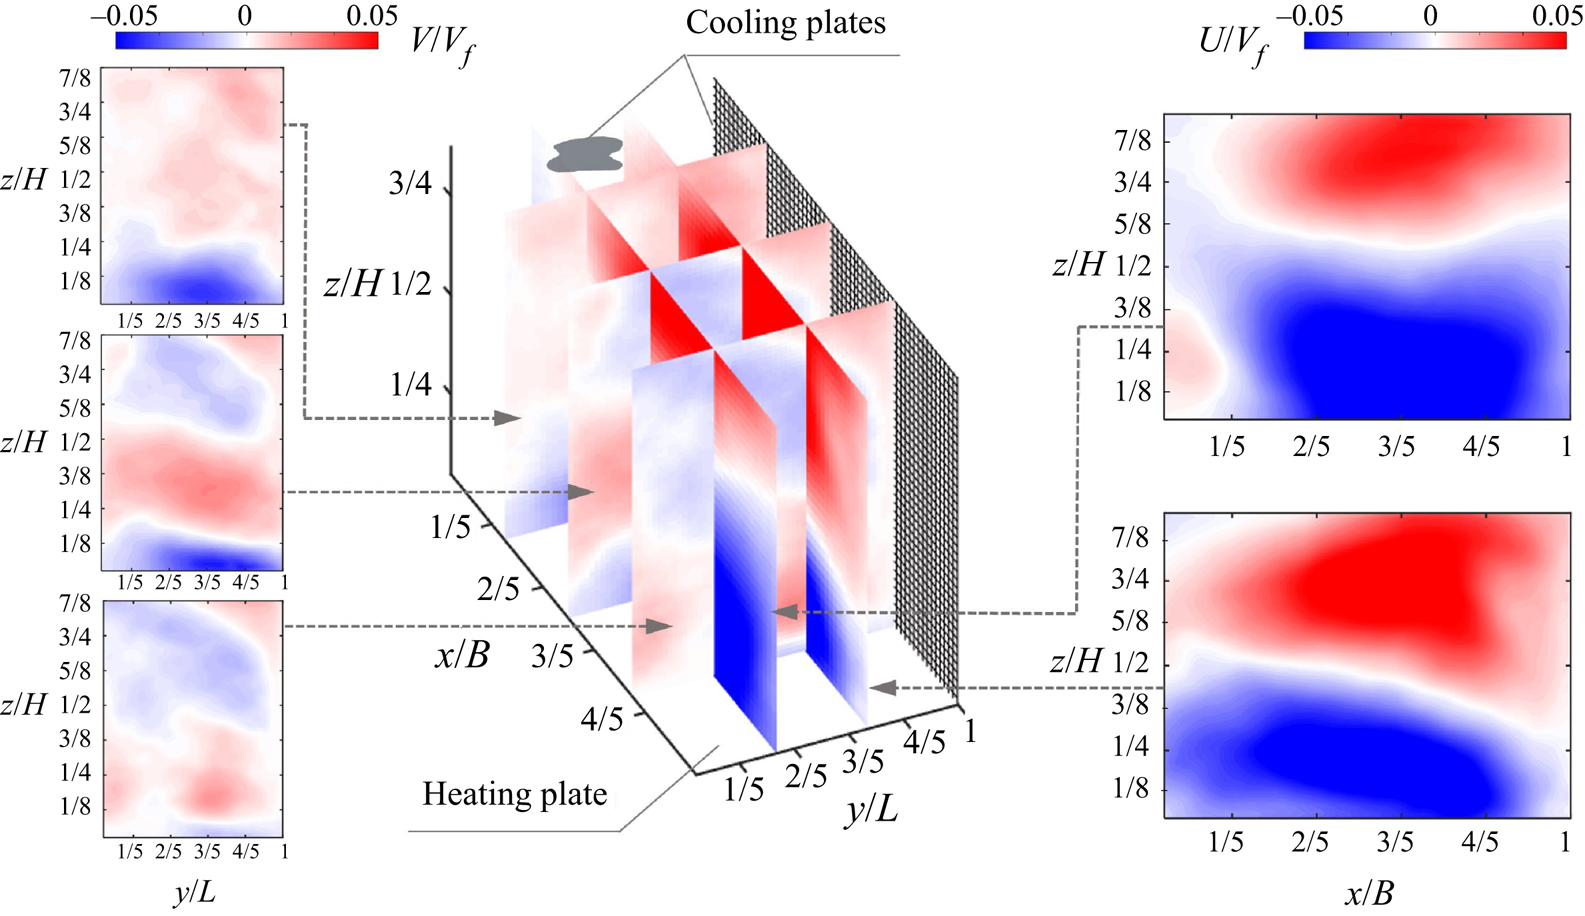
The distributions of the mean horizontal velocity components,  $U$ and $V$, parallel to the $x$ and $y$ axes, illustrated in figure 3 help us to appreciate the two senses of rotation with respect to the defined coordinate system; those are projections of an overall inclined rotation pattern of the dominant LSC. The non-symmetrical distributions of the horizontal velocity components in each plane are conditioned by the vertical counterpart given in figure 2. Note that the magnitude of the $y$ axis rotation motion, i.e. mean velocity in the $x$–
$x$– $z$ planes, is larger than that of the $x$ axis rotation motion, i.e. mean velocity in the $y$–
$y$– $z$ planes. This supports the observation of the relative modulation of the top and bottom cold-and-hot walls in the first case and side cold-and-adiabatic walls in the second case.
Time-averaged horizontal velocity components,  $U$ and $V$ in the $x$ and $y$ directions for the Group 1 measurements. Note that these components are normal; they should not match at the plane intersections.
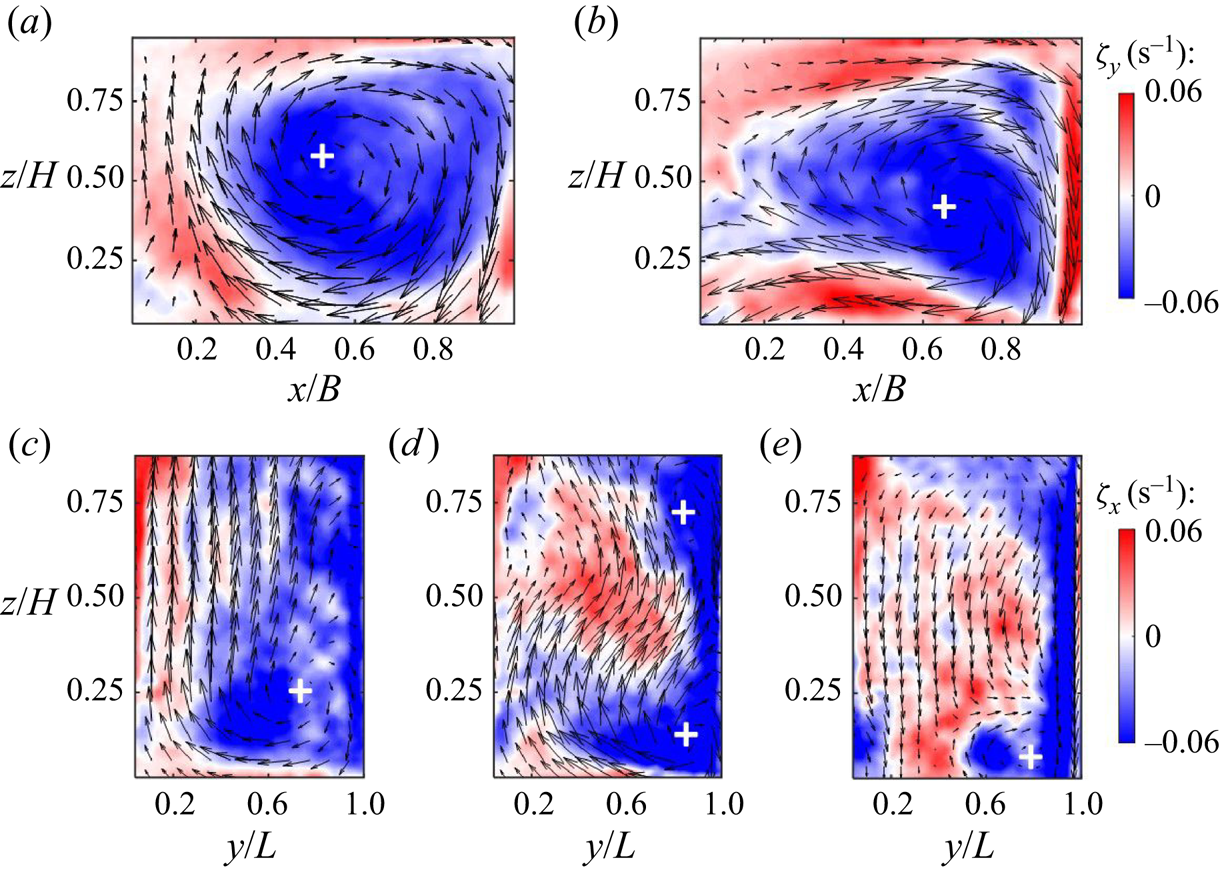
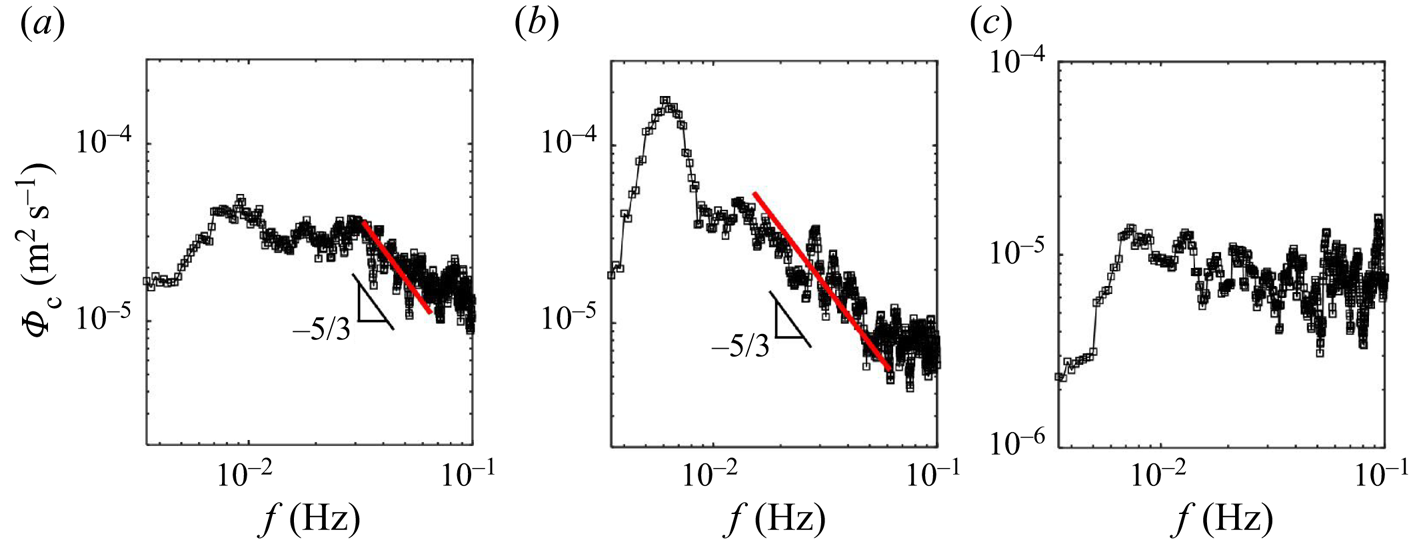
Out of plane bulk vorticity fields,  $\zeta _y$ and $\zeta _x$, superimposed with the mean in-plane velocity vector fields shown in figure 4, provide additional insight into the bulk recirculation patterns of the LSC and secondary structures. A roughly centred rotation pattern covers a significant fraction of the cell domain relatively far from the side cooling wall ( $y/L=1/3$, figure 4a). However, the LSC shows a highly asymmetric shape with local counter-rotating regions closer to the sidewall cooling ( $y/L=2/3$, figure 4b). These counter-rotating regions appear in standard RB at smaller $Ra$ (Sugiyama et al. Reference Sugiyama2010; Zhang et al. Reference Zhang, Huang, Jiang, Liu, Lu, Qiu and Zhou2017). The characteristic of corner flow is also demonstrated in the $x$–
$x$– $z$ planes, where comparatively small structures occur at the top and bottom corners in proximity to the cooling wall. This phenomenon evidences the effect of sidewall cooling by inducing an effective Rayleigh number ( $Ra_{e}$) and a preferential buoyancy gradient that breaks the symmetry of LSC. The identical trends are also observed in the long-duration experiment shown in figure 5. For brevity, we present results in the representative midplane, $y/L=1/2$, for the canonical RB case; see figure 14 in Appendix A for the comparison with the $y/L=1/3$ plane. The mean flow configuration at $Ra = 2\times 10^9$ also revealed similar bulk effects of lateral cooling; see figure 15 in Appendix A. Detailed discussion and further arguments relating to a $Ra_{e}$ and interaction between LSC and small-scale coherent structures are given in later sections.
Out-of-plane bulk vorticity contours superimposed with in-plane mean velocity vector distributions in the  $x$–
$x$– $z$ planes at $y/L$ = (a) 1/3 and (b) 2/3, and $y$–
$y$– $z$ planes at $x/B$ = (c) 1/4, (d) 1/2 and (e) 3/4. The ‘+’ signs indicate the location of mean vortex cores.
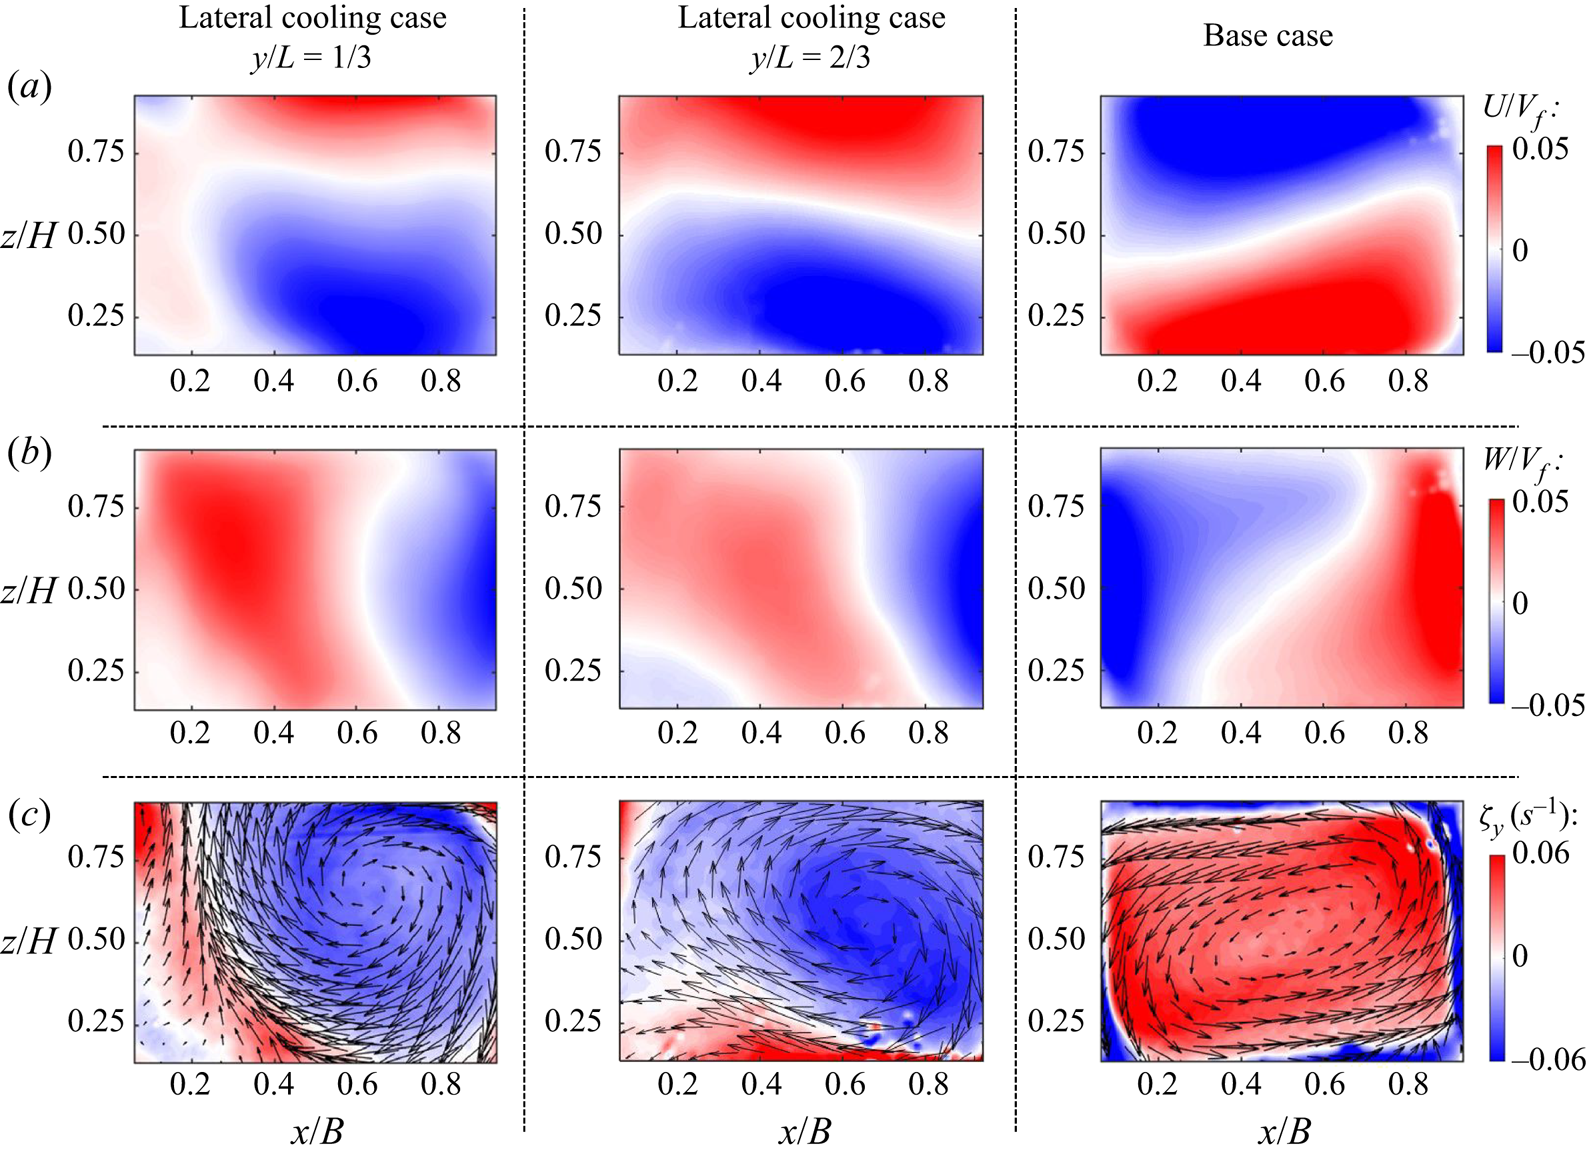
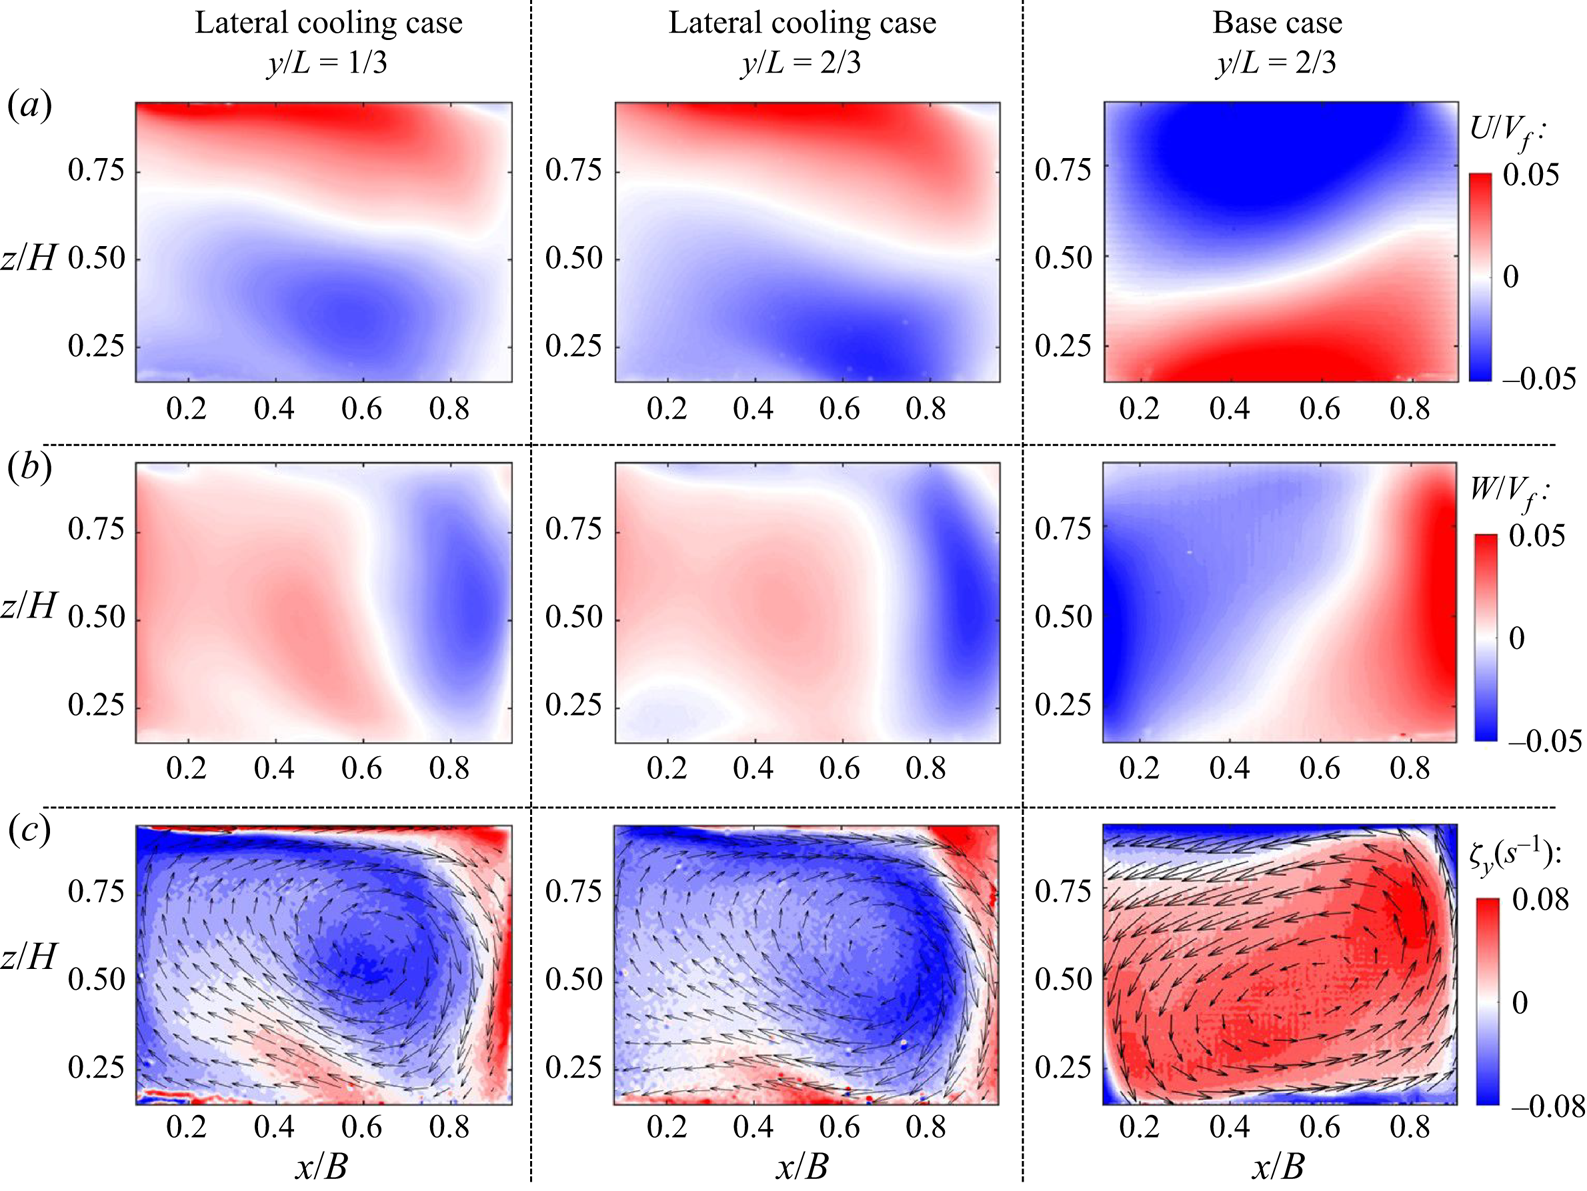
Time-averaged (a) horizontal and (b) vertical velocity fields, and (c) vorticity contours with superimposed in-plane velocity vector fields for Group 2 measurements.
3.1.2. Second-order flow statistics
In-plane turbulent kinetic energy  $TKE = 1/2 (\langle u'^2 \rangle + \langle w'^2 \rangle )$ and kinematic Reynolds shear stress $-\langle u'w' \rangle$ are obtained from the long-duration experiments (Group 2) in two planes parallel to the vertical cooling ( $x$–
$x$– $z$) and compared with a canonical RB convection scenario in figure 6. There, $u'(t) = u(t) - U$ and $w'(t) = w(t)- W$ are the velocity fluctuations in the $x$ and $z$ directions and $\langle \ \rangle$ represents the time-average operator.
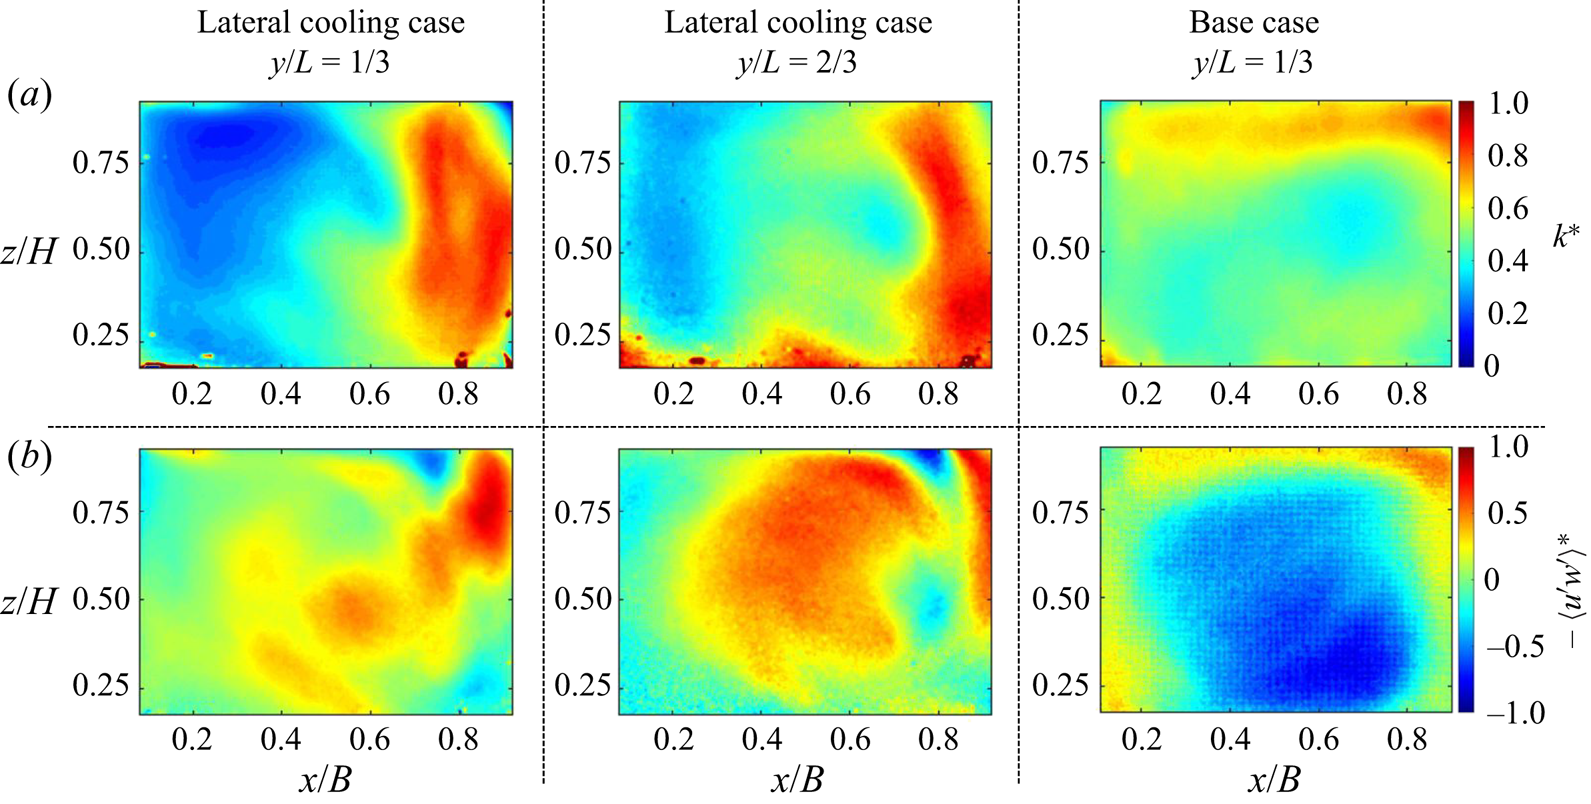
In-plane (a) turbulent kinetic energy and (b) Reynolds stress for Group 2 measurements.
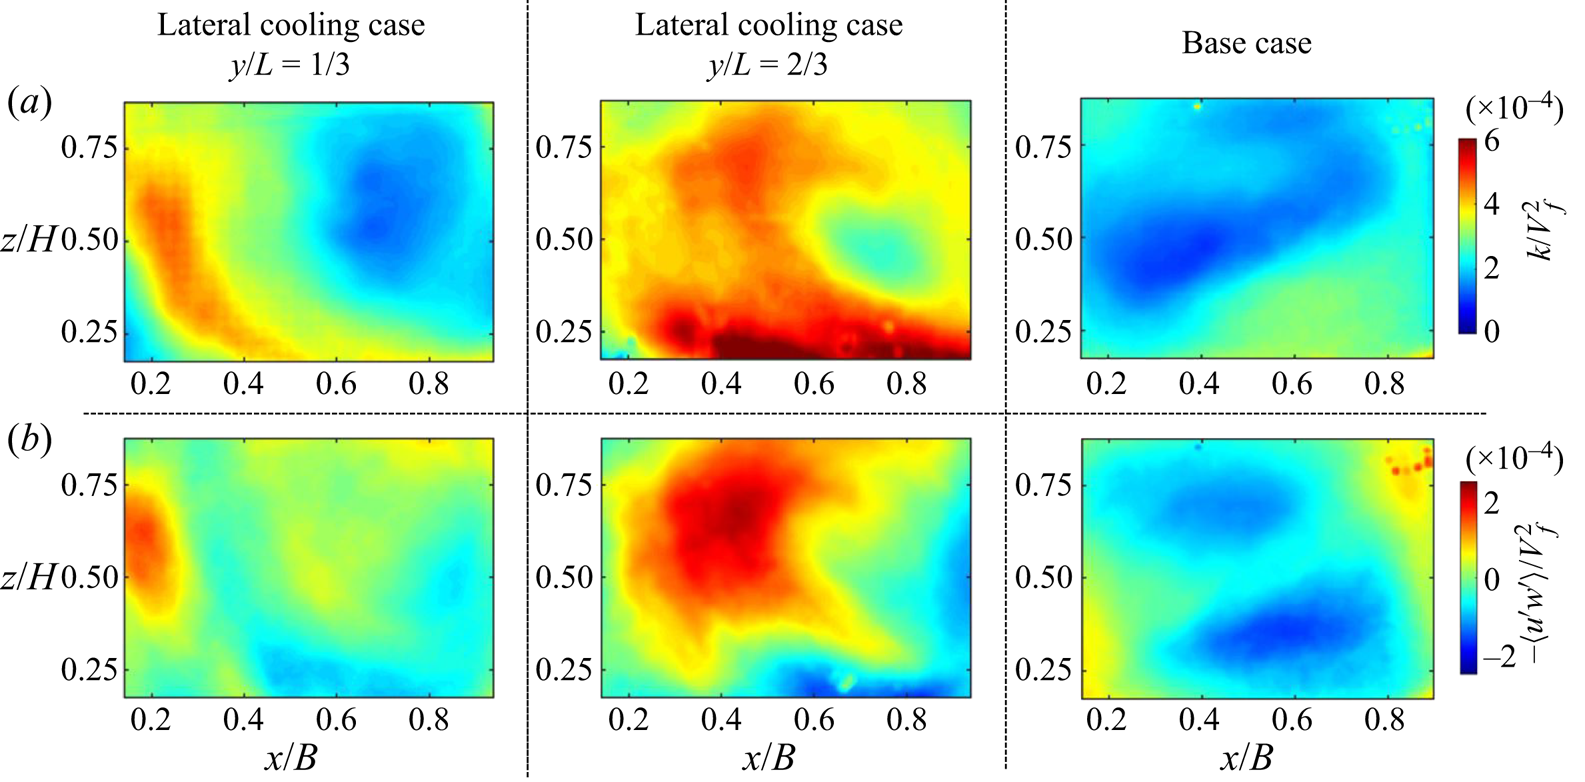
The  $TKE$ and Reynolds stress distribution in the canonical RB convection case (no single sidewall cooling) is consistent with those observed in the literature for similar $Ra$ and $Pr$ numbers (Xia et al. Reference Xia, Sun and Zhou2003; Zhang et al. Reference Zhang, Huang, Jiang, Liu, Lu, Qiu and Zhou2017), exhibiting similar levels of normalized Reynolds stress to those in Xia et al. (Reference Xia, Sun and Zhou2003). However, the distribution of this quantity in the asymmetric cooling is significantly different; it results from a combined effect on $Ra_{e}$ and the preferential density gradient breaking up the symmetry of the LSC.
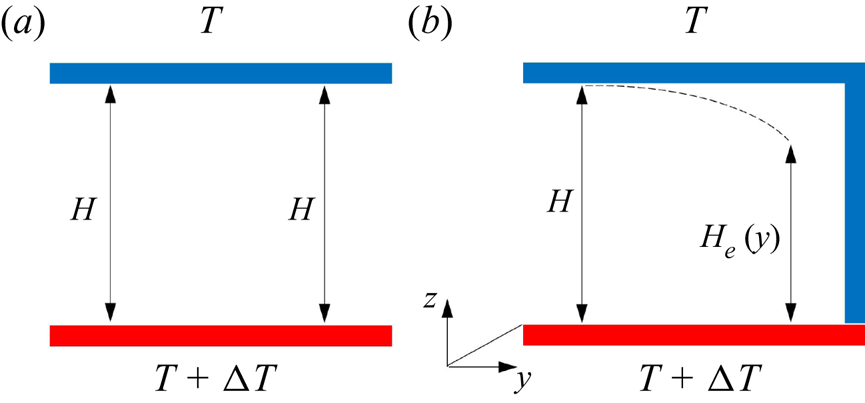
In canonical RB convection,  $Ra$ is defined as the ratio between time scales of thermal transport by buoyancy and convection effects (Rayleigh Reference Rayleigh1916) and is proportional to the $H^3$, where $H$ is the separation between the lower and upper boundaries having temperatures $T+\Delta T$ and $T$ (figure 7a). However, the single-sidewall cooling scenario modifies the distance from the cooling; its magnitude is $y$-dependent (figure 7b). As such, we propose an effective length scale $H_{e}(y)$ that should weigh the relative cooling sidewall, as shown in figure 7(b). This quantity may better capture the buoyancy time scale. Although further investigation is required to obtain an accurate estimator of $H_{e}(y)$, results indicate that this quantity increases with the distance from the lateral cooling such that $H_{e}(y)\to H$ sufficiently far from it, where sidewall effects become negligible. Indeed, compared with their canonical counterpart, a relatively lower $Ra_e$ signature is indicative at the $y/L = 2/3$ plane. Consequently, an effective Rayleigh number may be expressed as $Ra_{e} = g\alpha \Delta TH_e^{3}/\kappa \nu$.
Conceptual schematic of the  $y$-dependent $H_e$ due to the modulation of the lateral cooling. (a) Canonical RB convection, and (b) RB convection with single sidewall cooling.
Second-order statistics provide evidence of the  $Ra_e$ effect, which modulates temperature distribution. In the canonical scenario, a comparatively high $TKE$ region tends to concentrate around the external portion of the cell. In the lateral cooling case, a relatively high $TKE$ region extends over the cell centre, implying that the thermal plumes extend farther than the canonical case. This trend is more distinct in the plane closer to the cooling wall ( $y/L=2/3$), indicating a lower $Ra_{e}$, whereas in the plane farther apart from lateral cooling ( $y/L=1/3$) shows relatively higher $Ra_{e}$. Canonical RB at the higher $Ra$ of $1.6 \times 10^{10}$, the detaching thermal plumes from the thermal boundary layers are restricted to the thin boundary layer as the vertical temperature gradient is mainly in the near-wall region (Xia et al. Reference Xia, Sun and Zhou2003; Wagner & Shishkina Reference Wagner and Shishkina2013) leading to the high $TKE$ corners. The PIV measurements in the midplane region of this canonical RB did not include that zone, but it was captured with complementary experiments at the $y/L=1/3$ plane and illustrates a high $TKE$ region at the right-hand top corner ( Appendix A, figure 14d). However, lateral cooling altered the temperature distribution leading to a non-zero temperature gradient featuring trends reported by Wang et al. (Reference Wang, Liu, Verzicco, Shishkina and Lohse2021) for a pure lateral-heating scenario. In our lateral cooling case, the temperature gradients are less restricted to the near-wall region than the canonical RB convection resulting in a high $TKE$ region around the centre. Higher $TKE$ region towards the centre of the flow field for a lower $Ra$ is consistent with those reported for canonical RB convection (Xia et al. Reference Xia, Sun and Zhou2003; Zhang et al. Reference Zhang, Huang, Jiang, Liu, Lu, Qiu and Zhou2017). Aside from altering the $Ra$, an additional asymmetry effect due to the preferential negative buoyancy force generated from sidewall cooling is evidenced by comparing the base case's $TKE$ distribution with the single sidewall cooling case. A similar effect is observed from the $-\langle u'w' \rangle$ distributions, as shown in figure 6(b). Second-order flow statistics in the smaller set-up at $Ra = 2\times 10^9$ also showed similar effects of single sidewall cooling, but the effects were less dependent on the distance from the sidewall cooling compared with the case at $Ra = 1.6\times 10^{10}$; see Appendix A, figure 16.
3.2. Spectral features of the flow
Using the long-time experimental data in Group 2, we explored the impact of the single sidewall cooling on the structural features of the turbulence at selected locations. Figure 8 illustrates power spectra of the vertical velocity fluctuations,  $\varPhi _{w'}$ and their compensated forms, at two points in each plane parallel to the sidewall cooling, one at the vortex core (solid line) and the other at $\Delta x/B=0.2$ from the vortex core in the positive horizontal direction (dashed line), where the shear is significant.
(a–c) Power spectra of vertical velocity fluctuations,  $\varPhi _{w'}$, (d–f) compensated forms $f^{5/3}\varPhi _{w'}$ (KO41) and $f^{11/5}\varPhi _{w'}$ (BO59) at the vortex core location (solid line) and at $\Delta x/B=0.2$ from the vortex core in the horizontal direction (dashed line) for the single sidewall cooling case at (a,d) $y/L = 1/3$ and (b,e) $y/L = 2/3$. (c,f) Canonical counterpart (no sidewall cooling).
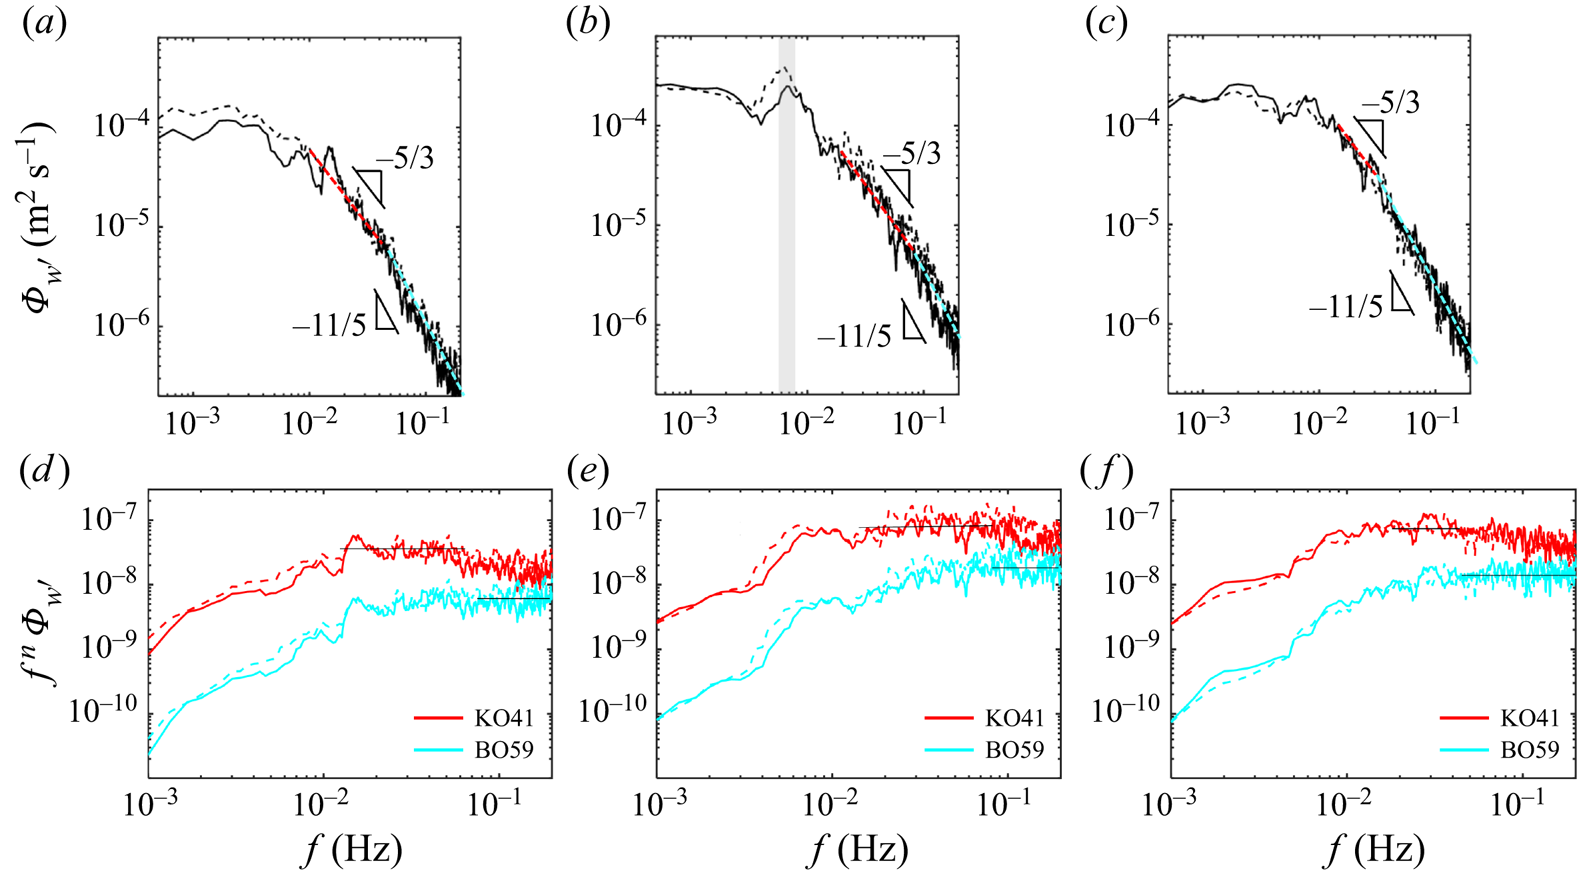
The velocity spectra exhibit a similar trend at two locations in a given plane and scenario, where similar spectral features are observed within the flow field. However, they reveal different scaling ranges depending on the presence of the single sidewall cooling and the distance from that wall. The two scenarios exhibit a  $\varPhi _{w'}\propto f^{-5/3}$ (KO41) scaling in the comparatively low-frequency range within the inertial subrange and a $\varPhi _{w'}\propto f^{-11/5}$ (BO59) law at a sufficiently high frequency. The frequency defining the start of the BO59 scaling is the highest for the plane near the cooling sidewall ( $\sim 0.09$ Hz, figure 8b) and lower at the $y/L = 1/3$ plane ( $\sim 0.06$ Hz, figure 8a), and is lowest in the canonical base case ( $\sim 0.05$ Hz, figure 8c) evidencing the dominant effect of the sidewall cooling in the near flow dynamics.
Considering that KO41 and BO59 scalings feature inertia and buoyancy effects, the results suggest weaker buoyancy effects, i.e. lower  $Ra_{e}$, due to the modulated temperature distribution with the sidewall cooling. The inertia- and buoyancy-driven ranges are expected to occur at comparatively small and large length scales (Bolgiano Reference Bolgiano1959; Obukhov Reference Obukhov1959). However, a similar trend in frequency power spectrum for the vertical velocity was noted by Shang & Xia (Reference Shang and Xia2001); power laws of $-1.35$ and $-11/5$ at comparatively low- and high-frequency ranges. They also pointed out an inconsistency between the theoretical studies and their findings, stressing the necessity for further investigation. The complex interaction between small- and large-scale structures with small-scale thermal plumes organizing to form a large-scale flow that progresses to small scales (Xi et al. Reference Xi, Lam and Xia2004; Zhang et al. Reference Zhang, Huang, Jiang, Liu, Lu, Qiu and Zhou2017) is a factor that can shed light on this particular dynamics.
It is worth pointing out that the standard deviations of the vertical velocity component,  $\sigma _w$, is the largest at the plane closer to the cooling wall. A distinct low-frequency peak highlighted in figure 8(b) is a particular feature of turbulent convection; it is of the order of the turnover frequency for the LSC, $f_t=\langle \sigma _w \rangle /2H$ (Qiu & Tong Reference Qiu and Tong2001b; Sakievich, Peet & Adrian Reference Sakievich, Peet and Adrian2016). This turnover frequency is approximately $3.9 \times 10^{-3}$ Hz for the single sidewall cooling case. The peak frequency in figure 8(b) is approximately $2 f_t$, matching the canonical RB convection studies with two LSC oscillation periods per LSC turnover time (Brown & Ahlers Reference Brown and Ahlers2009; Ji & Brown Reference Ji and Brown2020). The structural features at $Ra = 2\times 10^9$ are presented in figure 17 in Appendix A, showing only KO41 scaling and peak frequencies that match LSC turnover time. A detailed discussion of the LSC oscillation is given in § 3.4.
3.3. Proper orthogonal decomposition
Distinct spatial features produced in the given flows, including dominant coherent motions, can be further evidenced with snapshot POD (Sirovich Reference Sirovich1987). This technique is a valuable tool to uncover flow characteristics affected by coherent structures (Rempfer & Fasel Reference Rempfer and Fasel1994). Recently, Paolillo et al. (Reference Paolillo, Greco, Astarita and Cardone2021) showed that POD modes may extract characteristic LSC within the RB turbulent thermal convection process, and the mode coefficients allow the determination of LSC orientation.
The POD basically decomposes the stochastic velocity  ${\boldsymbol {u}}(x,y,t)$ into deterministic spatially correlated patterns $\phi ^n(x,y)$ as POD modes and their time-dependent coefficients, $a^n(t)$, as follows:
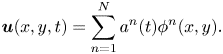 \begin{equation} {\boldsymbol{u}}(x,y,t)=\sum_{n=1}^{N} a^{n}(t)\phi^{n}(x,y). \end{equation}
Here,  $N = 4000$ is the number of snapshots. The energy content, $E_n$, is obtained by dividing the eigenvalue of a particular mode by the sum of all $N$ eigenvalues (Hamed et al. Reference Hamed, Sadowski, Nepf and Chamorro2017), i.e. $E_{n}=\lambda _{n} / \sum _{m=1}^{N} \lambda _{m}$, and can be interpreted as the single-mode contribution to the total kinetic energy. The first mode corresponds to the mean flow, shown in figure 5, and displays an LSC with comparatively small counter-rotating regions and the first two modes contribute to almost 70 % of the total kinetic energy (figure 9d); a simple low-order model may consider the first two modes as ${\boldsymbol {U}} = \sum _{i=1}^{2} a^{i}\phi ^{i}$, where ${\boldsymbol {U}} = [{\boldsymbol {u}} {\boldsymbol {v}}]^\intercal$ is the reduced velocity vector. Figure 9(a,b) demonstrate the out-of-plane vorticity $\zeta _y$ of the low-order model with velocity vectors. It shows a large rotating flow with the same direction as the LSC given in the first mode, but counter-rotating regions become more prominent in the two planes parallel to the sidewall cooling and reveal that the counter-rotating flow is larger in the plane of lower $Ra_e$ closer to the vertical cooling wall, and agrees well with the larger counter-rotating flow at lower $Ra$ for canonical RB convection. Xia et al. (Reference Xia, Sun and Zhou2003) noted that counter-rotating vortices are related to the regions where the vertical velocity fluctuations are large, where rising and falling plumes may reach the opposite wall. As indicated in § 3.1.2, large velocity fluctuation regions are more extended in the $y/L=2/3$ plane, implying that thermal plumes advect farther and generate larger counter-rotating flows with the single sidewall cooling. An additional difference between the LSC and counter-rotating flows for the single sidewall cooling case and canonical RB convection is the asymmetry of the coherent structures. Counter-rotating flows are located symmetrically for the canonical RB scenario where LSC's ascending and descending motions decelerate at the corners (figure 9c). However, with sidewall cooling, counter-rotating regions are mostly leaned towards the bottom side (figure 9a,b) as the result of additional cooling, which restrains the deceleration of descending motion of LSC. Thus, suppressing the generation of corner flows at the top corner, resulting in an asymmetric flow configuration.
Vorticity contours of the sum of first two POD modes superimposed with velocity vector fields in (a)  $y/L=1/3$ and (b) $y/L=2/3$ planes for single sidewall cooling case, and (c) for the base case. (d) Energy of the first five modes.

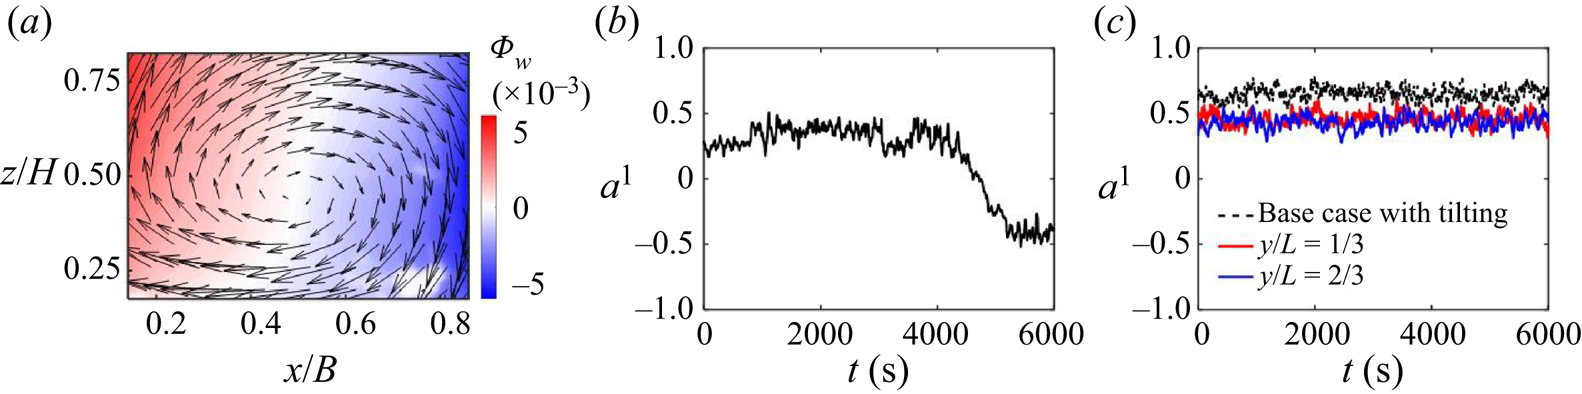
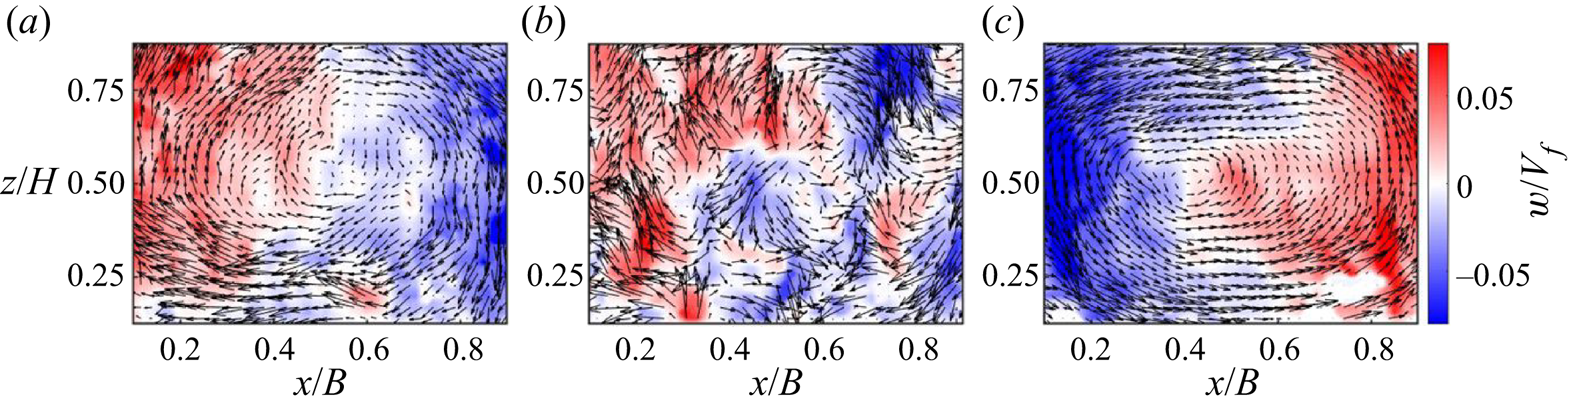
It is worth pointing out a flow reversal in the base case as indicated by the first POD mode coefficient in figure 10(b). Instantaneous vector fields before flow reversal, during the change of rotation, and after the reversal are shown in figure 11. The flow reversal was suppressed with a minor tilting, which is evidenced by the constant sign of the first mode coefficient (figure 10c). Similarly, flow reversal was suppressed in the single sidewall cooling case. The asymmetric flow configuration prevented the flow reversal even under significant counter-rotating flow. Huang et al. (Reference Huang, Wang, Xi and Xia2015) pointed out that more reversals are required with a symmetric boundary condition to restore the symmetry, and controlling the flow reversal with an asymmetric thermal boundary condition was also proved in Zhang et al. (Reference Zhang, Chen, Xia, Xi, Zhou and Chen2021). Single sidewall cooling can also lead to a symmetry-breaking process similar to the base case with tilting. Note that a minor tank tilting in the base case generates a buoyancy force component in the tilted direction, which directly induces a preferential orientation of the LSC rotation. Small perturbations may modulate the direction of LSC in canonical RB convection; however, the asymmetric vertical cooling pins down the LSC direction by creating a density gradient in the  $y$ direction. Due to this, descending flow is stronger and more tilted to one side of the $x$ direction by mass conservation closer to the cooling sidewall ( $y/L=2/3$) compared with that at the $y/L=1/3$ plane, as shown in figure 2. As the heavier fluid ( $y/L=2/3$) is more tilted to one side of the $x$ direction than the lighter fluid ( $y/L=1/3$), a density gradient in the $x$ direction is generated in a mediated manner; this promotes the LSC direction. In conclusion, the asymmetric set-up creates a preferential density gradient resulting in a driving force for a particular rotational direction of the LSC.
Vertical velocity snapshot of (a) first POD mode superimposed with velocity vector fields and (b) associated mode coefficient for the base case without tilting. (c) First mode coefficients for the base case with tilting and single sidewall cooling case.
Instantaneous vector fields with vertical velocity contours at an instant (a) before, (b) during and (c) after the flow reversal for the base case without tilting.
3.4. On the LSC oscillation pattern
Inspection of the LSC core oscillation aids in understanding the impact of the single sidewall cooling on the dominant flow patterns. The LSC's global minimum velocity magnitude defines the vortex core location. The trajectory in each plane is provided in figure 12; the black dot and line represent the time-averaged vortex core location and the principal direction of the oscillating vortex core computed by a principal component analysis (Ringnér Reference Ringnér2008). The vortex core oscillates approximately horizontally along the principal axis inclined  $< 15^{\circ }$ with respect to the $x$ axis (figure 12c) in the canonical case. However, bulk inclinations of approximately $35^{\circ }$ and $-40^{\circ }$ in the $y/L=1/3$ and $y/L=2/3$ planes (figure 12a,b) with substantial vertical motions occurred with the single sidewall cooling.
In-plane trajectory of the vortex core for single sidewall cooling case in (a)  $y/L=1/3$ and (b) $y/L=2/3$ planes, and for (c) base case. The black lines and dots indicate principal directions and time-averaged vortex core locations; standard deviations of horizontal and vertical locations are presented with error bars. (d) Schematics of the time-averaged inclination angles of the LSC, $\alpha$ and $\beta$. The red and blue dots are the time-averaged vortex core locations in $y/L=1/3$ and $y/L=2/3$ planes.
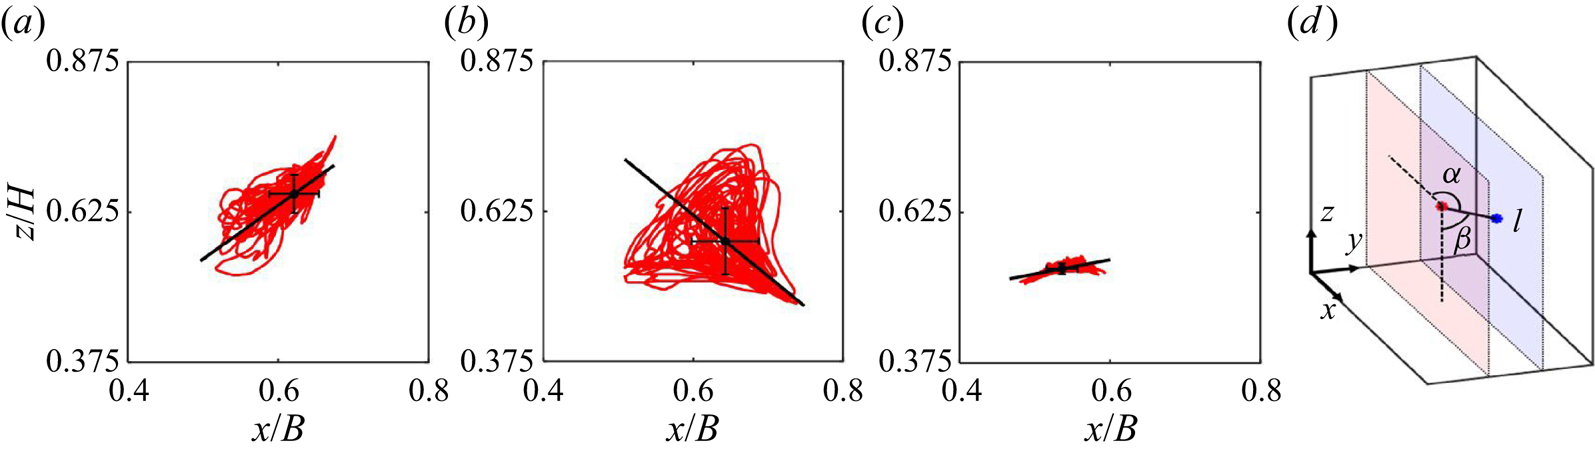
The time-averaged inclination angle of the LSC is obtained by connecting the vortex core locations between the two parallel planes (figure 12d). From this, angles  $\alpha$ and $\beta$ are defined by intersecting the line connecting two time-averaged vortex core locations with the $x$ and $z$ axes, i.e.
 $$ \alpha = \cos^{{-}1}\left(\frac{{\boldsymbol{l}}\boldsymbol{\cdot}\boldsymbol{e_x}} {\left| \boldsymbol{l} \right|}\right),\quad \beta = \cos^{{-}1}\left(\frac{\boldsymbol{l}\boldsymbol{\cdot}\boldsymbol{e_z}}{\left| \boldsymbol{l} \right|}\right). $$
The unit vector  $\boldsymbol {l}/| \boldsymbol {l} |$ points in the direction of the vortex core locations between the $y/L=2/3$ and $y/L=1/3$ planes, and $\boldsymbol {e_x}$ and $\boldsymbol {e_z}$ are unit vectors in the $x$ and $z$ directions. Here, $\alpha \sim 97^{\circ }$ and $\beta \sim 69^{\circ }$, indicating a comparatively large tilting with respect to the $z$ axis and negligible tilting with respect to the $x$ axis. The tilting in $z$ direction shows the effect of single-sided cooling, which pulls down the LSC near the cooling sidewall. Note that $\alpha = \beta =90^{\circ }$ under no tilting.
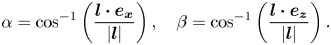
Further insight into the LSC core motions is obtained with the core velocity spectra of the projected in-plane vortex core oscillations in the principal axis,  $\varPhi _c$, which is shown in figure 13. Note the chaotic-like motion $\varPhi _c \propto f^{0}$ in the base case (figure 13c), showing that the base case LSC is essentially not affected by the flow velocity fluctuations, which is mostly driven by buoyancy as shown in figure 8. However, a $\varPhi _c \propto f^{-5/3}$ scaling occurs in the single sidewall cooling cases (figure 13a,b) which is more prominent closer to the sidewall cooling ( $y/L=2/3$, figure 13b). This may be attributed to combining effects of relatively large velocity fluctuation created by the thermal plumes discussed in § 3.1.2 and relatively smaller size of LSC with asymmetric features as indicated in figure 9(b) for the plane closer to the cooling wall. Additionally, a dominant peak in $\varPhi _c$ near the cooling wall is associated with that in the velocity spectra at $y/L=2/3$ (figure 8b). It has a characteristic time scale of the order of the vortex turnover time reminiscing the sloshing, torsional and jump rope vortex LSC modes (Funfschilling, Brown & Ahlers Reference Funfschilling, Brown and Ahlers2008; Zhou et al. Reference Zhou, Xi, Zhou, Sun and Xia2009; Vogt et al. Reference Vogt, Horn, Grannan and Aurnou2018; Ji & Brown Reference Ji and Brown2020; Horn, Schmid & Aurnou Reference Horn, Schmid and Aurnou2021). It is worth pointing out that this scaling holds for the vortex core fluctuation projected to the minor principal axis, not shown for brevity.
Frequency spectra of the velocity of vortex core oscillations with respect to its principal axis,  $\varPhi _c$, for the single sidewall cooling case at (a) $y/L=1/3$ and (b) $y/L=2/3$, and (c) for the base case.
4. Conclusions
Close inspection of the flow at two Rayleigh numbers evidenced a strong modulation of the single sidewall cooling in RB convection on the spatial and temporal features of the LSC and statistics and structure of the flow. In particular, the single-sidewall cooling modulated flow structures in distinct ways. Flow asymmetry was promoted by strong descending motions near the vertical cooling wall, shaping the LSC's spatial features. It also played an essential role in suppressing the flow reversal with a similar effect to tilting the convection cell in a canonical RB scenario. Aside from the asymmetric effects, signatures of lower buoyancy effects may be represented by a lower effective Rayleigh number,  $Ra_{e} = g\alpha \Delta TH_e^{3}/\kappa \nu$, where $H_e$ is the effective height. The lower $Ra_e$ resulted in changes in the bulk velocity fluctuations and larger corner flows, which were dominant closer to the cooling sidewall. In the larger $Ra$ scenario, velocity spectra indicate two scalings, $\varPhi \propto f^{-5/3}$ Kolmogorov (KO41) and $\varPhi \propto f^{-11/5}$ Bolgiano (BO59). Compared with the canonical counterpart, the BO59 scaling appears at relatively high frequencies, suggesting weaker buoyancy effects (i.e. lower $Ra_{e}$) with lateral cooling. For the smaller $Ra$, BO59 scaling is not present. Inspection of the LSC core motion patterns reveals significant multiscale oscillations with spectral scaling implying the modulation of the sidewall cooling compared with the canonical counterpart and the strong linkage with the velocity fluctuations across scales. The oscillation of LSC characterized by projections of the vortex core trajectories evidence larger vortex core motions with the sidewall cooling. The velocity spectra of the vortex core oscillation along its principal axis, $\varPhi _c$, exhibited a negligible relationship between the velocity fluctuations and the LSC oscillation in the canonical RB scenario with a flat $\varPhi _c$. However, a strong relation occurred in the single sidewall cooling case, which was dominant at the plane closer to the sidewall cooling with a $\varPhi _c \propto f^{-5/3}$ scaling and a robust spectral peak frequency of the order of the vortex turnover time.
The dynamics of the LSC and dependence on distinct boundary conditions deserve further exploration; the future effort will focus on exploring this using a Lagrangian perspective and the implications on inertial particles.
Funding
This research was funded by the National Science Foundation, grant no. CBET-1912824.
Declaration of interests
The authors report no conflict of interest.
Appendix A
A.1. Complementary flow fields in the canonical case at  $Ra = 1.6 \times 10^{10}$

Flow statistics in the canonical RB convection in the  $y/L=1/3$ plane are included in figure 14 for comparison with those at the midplane. The mean flow in the $y/L=1/3$ plane shows symmetric LSC similar to the results in the midplane (figure 14a–c). Distributions of second-order flow statistics are also comparable in two planes (figure 14d,e). However, we captured high $TKE$ region in the $y/L=1/3$ plane at the right-hand top corner (figure 14d) that is missed in the midplane due to the PIV FOV there.
Time-averaged distributions of the (a) horizontal and (b) vertical velocity fields, (c) vorticity contours with superimposed in-plane velocity fields, (d) in-plane turbulent kinetic energy, and (e) Reynolds stress for the canonical RB case in the  $y/L=1/3$ plane at $Ra$ = $1.6\times 10^{10}$.
A.2. Flow features at the lower $Ra = 2 \times 10^{9}$

Complementary experiments were conducted with a canonical RB convection and a configuration with single sidewall cooling at  $Ra = 2 \times 10^{9}$ to aid insight. As indicated in § 2, these tests used tanks with half of the dimension of the large set-up, i.e. the smaller rectangular cell has a dimension of $H = 200$ mm, $B = 250$ mm and $L = 125$ mm. The signature of effective Rayleigh number and asymmetry effect discussed for the large scenario applies to the mean flow and the second-order flow statistics at the lower $Ra = 2 \times 10^9$. Also, larger corner flow and tilting structures occurred with sidewall cooling. However, the effects are less dependent on the distance from the sidewall cooling compared with the case with one order of magnitude higher $Ra$ ( $=1.6\times 10^{10}$). It has similar flow structure (figure 15) and $TKE$, Reynolds stress distributions (figure 16), shown for $y/L = 1/3$ and $y/L = 2/3$ planes. In addition, velocity spectra reveal peak frequency that matches the turnover time in the lateral cooling and the canonical cases with the lower $Ra$ (figure 17). However, only the KO41 scaling is dominant, with BO59 scaling no longer observable, suggesting a weaker buoyancy effect at lower $Ra$.
$Ra$.
Time-averaged distributions of the (a) horizontal and (b) vertical velocity fields, and (c) vorticity contours with superimposed in-plane velocity vector fields for RB convection with lateral cooling at  $Ra = 2\times 10^9$ and the canonical counterpart (base case).
In-plane (a) turbulent kinetic energy and (b) Reynolds stress for RB convection with lateral cooling and the canonical counterpart at  $Ra = 2\times 10^9$. The values are normalized by their respective maximum.
(a–c) Power spectra of vertical velocity fluctuations,  $\varPhi _{w'}$, (d–f) compensated forms $f^{5/3}\varPhi _{w'}$ (KO41) and $f^{11/5}\varPhi _{w'}$ (BO59) at the vortex core location (solid line) and at $\Delta x/B=0.2$ from the vortex core in the horizontal direction (dashed line) for the single sidewall cooling $Ra$ = $2\times 10^9$ case at (a,d) $y/L = 1/3$ and (b,e) $y/L = 2/3$. (c,f) Canonical counterpart (no sidewall cooling).
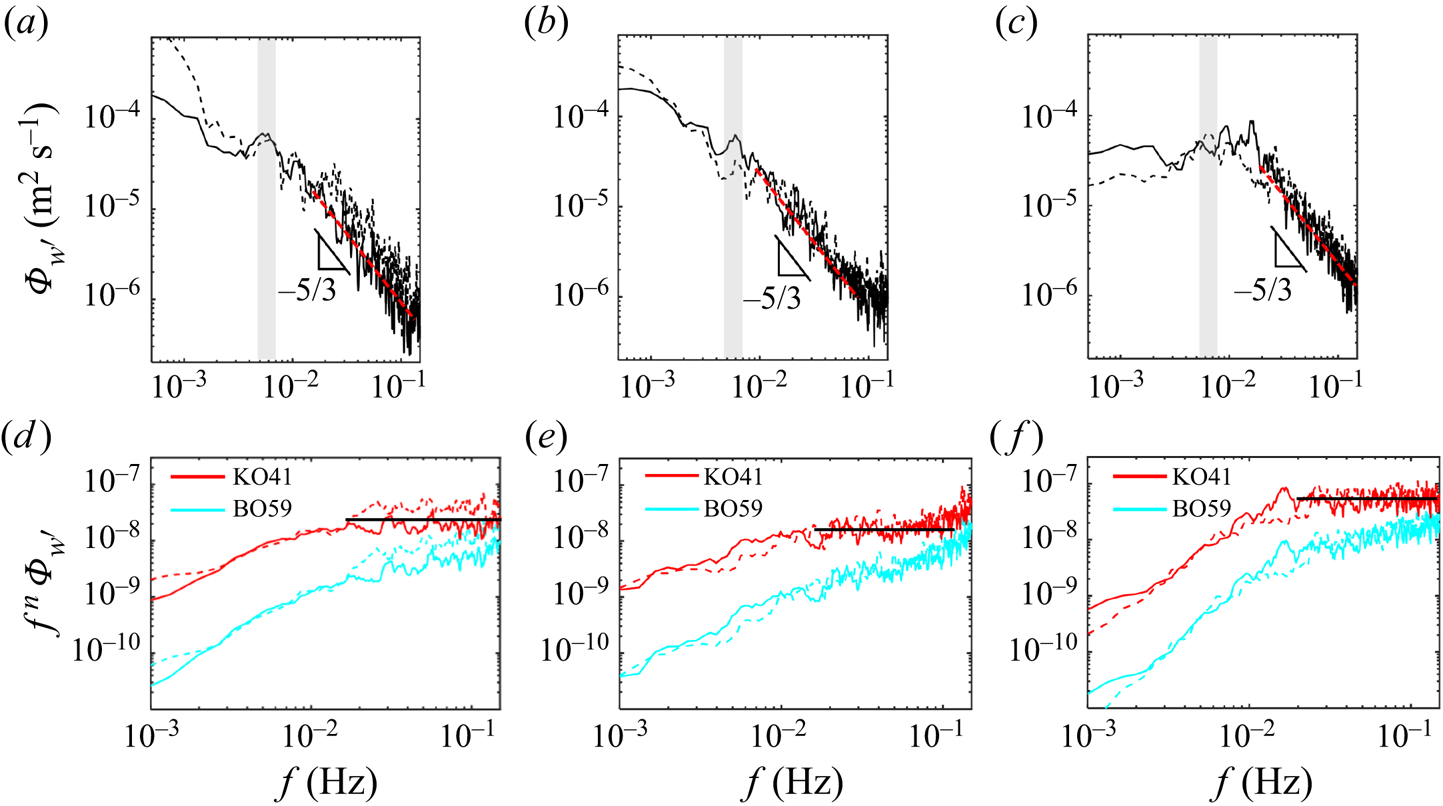


 Open access