


Governments have been negotiating climate treaties since the early 1990s, but global greenhouse gas emissions and temperatures have continued to rise. Climate scientists project that temperatures will increase roughly 4°C by 2100 if emissions follow their historical trends. Early climate treaties, such as the 1997 Kyoto Protocol, did little to alter global emissions trends, and contemporary modeling suggested they would hardly influence global temperatures.Footnote 1 After nearly two decades of lackluster multilateral climate negotiations, the 2015 Paris Agreement enshrined a new global goal of limiting temperature rise to between 1.5°C and 2°C; nonetheless, governments continued to fall short of the challenge, as the sum of their pledged climate targets allowed roughly 3°C of warming.Footnote 2 However, governments finally began to close this ambition gap at the 2021 Glasgow climate summit, where they submitted updated targets as part of the Paris Agreement’s ratchet process. Recent modeling suggests the Glasgow targets would hold global warming to under 2°C by 2100—in line with the Paris Agreement’s goal (Figure 1).Footnote 3 Climate treaties have committed to progressively stronger mitigation, bringing us closer to the 1.5°C goal.
Progress in projected temperature change across climate treaties
Notes: Average global temperature (°C, relative to 1850–1900 mean) time series in black. Dashed lines pass through the median temperature projection for each treaty. Author’s calculations, based on Meinshausen et al. (Reference Meinshausen, Jared Lewis, Johannes Gütschow, Burdon, Cozzi and Hackmann2022), Rogelj et al. (Reference Rogelj, Michel Den Elzen, Taryn Fransen, Harald Winkler, Sha, Riahi and Meinshausen2016), and Wigley (Reference Wigley1998).

That the ratchet process seems to be working is surprising for theories of international climate politics. The dominant perspective emphasizes how collective-action problems, especially enforcement problems, have undermined international climate treaties.Footnote 4 Nothing about the Paris Agreement or the Glasgow Climate Pact suggests these problems have been overcome (for example, by adding enforcement powers);Footnote 5 yet we observe more ambitious targets. Recent research argues that international collective-action problems are not the principal reason climate action has been weak and argues instead that powerful domestic interest groups—such as the fossil fuel industry and carbon-intensive industries—block policy.Footnote 6 However, this distributive-conflict perspective is better at explaining stasis than simultaneous enhanced ambition. How has the observed progress in climate governance come about?
I advance debates on international cooperation by studying iterated mitigation targets in climate treaties. I emphasize the conditional nature of cooperation as it has evolved over time. In principle, states could condition their mitigation actions on others’ behavior in different ways. From an enforcement perspective, states might react negatively to increase their emissions opportunistically when their peers reduce their own.Footnote 7 In this situation, free riders gain a competitive advantage in global markets that contributors struggle to rectify due to anarchy. By contrast, the distributive-conflict perspective downplays international dynamics and suggests that mitigation decisions primarily reflect domestic policy battles. For these scholars, climate policy is unconditional since governments are mostly attuned to domestic actors who are rarely concerned about international coordination.Footnote 8
The Paris Agreement articulates a different logic. Here, governments recognize they are caught in a suboptimal outcome and make periodic efforts to escape it through reciprocity. Climate governance has been marred by distrust and noncooperation, so mitigation needs to be supported by gradual conditional commitments. The pledge-and-review process allows governments to observe their counterparts’ behavior and tailor their actions to match.Footnote 9 I argue conditional cooperation is most likely to develop among states that are already closely connected politically and have extensive shared experience governing global problems. These political networks are formed by joint membership in international organizations (IOs), where states develop long-standing relationships that enable them to govern across issues.Footnote 10 Institutional design supports conditional cooperation when it sequences cooperation through iterated pledges that states can strengthen over time. In this context, prior climate action enables future cooperation.Footnote 11 If the ratchet process works, then it will drive what Sachs calls an “upward spiral of increasing ambition.”Footnote 12
Enforcement, conditional cooperation, and distributive conflict, therefore, offer three contrasting perspectives for explaining climate politics. I derive empirical expectations about the Paris Agreement’s ratchet process for each perspective and ground these in a common spatial modeling framework.
The enforcement perspective expects countries to weaken their targets when their peers set strong targets. This emerges from concerns about economic competitiveness, where states can gain an advantage over their competitors, particularly within trade networks.
Conditional cooperation expects countries to strengthen their targets when their peers set strong targets. States work through their existing political networks to achieve conditional cooperation, where prior governance experience facilitates regulatory convergence and alleviates domestic opposition.
Distributive conflict does not expect countries to adjust their targets based on peers’ behavior because the key domestic interest groups that dominate climate policy have fixed preferences for or against mitigation. From this perspective, climate policy decisions are not conditional.
I investigate these claims with spatial regression models predicting states’ Glasgow climate targets as a function of their previous Paris targets and their trade- and IO-weighted peers’ Paris targets. I find evidence of conditional cooperation, where governments are more willing to strengthen their targets when their political partners set strong targets. I find no evidence that trade networks undermine cooperation. This suggests that the United Nations climate regime may be able to sustain progressively stronger climate action.
This study contributes new analysis of the Paris Agreement’s mitigation targets and ratchet mechanism.Footnote 13 I document progress in targets and explain how these diffuse within networks. This study also helps to bridge debates between the domestic and international politics of climate change by specifying expectations from different perspectives and studying these in a common empirical framework.Footnote 14 I find strong evidence for international drivers of climate policy, which have been neglected by the distributive turn in climate research. This study also makes a theoretical contribution by recasting how conditional cooperation should work—namely, through networks of peers—which helps situate climate change within broader debates on interdependence.Footnote 15
Theories of International Climate Politics
Climate change mitigation has challenging public goods characteristics.Footnote 16 Mitigation is individually costly and generates climate-stability benefits that mostly accrue globally, over time, and are not excludable from others who do not mitigate. Theory expects mitigation’s individual costs to outweigh its individual benefits for every state, which implies that no state will mitigate aggressively. This creates a collective-action problem, where individually rational decisions lead to collectively inefficient outcomes because governments undermitigate (or overpollute) and thereby cause dangerous global warming. The obvious solution is to craft an agreement that binds states to reducing their emissions.Footnote 17 But anarchy means there is no international authority to enforce agreements, and states have incentives to free ride on others’ contributions when agreements prescribe substantial adjustment costs.Footnote 18 This reasoning underpins the dominant perspective on climate politics, which argues mitigation is underprovided due to enforcement problems.
Recent research points to domestic distributive conflict as an alternative explanation.Footnote 19 Distributive conflicts pit interest groups that support climate action against those that oppose it. Decarbonization benefits groups that are vulnerable to the impacts of climate change and those that provide key inputs for the energy transition. But it threatens fossil fuel companies, their upstream and downstream partners, and the livelihoods of communities linked to these industries.Footnote 20 They mobilize against mitigation using misinformation, lobbying, and relocation threats.Footnote 21 Climate policy stalls out when political institutions empower incumbent polluting interests.Footnote 22 From this perspective, governments undercontribute to mitigation because anti-climate-action groups have historically been stronger than pro-climate-action groups in most countries’ domestic politics.
This revisionist approach seeks to correct for the literature’s apparent overemphasis on enforcement problems.Footnote 23 To emphasize the significance of domestic politics, these studies often argue that international collective action is mostly irrelevant for explaining mitigation.Footnote 24 For example, Aklin and Mildenberger argue governments “can be insulated from the pressures of free riding” because they must satisfy domestic constituencies, such as fossil fuel companies and the broader public, who seem to “not care about reciprocal action.”Footnote 25 Here, the Paris targets are “nationally determined” in the literal sense that they summarize unconditional national positions on climate rather than iterated pledges that might respond to behavior in other countries. I argue that this approach, despite usefully highlighting the role of fractious domestic politics, risks overcorrecting and missing important international dynamics that have arisen with the Paris Agreement.
Ultimately, both enforcement and distributive conflict struggle to explain the Paris Agreement’s ratchet process. Each perspective provides stronger explanations for policy stasis than for reform. Climate treaties did not add enforcement powers, nor did pro-climate groups win in every jurisdiction, so neither perspective provides reasons for why most governments would strengthen their targets so quickly. We need another perspective to explain why states simultaneously upgraded their targets.
I argue that conditional-cooperation theory is a promising alternative. Its core contention is that actors are willing to contribute more private resources to collective projects when other actors contribute more of their own. Fischbacher and his colleagues show this with a public goods game where participants contribute conditional on other participants’ aggregate contributions.Footnote 26 They find that roughly half of participants contribute more when others make larger contributions. By contrast, only one-third of participants free ride (by never contributing), and many of the others contribute unconditionally.
These ideas have some affinity with institutionalist theory that shows international cooperation is possible under anarchy.Footnote 27 Cooperation is often built on reciprocity, where states make roughly equivalent reforms to address a problem. When interactions are iterated, states can condition their behavior on previous actions. Combining reciprocity with iteration allows gradual cooperation, as states build reputations for cooperativeness and the shadow of the future disciplines defection. Many institutions, such as those governing ozone-depleting substances, are designed to promote incremental cooperation, where states begin with limited concessions and strengthen these in negotiating rounds. In the ozone regime, a handful of states with self-interested reasons to restrict their pollution were willing to move first, and they structured institutions to expand in membership and scope over time.Footnote 28 This can be particularly helpful in situations with high uncertainty, like climate change, because gradualism can use reciprocity to build trust among participants, and incremental reforms allow states to adjust their behavior as they learn about policy consequences.Footnote 29
The Paris Agreement’s ratchet mechanism crystallizes this intuition. Here, states pledge initial targets and are tasked with updating them periodically. Sælen models this and finds that when initial targets are already ambitious, they drive further ambition.Footnote
30
Milkoreit and Hale each articulate a similar logic, where initial leadership by a core (“° $k$
-group”) of environmentally inclined governments can jump-start mitigation that becomes self-sustaining.Footnote
31
Dai anticipated some of the regime’s eventual transformation at Paris and argues that pro-compliance domestic constituencies can pressure governments to act by benchmarking them against treaty goals and peers.Footnote
32
The ratchet process also harnesses temporal focal points to define key moments in the negotiation cycle when domestic and international peer pressure can be exerted before new targets are due.Footnote
33
Once climate action passes some minimum threshold, it can be stable and strengthen over time. Conditional cooperation could support the ratchet process.
$k$
-group”) of environmentally inclined governments can jump-start mitigation that becomes self-sustaining.Footnote
31
Dai anticipated some of the regime’s eventual transformation at Paris and argues that pro-compliance domestic constituencies can pressure governments to act by benchmarking them against treaty goals and peers.Footnote
32
The ratchet process also harnesses temporal focal points to define key moments in the negotiation cycle when domestic and international peer pressure can be exerted before new targets are due.Footnote
33
Once climate action passes some minimum threshold, it can be stable and strengthen over time. Conditional cooperation could support the ratchet process.
But this work has paid relatively little attention to how states are positioned differently in climate politics, which is one of the core insights from the distributive-conflict perspective. Fischbacher and his colleagues assume undifferentiated actors with the same preferences and no pre-existing relationships.Footnote 34 This assumption simplifies the theory and experiments, but we know that in practice, states differ. Recent work by Hale starts with actor heterogeneity to develop a theory of “catalytic cooperation.”Footnote 35 He shows that relaxing core assumptions in public goods models—to add co-benefits, preference heterogeneity, or increasing returns to mitigation—transforms the cost–benefit calculus to support action. Mitigation might still be underprovided relative to efficient levels, but states might have reasons to begin mitigation irrespective of others’ contributions. However, even in this extension, mitigation is still undertheorized because the relationships between states are not addressed.
Peer Networks in International Climate Politics
I argue for an alternative reason for mitigation that emphasizes how states are positioned in international peer networks. This argument incorporates the idea, from the distributive-conflict perspective, that states differ and do not all have the same interests. But it also incorporates a much larger role for international collective action, where governments account for the behavior of other countries in their economic and political networks. This has affinities with policy-diffusion research that emphasizes how economic, political, and social networks influence state behavior.Footnote 36 Within these networks, states have closer ties to some peers, rather than being equally affected by all other states or solely affected by the hegemon. Networks also differ in the kinds of interactions states have, such as economic, social, or political connections, which can have positive or negative effects. I focus on economic peer networks that manifest through bilateral trade flows, and on political peer networks that manifest through joint membership in IOs.
Peers are especially important in climate politics given the nature of the cooperation problem. Mitigation costs reflect both a state’s own mitigation choices and peers’ choices. Climate reforms generate a range of competitiveness concerns through their impacts on trade. To see this, consider a situation where a country enacts costly reforms, but its main trade partners do not. This is collective action’s “sucker’s payoff” because it generates a range of material costs for the reformer. Imports of unregulated foreign goods outcompete more expensive regulated goods in the home market; exports of regulated goods become uncompetitive in unregulated peers’ markets; and exports of regulated goods become uncompetitive in third markets relative to unregulated peers’ exports. These concerns are acute in energy-intensive, trade-exposed (EITE) sectors—such as steel or chemicals—where carbon pollution is high and goods compete in global markets with thin margins.Footnote 37 Therefore, governments hesitate to regulate domestic firms of this kind to higher standards than their trade partners.
To counteract these competitive dynamics, governments may combine climate reforms with trade restrictions that adjust for uneven regulations, such as the European Union’s carbon border adjustment mechanism, which is set to begin in 2026. In practice, however, there may be more examples of unilateral reforms containing carve-outs for trade-exposed domestic industries than ones that require peers to match costs. Canada’s national carbon price rebates EITE firms, such as those in the oil industry that accounts for roughly 30 percent of national emissions, because Canada’s largest trade partners—the US, China, and Mexico—do not uphold an equivalent carbon price. The European Union, similarly, freely allocates emissions allowances to minimize competitiveness impacts.
If all governments enact equivalent reforms, then regulatory costs are roughly equal. Firms’ total costs will increase, but they should increase roughly proportionately, given similar endowments, like access to clean electricity or economies of scale. This minimizes concerns about carbon leakage, undercuts relocation threats, and dampens domestic opposition to climate policy. To see this, consider how regulatory harmonization fractures the bloc of carbon majors and EITE firms that have jointly opposed mitigation. Carbon majors, such as coal mining and oil companies, will oppose climate policy no matter how it is implemented because it has existential stakes for them.Footnote 38 However, harmonized reforms establish an even playing field for EITE firms, and they may even support the energy transition in the right regulatory environment.Footnote 39
Synchronizing these reforms across jurisdictions is challenging because governments disagree on the desirable pace of reforms and struggle to credibly commit to maintaining them, and because reneging has arbitrage opportunities. Current institutions do not align climate and trade policy, leaving these to evolve in a decentralized fashion. As a result, the carbon-intensive status quo should be sticky if trade ties place an upper limit on climate policy.
States can find pockets of assurance within their political networks. Matching contributions across countries requires coordination on a common level of effort and assurances that reforms will not be undercut by peers. I argue these conditions are easier to meet when states have political relationships built through joint experience governing global problems.
States’ resources for checking other states’ behavior are limited, so they must prioritize. Trade partners are a natural reference point since they can impose the highest costs. But because states govern many global issues simultaneously, they also develop long-standing relationships with the peers with whom they interact frequently in IOs. Within these networks, states develop better information on their counterparts’ preferences, including the level of contributions they usually make and the sincerity of those commitments. These peer groups become the starting point for coordinating policy.
Costly mitigation policies require some assurance that others will reciprocate, and when peers have previously made contributions, even small ones, these signal some willingness to cooperate.Footnote 40 When embedded in a broader structure of joint governance experiences, this builds trust among peers that supports collective action.Footnote 41
Political networks also facilitate monitoring. Since governments that share many IO memberships interact more often, their diplomats have more incentives to check in on implementation and compliance in these peer countries. They can use these meetings to clarify concerns, learn about challenges, and apply pressure to lagging governments. These dense governance networks discipline reneging because its consequences may ripple through to many other issues.Footnote 42
Joint memberships in IOs create durable political relationships, wherein governments can exchange mutual concessions and enact reciprocity. Copelovitch and Putnam find support for this in treaty design.Footnote 43 They find that states design agreements with less dispute resolution and fewer escape clauses when members have high levels of prior joint IO membership. States in these highly institutionalized relationships rely less on formal mechanisms to enforce agreements among them. Other studies document how states’ joint memberships in IOs create political ties that lead to policy convergence.Footnote 44 Institutional design can support these processes when institutions articulate clear goals that domestic groups can use to benchmark progress and when they create focal moments to concentrate efforts on upgrading cooperation.Footnote 45 Simultaneous climate action in peer countries sets a global benchmark that makes undercontributing more visible. Overall, political networks can support mutually reinforcing mitigation policies.
Survey experimental research also supports the idea that mitigation in other countries facilitates domestic action. Bechtel and Scheve find that respondents are more supportive of their government’s participation in climate agreements when more other countries join and when these countries represent a higher share of global emissions.Footnote 46 Bechtel, Scheve, and Lieshout also show that these multilateral agreements are perceived as more effective and fair.Footnote 47 Beiser-McGrath and Bernauer show similarly that respondents are more supportive of domestic mitigation when other countries have previously decreased their emissions.Footnote 48 Thus this research provides strong microfoundations for multilateral climate cooperation. However, while these studies buttress my argument about conditional cooperation, they generally rely on stylized examples of mitigation in other countries. My application moves from survey experiments to observed state behavior, as well as from the mitigation contributions of “other countries” to the specific contributions of other relevant countries in economic and political networks.
Empirical Expectations
The evidentiary basis for each of the three perspectives—enforcement, conditional cooperation, and domestic distributive conflict—is relatively thin. Few papers have made empirical contributions to this debate. The enforcement perspective can declare that cooperation should be weak when institutions cannot prevent noncompliance and reason from that to explain mitigation’s apparent underprovision.Footnote 49 The distributive-conflict perspective notes that governments have enacted some reforms despite existing treaties being weak, and uses this to rebut collective-action arguments.Footnote 50 However, this perspective generally fails to go a step further and consider whether climate policy could be stronger if other countries also contribute. Conditional cooperation mostly relies on anecdotal reports that governments have set conditional targets. Harrison’s study of the 1997 Kyoto Protocol reports that Canadian negotiators were instructed to set a target 1 percent above Washington’s target.Footnote 51 Dimitrov traces a similar dynamic at the 2009 Copenhagen negotiations, but it remains unclear how this generalizes.Footnote 52
One challenge with evaluating these perspectives empirically is that states’ undercontribution to mitigation seems overdetermined because both enforcement and distributive conflict expect it. However, the Paris Agreement’s ratchet mechanism provides an opportunity where the three perspectives make different predictions because it focuses on changes in targets. The ratchet tasks governments with submitting stronger targets, and states can condition their behavior on others’ targets. I use the ratchet process as an opportunity to reformulate the arguments from the enforcement, conditional-cooperation, and distributive-conflict perspectives as empirical expectations about how interdependence shapes mitigation targets.
The enforcement perspective expects that mitigation in one country will be offset by opportunistic behavior in others. Kennard and Schnakenberg formalize this insight to show that as some countries mitigate—which we observe in the Paris targets, even if mitigation remains underprovided relative to ideal levels—other countries should increase their emissions to use more of the remaining global emissions budget.Footnote 53 Mitigation’s public goods characteristics create incentives to undermine others’ efforts by making negative mitigation contributions, or increasing home emissions when other countries mitigate. While collective-action theory generally proceeds from the assumption that states are undifferentiated, the prior discussion of mitigation’s competitiveness impacts through trade suggests opportunistic behavior should be acute in trade networks. Therefore, I reformulate the enforcement perspective from a network perspective to say that countries will ratchet less when their peers in trade networks set strong targets.
H1 Enforcement/economic competition hypothesis: States will weaken their mitigation contributions when their peers in trade networks set strong targets.
Conditional cooperation predicts the opposite response. The institutional design of the ratchet process allows states to observe their peers’ contributions and set stronger targets over time if peers also mitigate. And this effect should be stronger in political networks, where states build on their experience governing global problems to support climate action. Countries might strengthen their targets but still fall short of the 1.5°C goal collectively, with the implication that mitigation remains underprovided. Nonetheless, evidence of conditional cooperation could provide insight into the climate regime’s ability to close its ambition gap over time.
H2 Conditional cooperation/political reciprocity hypothesis: States will strengthen their mitigation contributions when their peers in political networks set strong targets.
The distributive-conflict perspective does not have a dynamic mechanism tied to the negotiations that affects states differently. From this perspective, climate policy reflects the relatively exogenous alternation between pro-climate-action and anti-climate-action groups for control over domestic political institutions. These groups, as Aklin and Mildenberger have shown, care more about the impacts of climate reforms on their assets than about whether reforms are coordinated multilaterally.Footnote 54 Therefore, the distributive-conflict perspective expects that the climate targets of peer countries should not affect the ratchet.
H3 Unconditional/distributive-conflict hypothesis: States’ mitigation contributions will not be related to peers’ targets.
Target-Setting in the UN Climate Regime
I investigate conditional cooperation in UN climate treaties. Studying how cooperation unfolds over time requires a relatively stable institutional context where governments make iterated public commitments, which other governments can observe and use to tailor their own. The ideal empirical context would have all states make rounds of commitments. The Paris Agreement’s pledge-and-review process approximates this by inviting all countries to submit climate mitigation commitments every five years that are hosted by the UN climate secretariat. I study the universe of climate mitigation targets under the Paris Agreement and its successor, the Glasgow Climate Pact.
Though it was not without its critics, the 2015 Paris Agreement was mostly hailed as a breakthrough.Footnote 55 Negotiations on a successor to the Kyoto Protocol had failed in 2009, and it expired in 2012, leaving an institutional void. The Paris Agreement introduced three key innovations in mitigation target-setting. First, all states are expected to undertake climate action. Paris encourages states to “self-differentiate” and select a level of action that reflects their domestic political circumstances and development priorities.
Second, states now presubmit their mitigation pledges, which become a nonbinding annex to the treaty. Although prior multilateral negotiations over targets collapsed, Paris’s new pledge system ensures that some deal will exist, even if it may not be aligned with strong mitigation. These pledge documents are called nationally determined contributions (NDCs).
Third, to bridge the gap between the Paris Agreement’s aspirational temperature goals and the weak first NDCs, states introduced a “ratchet mechanism,” wherein all parties update their climate targets on a five-year cycle. The treaty text sets an expectation that targets will reflect each country’s “highest possible ambition” and “progres[s] over time” to limit warming to “well below 2°C.” The ratchet mechanism’s first iteration took place at COP26 in Glasgow, which was postponed from November 2020 to November 2021 due to the coronavirus pandemic.
The Glasgow ratchet was successful. A hundred and sixty countries, representing roughly 94 percent of global emissions, submitted new NDCs before the Glasgow conference. This is a slight drop-off from the 190 countries, representing 95 percent of emissions, that submitted NDCs in Paris. At the global level, one study estimates that, if fully implemented, the Glasgow pledges would lead to 1.9°C of warming (1.4 to 2.8°C with 90 percent confidence intervals) by 2100.Footnote 56 This suggests a real improvement on the 2015 Paris pledges, which if fully implemented were estimated to lead to warming of 2.1 to 3.2°C, and an even greater improvement over “business as usual” baselines that project roughly 4°C.Footnote 57
These global aggregates mask variation in the strength of national targets. The Paris Agreement entailed a compromise, wherein all countries submitted NDCs, but without requirements on content. Countries submitted targets indexed to a historical base year (for example, Canada’s 40 percent reduction from 2005 levels), a projected future emissions level (such as Mexico’s 21.2 percent reduction from projected emissions levels under a no-policy baseline), or some other variable (like China’s pledge to reduce the GHG intensity of economic production by 60 percent from 2005 levels), among other idiosyncratic formats. This means some NDCs are ambiguous or lack information about their reference emissions levels that would be needed for quantification. In this study I use the subset of countries that have quantifiable 2015 and 2021 NDCs.
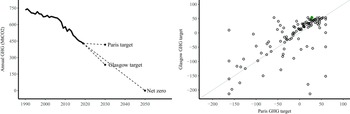
The generic updated NDC replaces existing percentage goals with more ambitious ones. For example, in December 2020, the UK government updated its target to reduce GHG emissions by 68 percent from 1990 levels, compared to 37 percent from 2005 levels (Figure 2). A hundred and twelve countries have quantifiable NDC targets in both rounds of target-setting. Overall, seventy-three countries submitted stronger targets in their updated NDCs, nine held theirs constant, and thirty weakened them.
Ratcheted climate mitigation targets
Notes: The United Kingdom’s 2021 target enhances its 2015 target (left). Most countries ratcheted and pledged further emissions cuts in 2021 (right; UK flagged in green closed circle). Values above zero indicate percentage emissions reductions from 2010 levels; values below zero indicate percentage emissions increases from 2010 levels. Values winsorized at the 5th and 95th percentile.

The degree to which these targets improve over their previous targets also varies. Figure 2 plots countries’ Paris mitigation targets against their Glasgow mitigation targets. Countries that submitted stronger updated targets lie above the reflection line, and in this subset, the median country improved its target by fourteen percentage points. Countries that submitted weaker targets lie below the reflection line, and in this subset, the median country weakened its target by forty percentage points. I discuss emissions trajectories for developing countries in more detail in the online supplement.
Figure 3 illustrates countries that submitted enhanced NDCs. We can see that European and North American countries tended to improve their targets, while some developing countries in Africa and Asia weakened theirs. Nonetheless, the regions are diverse, which highlights one of the advantages of the spatial modeling approach I adopt here. Spatial modeling captures these connections through a connectivity matrix that links all countries based on the intensity of their interactions. Regional intercepts are also often used to adjust for differences across regions statistically and can account for further unobserved heterogeneity, but these assume that all states in a defined region are impacted equally. I prefer the spatial approach, but discuss results with regional fixed effects in the online supplement (section SM-3.1).
Mitigation enhancement of 2021 NDCs compared to 2015 NDCs in percentage terms
Notes: Most countries ratcheted and pledged further emissions cuts (green), while some countries held their pledges constant (light gray), and others weakened their mitigation targets in their updated NDCs (purple). Many countries submitted nonquantifiable NDCs or did not submit updated NDCs (white).

Research Design
Updated Climate Targets
My outcome variable is the stringency of states’ updated 2021 climate mitigation targets. Climate targets are observed in 2015 and 2021, ahead of the Paris and Glasgow climate summits, respectively. Thus each country’s 2021 target can be benchmarked against its 2015 target. I convert each country’s 2015 and 2021 NDCs into absolute emissions levels and then into percentage changes from 2010, with higher values indicating larger reductions—greater ambition or stringency. While measuring targets in percentages might seem to imply that all countries ought to mitigate equally, which would contravene the climate regime’s norm of common but differentiated responsibilities, in practice this measure simply isolates the difference in mitigation between the first and second targets and accounts for persistent differences between countries which are absorbed in the first target’s level. Country-specific, time-invariant traits that affect targets are absorbed in the 2015 target, like a lagged dependent variable.
Peers’ Climate Targets
My argument suggests two dimensions of spatial interdependence: trade ties create concerns about economic competitiveness, and political ties help in coordinating collective action. Methodological work suggests these should be specified in separate connectivity matrices.Footnote 58
For the economic-competition argument, competitiveness manifests through trade networks, where high levels of domestic regulation can disadvantage firms in less regulated global markets. I measure economic connectivity between countries using dyadic trade flows. I build an $n \times n$
matrix
$n \times n$
matrix ${\bf{Trade}}$
that represents the row-standardized value of bilateral trade. This connects each country
${\bf{Trade}}$
that represents the row-standardized value of bilateral trade. This connects each country $i$
to every other country
$i$
to every other country $j \ne i$
by their dyadic trade relative to their total trade. I aggregate trade in 2016 to 2019 using data from UN Comtrade and the Centre d’études prospectives et d’informations internationales (CEPII).Footnote
59
I build separate matrices for total trade and trade in EITE sectors, defined as aluminum, cement, chemicals, fertilizer, iron, polymers, and steel.
$j \ne i$
by their dyadic trade relative to their total trade. I aggregate trade in 2016 to 2019 using data from UN Comtrade and the Centre d’études prospectives et d’informations internationales (CEPII).Footnote
59
I build separate matrices for total trade and trade in EITE sectors, defined as aluminum, cement, chemicals, fertilizer, iron, polymers, and steel.
Row standardization adjusts the influence of each country’s trading partners in proportion to the country’s total trade exposure. It also implies that all countries are equally exposed to economic competition in trade networks because their total trade ties sum to unity. Neumayer and Plümper note that this approach neutralizes level effects, which may be inappropriate if countries experience larger spatial stimulus when they are more open to trade.Footnote 60 However, all governments encounter competitiveness pressures once they are integrated into the global economy. On integration, the primary concern shifts to the degree of policy divergence from peers rather than total trade exposure. Row standardization maintains the relative importance of each trade partner; for instance, a partner representing 40 percent of a country’s trade will contribute equivalently to its spatial lag, regardless of a country’s total trade volume. This method subtly alters the significance of trade partners across dyads because, for countries with the same total trade value, a partner’s influence is magnified in countries that trade less. But this is an appropriate operationalization when governments are focused on regulatory harmonization with their most important trading partners.
Consider the United States. Concerns about decarbonization in key trade partners—particularly EITE industries in China, which represent 10 to 15 percent of US trade—have led successive administrations to increase tariffs and enact industrial policies to enhance domestic competitiveness. Yet the United States is among the countries with the lowest trade exposure, defined as imports plus exports as a share of GDP. This suggests that the spatial stimulus is substantial even in relatively closed countries. Nonetheless, I evaluate a non-row-standardized measure in the supplementary materials and find similar results (section SM-2.3).
The political-ties argument emphasizes that politically close countries can overcome collective-action problems and enact reciprocal reforms. I build on the literature that uses joint membership in IOs to measure political ties. I construct a second $n \times n$
matrix
$n \times n$
matrix ${\bf{IOs}}$
that represents the row-standardized sum of common membership in IOs. This connects each country to every other country by their overlapping institutional memberships in formal and informal IOs.Footnote
61
${\bf{IOs}}$
that represents the row-standardized sum of common membership in IOs. This connects each country to every other country by their overlapping institutional memberships in formal and informal IOs.Footnote
61
I multiply each of these connectivity matrices by an $n \times 1$
vector of lagged climate targets to create a continuous, country-level measure of the stringency of peers’ climate targets in the 2015 Paris Agreement. These measures differentiate between countries whose partners set strong or weak prior targets. I rebase all mitigation targets as percentage changes from a common 2010 base year, which puts them all on the same scale, removes opportunistic reporting, and reflects governmental and public discussion of targets. Using a reference year in the past will attenuate percentage reductions for countries that began mitigating before the Paris Agreement was adopted. However, very few countries had made serious prior efforts, so this is not a major measurement concern. For example, Bayer and Aklin estimate that the European Union’s emissions-trading scheme, widely considered one of the strongest early climate policies, reduced members’ emissions by roughly 0.5 percent per year from 2008 to 2016.Footnote
62
$n \times 1$
vector of lagged climate targets to create a continuous, country-level measure of the stringency of peers’ climate targets in the 2015 Paris Agreement. These measures differentiate between countries whose partners set strong or weak prior targets. I rebase all mitigation targets as percentage changes from a common 2010 base year, which puts them all on the same scale, removes opportunistic reporting, and reflects governmental and public discussion of targets. Using a reference year in the past will attenuate percentage reductions for countries that began mitigating before the Paris Agreement was adopted. However, very few countries had made serious prior efforts, so this is not a major measurement concern. For example, Bayer and Aklin estimate that the European Union’s emissions-trading scheme, widely considered one of the strongest early climate policies, reduced members’ emissions by roughly 0.5 percent per year from 2008 to 2016.Footnote
62
Estimation
I estimate the effect of peers’ mitigation targets on a country’s own updated climate target using ordinary least squares (OLS) regression, with a spatial regressor and a lagged measure of targets. Countries’ 2021 Glasgow targets are the outcome variable, with the 2015 Paris targets included as a regressor, which isolates changes between the initial and the ratcheted target. This empirical strategy’s strength is that the 2015 target acts as a lagged outcome variable, absorbing time-invariant, country-level factors that affect climate targets.
The primary explanatory variables are spatial lags for the trade-weighted and IO-weighted climate policy of peers, whose effect is identified by controlling for previous targets. This estimation strategy assumes no confounding between the spatially lagged climate policy terms and the 2021 targets. Research has struggled to identify a consistent set of cross-national predictors of climate policy. Most candidate factors are relatively stable over time, and the relatively short observation period between 2015 and 2021 implies they should be well accounted-for with the lagged outcome variable. To address confounding, I include specifications that control for fossil fuel rents, industrial composition, total trade exposure, and renewable electricity generation.
I use OLS to estimate versions of the following spatial lag of $x$
(SLX) model:
$x$
(SLX) model:
 $${\rm{GlasgowTarge}}{{\rm{t}}_{i,2021}} = \alpha + \beta {\rm{ParisTarge}}{{\rm{t}}_{i,2015}} + \theta {\bf{W}}{\rm{ParisTarge}}{{\rm{t}}_{j \ne i,2015}} + {\varepsilon _i}$$
where $\theta $
estimates the effect of weighted peers’ prior climate targets. I swap two types of connectivity matrices
$\theta $
estimates the effect of weighted peers’ prior climate targets. I swap two types of connectivity matrices ${\bf{W}}$
across specifications:
${\bf{W}}$
across specifications: ${\bf{Trade}}$
and
${\bf{Trade}}$
and ${\bf{IOs}}$
. Each spatial lag varies by country
${\bf{IOs}}$
. Each spatial lag varies by country $i$
, as it reweights other countries’ 2015 Paris mitigation target by their dyadic trade or joint membership in IOs.
$i$
, as it reweights other countries’ 2015 Paris mitigation target by their dyadic trade or joint membership in IOs.
The main coefficient of interest is $\theta $
, where positive coefficients indicate conditional cooperation, negative coefficients indicate free riding, and coefficients indistinguishable from zero indicate no conditional dynamics. The SLX model does not introduce the same concern about simultaneity bias as spatial autoregression models, because the outcome variable does not appear on both sides of the equation, so it can be estimated by OLS.Footnote
63
Similarly, SLX estimates spatial spillovers directly in
$\theta $
, where positive coefficients indicate conditional cooperation, negative coefficients indicate free riding, and coefficients indistinguishable from zero indicate no conditional dynamics. The SLX model does not introduce the same concern about simultaneity bias as spatial autoregression models, because the outcome variable does not appear on both sides of the equation, so it can be estimated by OLS.Footnote
63
Similarly, SLX estimates spatial spillovers directly in $\theta $
, which can take values greater than
$\theta $
, which can take values greater than $\left| 1 \right|$
, unlike how spatial autoregression models require interpreting indirect effects through a combination of the model parameters and the connectivity matrix.Footnote
64
$\left| 1 \right|$
, unlike how spatial autoregression models require interpreting indirect effects through a combination of the model parameters and the connectivity matrix.Footnote
64
Data for these variables are public. I hand-code 2015 and 2021 mitigation targets from countries’ NDCs. Total trade flows are from CEPII, which is derived from UN Comtrade, from which I take the sectoral trade data. Controls are from the World Bank. Missing covariates and trade data are multiply imputed. The mitigation targets have outliers at both extremes, so I winsorize these variables at the fifth and ninety-fifth percentiles. More details, summary statistics, and alternative specifications are given in the online supplement.
Results
Table 1 investigates the economic-competitiveness argument. Higher values of the dependent variable indicate larger emissions cuts, or better targets. The key coefficient of interest is $\theta $
on the
$\theta $
on the ${\bf{Trade}}{\rm{ParisTarget}}$
term, which measures the Paris targets of each state’s peers weighted by their dyadic trade ties. In model 1, the spatial term is positive and statistically significant at conventional thresholds, indicating that governments set stronger Glasgow targets when their trade partners set strong Paris targets. Substantively, a one-unit change in trade-weighted peers’ climate targets—where peers set targets one percentage point stronger on average—implies an additional 1.01 [0.40, 1.63] percentage point emissions reduction in Glasgow, controlling for the strength of a country’s previous Paris target. This is evidence against the economic-competitiveness hypothesis, which proposed that states would weaken their mitigation contributions when their trading partners set strong targets. Economic competitiveness as manifested by joint trade ties does not hold climate policy back. Instead, strong climate policy by trade partners appears to support conditional cooperation. This result is robust across a number of specifications. Model 1 is estimated without controls, so I add fossil fuel rents, industrial composition, trade exposure, and renewable electricity generation in even-numbered models (Table 1).
${\bf{Trade}}{\rm{ParisTarget}}$
term, which measures the Paris targets of each state’s peers weighted by their dyadic trade ties. In model 1, the spatial term is positive and statistically significant at conventional thresholds, indicating that governments set stronger Glasgow targets when their trade partners set strong Paris targets. Substantively, a one-unit change in trade-weighted peers’ climate targets—where peers set targets one percentage point stronger on average—implies an additional 1.01 [0.40, 1.63] percentage point emissions reduction in Glasgow, controlling for the strength of a country’s previous Paris target. This is evidence against the economic-competitiveness hypothesis, which proposed that states would weaken their mitigation contributions when their trading partners set strong targets. Economic competitiveness as manifested by joint trade ties does not hold climate policy back. Instead, strong climate policy by trade partners appears to support conditional cooperation. This result is robust across a number of specifications. Model 1 is estimated without controls, so I add fossil fuel rents, industrial composition, trade exposure, and renewable electricity generation in even-numbered models (Table 1).
Trade-weighted peers’ climate targets and the ratchet

Notes: Outcome variable is emissions change in 2021 NDC as a percentage of 2010 emissions levels, rescaled so that positive values are emissions cuts. OLS regression models, with standard errors in parentheses. +p < 0.10; *p < 0.05; **p < 0.01.
One concern may be that total trade flows mischaracterize how trade raises competitiveness concerns. Trade in EITE sectors may better capture the relevant ties because these goods will be the most sensitive to changes in relative prices induced by climate regulation. I create a new connectivity matrix Trade ${^{{\rm{EITE}}}}$
that contains only dyadic trade in these sectors, remeasure the spatial lag, and then re-estimate the models. In models 3 and 4, I find the same positive, statistically significant effect.
${^{{\rm{EITE}}}}$
that contains only dyadic trade in these sectors, remeasure the spatial lag, and then re-estimate the models. In models 3 and 4, I find the same positive, statistically significant effect.
I also consider the role of trade competition, with an alternative connectivity matrix that measures the similarity of dyadic exports to third states. If two countries share similar export profiles (their most important export markets are similar), then they may be trade competitors even if these two countries have little bilateral trade. I construct Trade ${^{{\rm{Competition}}}}$
as the cosine similarity of each state’s export flows, separately for total and EITE trade, and recalculate the spatial lags. I then find positive, statistically significant coefficients for trade competition in models 5 through 8.
${^{{\rm{Competition}}}}$
as the cosine similarity of each state’s export flows, separately for total and EITE trade, and recalculate the spatial lags. I then find positive, statistically significant coefficients for trade competition in models 5 through 8.
Overall, rather than trade ties undermining climate policy, I find that trade ties support conditional cooperation. In the Paris Agreement’s ratchet process, governments were willing to set more ambitious climate targets when their most important trading partners set strong previous targets.
Table 2 investigates the political-reciprocity hypothesis, which expects states to set stronger climate targets when states they are more connected to politically set strong prior targets. The key coefficient is on the IOsParis term, which measures the climate targets of states’ political peers weighted by their sum of joint dyadic IO memberships. In models 1 and 2, I find a strong positive effect of political peers’ climate targets on the ratchet process. Governments were more willing to strengthen their climate mitigation targets at the Glasgow climate summit when the states with whom they share common IO memberships set strong targets under the Paris Agreement. This is support for conditional cooperation. Prior action by politically relevant peers helps states overcome collective-action problems and set more ambitious climate goals.
IO-weighted peers’ climate targets and the ratchet

Notes: Outcome variable is emissions change in 2021 NDC as a percentage of 2010 emissions levels, rescaled so that positive values are emissions cuts. OLS regression models, with standard errors in parentheses. +p < 0.10; *p < 0.05; **p < 0.01.
We now have evidence that trade and political ties both support conditional climate cooperation. On the one hand, this is surprising given the literature that suggests trade competition hinders climate action. On the other hand, trade ties and political ties are correlated, with a Pearson correlation coefficient of $r = 0.69$
. This implies that some of the effect of economic ties on cooperation may be confounded when political ties are omitted. In models 3–7 in Table 2, I include both political and economic spatial weights. The coefficient for peers’ IO-weighted climate policy is positive and statistically significant in all but one of these models, suggesting an independent effect of political connections. By contrast, the effect of trade ties is attenuated and never statistically significant. This implies that the IO-weighted term explains most of the same variation in the ratchet that the trade-weighted term explains, but also that joint IO membership explains some additional variation in targets beyond what trade ties can explain.
$r = 0.69$
. This implies that some of the effect of economic ties on cooperation may be confounded when political ties are omitted. In models 3–7 in Table 2, I include both political and economic spatial weights. The coefficient for peers’ IO-weighted climate policy is positive and statistically significant in all but one of these models, suggesting an independent effect of political connections. By contrast, the effect of trade ties is attenuated and never statistically significant. This implies that the IO-weighted term explains most of the same variation in the ratchet that the trade-weighted term explains, but also that joint IO membership explains some additional variation in targets beyond what trade ties can explain.
Trade connections do not necessarily enable countries to cooperate conditionally on climate mitigation; this effect is better attributed to joint political ties. Nonetheless, there remains no evidence that trade ties hinder climate cooperation, as expected by economic competition, because the coefficient is not negative.
In the supplementary materials, I address further considerations in measurement and estimation. One consideration with measuring the strength of peers’ climate policy by their Paris mitigation targets is that, while the targets provide an indication of mitigation’s direction and pace, targets may be disconnected from enacted policies. As a robustness test, I rebuild the spatial weights, replacing climate targets by the number of climate laws a country has passed. IO-weighted measures remain positive and statistically significant, though trade-weighted measures are not statistically significant (section SM-2.2).
Second, I build alternative spatial weights that do not row standardize and therefore allow the effect of the spatial stimulus to vary based on levels of trade exposure or IO memberships. I find that the trade term is robust across specifications. However, the IO term is more influenced by this measurement choice, such that it may be that IO-weighted peers’ climate targets have the strongest influence on countries with fewer total IO memberships and this influence wanes for countries at the highest percentiles of IO membership (section SM-2.3).
Third, I analyze specifications with regional fixed effects that could capture additional confounding between peers’ targets and the ratchet (section SM-3.1). In these models, the trade terms are attenuated, but the IO term is stable across specifications. In both cases, the statistical significance falls below conventional thresholds.
Fourth, since many countries did not submit targets and therefore may be missing nonrandomly from the data, I use multiple imputation to add missing 2015 and 2021 targets and rerun the model. I find the same results (section SM-2.1).
Finally, sensitivity analysis suggests that even an omitted confounder as strongly correlated with IO-weighted peers’ climate targets and the Glasgow targets as the Paris targets would not drive the estimates to zero or its $p$
-value above 0.05 (section SM-3.3).
$p$
-value above 0.05 (section SM-3.3).
Conclusion
Research on international climate politics has been divided between an enforcement and a distributive-conflict perspective. Scholars from the enforcement perspective have called for the flawed UN process to be jettisoned and replaced with a binding regime.Footnote 65 Meanwhile, the distributive perspective casts doubt on the viability of the UN process because it cannot resolve domestic zero-sum battles.Footnote 66 Both perspectives would doom the nonbinding, consensus-driven, universal-membership Paris Agreement to irrelevance.
However, the empirical record suggests that states have bought into the Paris framework and are making progress through its ratchet mechanism. While not every state has committed to strong targets, a crucial subset has, and they are pulling others with them. Here I document extensive ratcheting in national targets and find that political networks support increasingly ambitious targets. Specifically, when states met in Glasgow to deliver their verdict on the Paris Agreement, they were more likely to commit to stronger targets when their political peers had ambitious targets. This is in keeping with the institutional design of the Paris Agreement,Footnote 67 an agreement many observers claimed would fail.
What does this imply about climate cooperation? First, there are strong elements of positive reciprocity in target-setting. Governments are more willing to act when others have as well. Second, we see progress on targets because some states have been willing to lead through unilateral action. Without at least some states setting strong Paris targets, we would likely not have observed a strong ratchet. Third, it is important to remember that global mitigation remains underprovided, as the Glasgow targets still hold the possibility of breaching the 1.5°C threshold. That countries are strengthening their targets over time does not imply they have committed to sufficient targets. Finally, it remains important to examine compliance. It may be easier to generate compliance with existing targets than to generate strong targets in the first place. While the NDCs are not binding under international law, they often have been treated as such by domestic courts and activists who can put pressure on governments to comply. By creating an institution that blends international and domestic logics of climate policy, the Paris architects seem to have created a resilient institution that motivates greater action.
Data Availability Statement
Replication files for this research note may be found at <https://doi.org/10.7910/DVN/ENRGUM>.
Supplementary material
Supplementary material for this research note is available at <https://doi.org/10.1017/S0020818325000037>.
Acknowledgments
I would like to thank Fiona Bare, Mark Buntaine, Federica Genovese, Amy Janzwood, Diana Panke, Isabel Rodriguez-Toribio, Charles Roger, Duncan Snidal, Vegard Tørstad, and Alexandra Zeitz, as well as audiences at Université Laval, University of California, Los Angeles, and the 2022 American Political Science Association, 2023 International Studies Association, and 2023 Environmental Politics and Governance annual conferences for helpful comments.
Funding
This research was supported by a Fonds de recherche du Québec—Société et culture grant, FRQSC-2022-NP-296548.


 Open access