

The ‘Seven Countries’ study showed that the so-called Mediterranean diet is associated with a reduced risk of cardiovascular mortality despite its associated high intake of fat, mainly derived from olive oil (Keys et al. Reference Keys, Menotti and Karvonen1986; Keys, Reference Keys1995). It has also been shown that MUFA-containing oils reduce total and LDL cholesterol levels with no proportionate reduction of HDL cholesterol levels (Mattson & Grundy, Reference Mattson and Grundy1985; Mensink & Katan, Reference Mensink and Katan1989; Mata et al. Reference Mata, Alvarez-Sala, Rubio, Nuño and De Oya1992). A whole panoply of experimental work has been designed to explain these epidemiological and clinical data. However, MUFA-enriched diets have selective physiological effects in man, indicating that other components, e.g. TAG species or non-fatty acids, rather than the oleic acid content alone, might be responsible for the benefits of virgin olive oil (Ruiz-Gutierrez et al. Reference Ruiz-Gutierrez, Muriana, Guerrero, Cert and Villar1996; Kris-Etherton et al. Reference Kris-Etherton, Pearson, Wan, Hargrove, Moriarty, Fishell and Etherton1999; Abia et al. Reference Abia, Pacheco, Perona, Montero, Muriana and Ruiz-Gutierrez2001; Perona et al. Reference Perona, Canizares, Montero, Sanchez-Dominguez and Ruiz-Gutierrez2003, Reference Perona, Cabello-Moruno and Ruiz-Gutiérrez2006). Similar findings have also been described in animal studies dealing with the effects of olive oil on the vascular wall (Calleja et al. Reference Calleja, Paris, Paul, Vilella, Joven, Jimenez, Beltran, Uceda, Maeda and Osada1999; Herrera et al. Reference Herrera, Perez-Guerrero, Marhuenda and Ruiz-Gutierrez2001). When studying the biological effects of olive oil it should be remembered that it is more than a simple mixture of fatty acids, and that it contains other biologically active substances such as tocopherols, polyphenols and phytosterols, some of which have antioxidant and anti-inflammatory activities (Visioli et al. Reference Visioli, Galli, Plasmati, Viappiani, Hernandez, Colombo and Sala2000, Reference Visioli, Galli, Grande, Colonnelli, Patelli, Galli and Caruso2003; de la Puerta et al. Reference de la Puerta, Martinez Dominguez, Ruiz-Gutierrez, Flavill and Hoult2001; de la Puerta-Vazquez et al. Reference de la Puerta-Vazquez, Martinez-Dominguez, Sanchez Perona and Ruiz-Gutierrez2004; Perona et al. Reference Perona, Cabello-Moruno and Ruiz-Gutiérrez2006).
In Spain, unsaponifiable fraction-enriched olive oil is known as orujo or olive-pomace oil, and is extracted by the secondary centrifugation of the residue left after obtaining virgin olive oil. Improved procedures for the extraction of this oil now allow it to be obtained with higher concentrations of terpenoids, tocopherols, phytosterols and waxes from the epicarp of the olive – compounds that are in low concentration in virgin olive oil (Pérez-Camino & Cert, Reference Pérez-Camino and Cert1999). The nutritional value of this innovative olive oil preparation has not yet been studied, although the biological activity of most of these compounds is now being unveiled. We recently reported the vasorelaxant effects of oleanolic acid and erythrodiol, two triterpenoids found in orujo, on rat aorta (Rodriguez-Rodriguez et al. Reference Rodriguez-Rodriguez, Herrera, Perona and Ruiz-Gutierrez2004), as well as the improvement obtained with the unsaponifiable fraction of virgin olive oil in the balance between the vasoprotective and pro-thrombotic factors released by endothelial cells (Sanchez Perona et al. Reference Sanchez Perona, Martínez-González, Sánchez-Domínguez, Badimon and Ruiz-Gutierrez2004).
The liver produces a number of lipoproteins (VLDL and HDL), apo and enzymes. The latter (hepatic lipase, lecithin cholesterol acyltransferase and phospholipid transfer protein) are involved in the plasma transformation of lipoproteins (den Boer et al. Reference den Boer, Voshol, Kuipers, Havekes and Romijn2004). ApoE-deficient mice develop spontaneous atherosclerosis (Osada et al. Reference Osada, Joven and Maeda2000) and cognitive deficits resembling those of Alzheimer's disease and ageing, and therefore provide a model for all these problems (Masliah et al. Reference Masliah, Mallory, Ge, Alford, Veinbergs and Roses1995; Oitzl et al. Reference Oitzl, Mulder, Lucassen, Havekes, Grootendorst and de Kloet1997; Krzywkowski et al. Reference Krzywkowski, Ghribi, Gagne, Chabot, Kar, Rochford, Massicotte and Poirier1999). When fed high-fat diets these mice show slight hepatic steatosis that responds to dietary manipulations such as changing the type of linoleic acid isomer provided (Arbonés-Mainar et al. Reference Arbonés-Mainar, Navarro, Acín, Guzmán, Arnal, Surra, Carnicer, Roche and Osada2006a ). These steatotic variations have been associated with the development of atherosclerotic lesions (Arbonés-Mainar et al. Reference Arbonés-Mainar, Navarro, Guzmán, Arnal, Surra, Acín, Carnicer, Osada and Roche2006b ). Thus, the liver may undergo important metabolic changes under the influence of olive oil, mediated through changes in plasma lipoprotein concentration, and the steatotic-prone liver of apoE-deficient mice offers an excellent model in which to verify this. To test the hypothesis that the unsaponifiable fraction of olive oil significantly influences hepatic gene expression, apoE-deficient mice of different genetic backgrounds were fed diets supplemented with either 10 % (w/w) olive oil or 10 % unsaponifiable fraction-enriched olive oil. Gene expression was then determined by microarray analysis and confirmed by real-time RT–PCR.
Methods and material
Animals
The experimental animals were seventeen two-month-old male, homozygous apoE KO mice with a C57BL6J × OLA129 genetic background, and twelve homozygous apoE KO mice with a C57BL6J genetic background, all bred at the Unidad Mixta de Investigación, University of Zaragoza. To confirm that the initial plasma cholesterol and TAG concentrations of these animals were the same, blood samples were taken (after overnight fasting) from the retroorbital plexus after isofluorane anaesthetization. All mice were housed in sterile filter-top cages in rooms maintained under a 12 h light–12 h dark cycle. All had access ad libitum to food and water. The study protocol was approved by the Ethics Committee for Animal Research of the University of Zaragoza. Body weights and food intake were recorded throughout the experiment.
Diets
Two study groups were established: (1) one received a chow diet (Teklad Mouse/Rat Diet no. 2014; Harlan Teklad, Harlan Ibérica, Barcelona, Spain) supplemented with 10 % (w/w) olive oil obtained by a conventional procedure (OO diet) (n 9 and n 6 for the first and second experiments respectively; see later), and (2) the other received the same chow diet but supplemented with 10 % (w/w) unsaponifiable fraction-enriched olive oil (UEOO diet; n 8 and n 6 for the first and second experiments respectively; see later). This unsaponifiable fraction-enriched olive oil was manufactured by an innovative procedure (Pérez-Camino & Cert, Reference Pérez-Camino and Cert1999). Both olive oils were obtained from the same cultivar, contained the same TAG species and both were refined to eliminate the influence of soluble phenol compounds. All diets were prepared weekly and stored in an N2 atmosphere at − 20°C. Fresh food was provided daily. The animals were fed the experimental diets for 11 weeks; both were well tolerated. The unsaponifiable fraction was characterized as previously described (de la Puerta-Vazquez et al. Reference de la Puerta-Vazquez, Martinez-Dominguez, Sanchez Perona and Ruiz-Gutierrez2004).
Plasma analyses
At the end of the experimental period and after an overnight fast, the animals were killed by suffocation with CO2 and blood was drawn from their hearts. Plasma serum amyloid A concentrations were evaluated by immunoassay using a rat monoclonal anti-mouse serum amyloid A antibody (BioSource International, Camarillo, CA, USA) as the primary antibody (intra-day CV of this assay was 15 % for positive control). Plasma α1-acid glycoprotein (orosomucoid) concentrations were determined by the single radial immunodiffusion test using the mouse α1-AG plate kit (Cardiotech Services, Louisville, KY, USA) and were processed the same day (intra-day CV of this assay was 4 % for positive control).
Analysis of hepatic lipids
To determine hepatic cholesterol and TAG concentrations, lipids were extracted from 100 mg tissue using the method of Folch et al. (Reference Folch, Less and Sloan-Stanley1957), employing 2,6-di-tert-butyl-p-cresol as an antioxidant. The extracted lipids were redissolved in 1 ml of chloroform–methanol (2 : 1, v/v) and stored at − 20°C until analysis. The lipid classes were determined by HPLC as described by Perona & Ruiz-Gutierrez (Reference Perona and Ruiz-Gutierrez2004). Standard solutions of cholesteryl oleate, triolein, cholesterol and phosphatidylcholine, prepared in chloroform–methanol (2 : 1, v/v), were used for the identification and quantification of cholesteryl esters, TAG, free cholesterol and phospholipids, respectively.
RNA isolation, Affymetrix oligonucleotide array hybridization and data analysis
Immediately after the animals were killed the livers were removed and frozen in liquid nitrogen. RNA from each liver was isolated using Trigent reagent (MRC, Cincinatti, OH, USA). DNA contaminants were removed by TURBO DNAse treatment using the DNA removal kit from AMBION (Austin, TX, USA). RNA was quantified by absorbance at A 260/280 (the A 260/280 ratio was greater than 1·75). The integrity of the 28S and 18S ribosomal RNA was verified by agarose formaldehyde gel electrophoresis followed by ethidium bromide staining. Images were captured and analysed using a Bio-Rad image analysis system and Molecular Analyst (Bio-Rad, Madrid, Spain). The 28S/18S ratio was greater than 2.
Aliquots (20 μg) of total liver RNA from each mouse of each group (n 9 for the OO group and n 8 for the UEOO group) were pooled to avoid problems of individual variation, and purified using the RNeasy system (Quiagen, Barcelona, Spain). Total liver RNA (8 μg) was then used for biotin labelling. Hybridization, washing, scanning and analysis with the Affymetrix GeneChip Murine Genome MOE430A array (Affymetrix, Santa Clara, CA, USA) were performed according to the standard Affymetrix protocols used at Progenika Biopharma (Derio, Spain). Fluorometric data were generated by Affymetrix software, and the fluorimetric signal adjusted so that all the probe sets provided intensities within a manageable range. Transcripts with signal intensities that were lower than the noise of the matrix ( ± 3 sd) were not taken into account. The data obtained in the microarray hybridizations were processed with Microarray Suite 5.0 (Affymetrix) software. The identification of genes that were up- or down-regulated by the unsaponifiable fraction was performed by comparing gene expressions in the livers of animals from the two diet groups (significance set at P < 0·01). Of these we selected only those whose signal log2 ratio was higher than 1·5 (up-regulated genes) or lower than − 1·5 (down-regulated genes). Signal log2 ratio is now recommended by Affymetrix software and several authors (Gilsbach et al. Reference Gilsbach, Kouta, Bönisch and Brüss2006) because of the linear response observed in contrast to fold change. The complete datasets were deposited in the Gene Expression Omnibus (GEO) database (accession number GSE2261).
Quantification of mRNA
The differences in mRNA expression observed with the microarrays was confirmed by Northern blotting and quantitative real-time RT–PCR (qRT–PCR) analysis of individual samples. Northern blot analysis was performed as previously described (Acín et al. Reference Acín, Navarro, Carnicer, Arbonés, Guzmán, Arnal, Beltrán, Uceda, Maeda and Osada2005). The mouse clones for apoa5 (4196296 IMAGE Clone) and pon1 (4158951 IMAGE Clone) were obtained from MGC Geneservice (Cambridge, UK). The probes used were those previously described: apoa5 (Arbonés-Mainar et al. Reference Arbonés-Mainar, Navarro, Acín, Guzmán, Arnal, Surra, Carnicer, Roche and Osada2006a ) and pon1 (Acín et al. Reference Acín, Navarro, Carnicer, Arbonés, Guzmán, Arnal, Beltrán, Uceda, Maeda and Osada2005). A mouse β-actin fragment (Acín et al. Reference Acín, Navarro, Carnicer, Arbonés, Guzmán, Arnal, Beltrán, Uceda, Maeda and Osada2005) was used to normalize the amount of RNA. Labelling and quantification were performed as previously described (Acín et al. Reference Acín, Navarro, Carnicer, Arbonés, Guzmán, Arnal, Beltrán, Uceda, Maeda and Osada2005).
Equal amounts of DNA-free RNA from each sample of each animal were used in qRT–PCR analyses. First-strand cDNA synthesis and the PCR reactions were performed using the SuperScript III Platinum Two-Step qRT–PCR Kit with SYBR Green (Invitrogen, Madrid, Spain), according to the manufacturer's instructions and as previously described (Arbonés-Mainar et al. Reference Arbonés-Mainar, Navarro, Acín, Guzmán, Arnal, Surra, Carnicer, Roche and Osada2006a ). The primers used were designed by Primer Express® (Applied Biosystems, Foster City, CA, USA): for chymotrypsinogen – sense, 5′-CAG CAC CAT GGC ATT CCT TT-3′, antisense, 5′-GCA TCC TCT CCG TTG ACG AT-3′; for elastase 2 – sense, 5′-ACT GAA TTG CCG GGC ATC TA-3′, antisense, 5′-GTT CCT TGC CAT CAC CGA GT-3′; for fatty acid binding protein 5 – sense, 5′-GAC GGT CTG CAC CTT CCA AG-3′, antisense 5′-CAG GAT GAC GAG GAA GCC C-3′; for glucokinase – sense, 5′-ACG ACC CCT GCT TAT CCT CA-3′, antisense, 5′-CAC GGT CCA TCT CCT TCT GC-3′; for leptin receptor – sense, 5′-TGA CTT GCA GAT GGT CAC CC-3′, antisense, 5′-AAG CCG TCT CTC TGT AAG ACG C-3′; for metallothionein 2 – sense, 5′-TCG GAA TCT TCA CTC TTC AAA CC-3′, antisense, 5′-CCA TCG GAG GCA CAG GAG-3′; for nicotinamide N-methyltransferase – sense, 5′-CCT GGG CAG TCT GCT CAA G-3, antisense, 5′-AAT GGT GTA ACC GGC CTC TTC-3; for orosomucoid 2 – sense, 5′-TTG GAA GCT CAG AAC CCA GAA-3′, antisense, 5′-TCG AAG CTC CAT CGT GTC ATT-3′; for pancreatic lipase 2 – sense, 5′-GGA GCC CAG CAC AGA TCA AC-3′, antisense, 5′-GCC AGT TTT CTT CTC CCT TGT C-3′; for serum amyloid A 2 – sense, 5′-CTG GCT GGA AAG ATG GAG AC-3′, antisense, 5′-TGT CCT CGT GTC CTC TGC-3′; for trypsin 4 – sense, 5′-CTT CAA TGC CTG GAT GCC C-3′, antisense, 5′-CAG GAG ACA ATG CCC TGG AG-3′; and for β-actin – sense, 5′-CTG ACT GAC TAC CTC ATG AAG ATC CT-3′, antisense, 5′-CTT AAT GTC ACG CAC GAT TTC C-3′. The specificity of the PCR reaction was confirmed by sequencing the products after their electrophoretic separation in agarose gels. Real-time RT–PCR reactions were performed in an ABI PRISM 7700 Sequence Detector (Applied Biosystems) following the standard procedure. The relative amount of all mRNA was calculated using the comparative 2− ΔΔCt method. β-actin mRNA was used as the invariant control.
Liver histology analysis
Aliquots of liver were stored in neutral formaldehyde and embedded in paraffin. Sections (4 μm) were stained with haematoxylin and eosin and observed with a Nikon microscope.
Statistical analysis
The Mann–Whitney U test, according to the Algoritm of Microarray Suite 5.0 (Affymetrix), was used to compare the mean fluorimetric signal intensities of eleven to twenty perfect match probe per probe set hybridized to liver RNA from the OO group with those obtained for the UEOO group and in either case subtracted the intensities of a similar number of mismatched probes (background hybridization). Significance was set at P < 0·01. Correlations between variables were tested by calculating the Spearman's rank-order correlation coefficient (r s); tests were performed using Instat 3.02 software for Windows (GraphPad, San Diego, CA, USA).
Results
Dietary characteristics
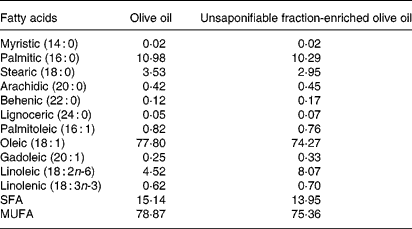
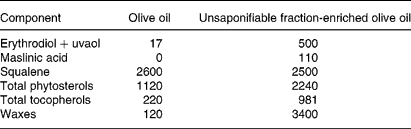
Tables 1 and 2 show the lipid composition of the two olive oils used. Their composition in linolenic fatty acid, SFA and MUFA was similar (Table 1), but the composition of the unsaponifiable fraction was different (except for squalene) (Table 2): the unsaponifiable fraction-enriched olive oil had greater quantities of phytosterols, waxes, triterpenes (erythrodiol, uvaol and maslinic) and tocopherols.
Fatty acid composition of the olive oils used (g/100 g, w/w)
Composition of the unsaponifiable fraction of the olive oils used (mg/kg, w/w)
No significant difference in weight gain (4·4 (sd 0·2) for the OO group compared to 4 (sd 0·3) g for the UEOO group) or food intake (3·9 (sd 0·3) for the OO group compared to 3·8 (sd 0·2) g for the UEOO group) was observed between the animals of the two diet groups. Similarly, the weight of the liver appeared unaltered by the administration of either diet (0·79 (sd 0·05) and 0·76 (sd 0·02) g, respectively).
Gene expression in livers of apoE-deficient mice fed the different diets
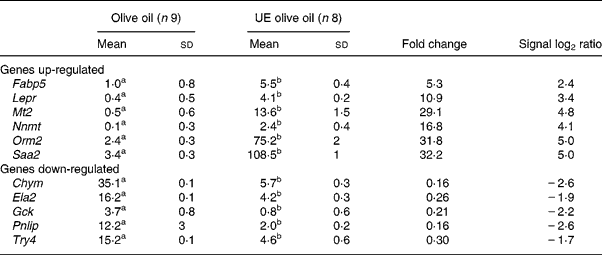
To determine the changes in hepatic gene expression induced by the unsaponifiable fraction of olive oil, the expression of 22 690 transcripts represented on the Affymetrix GeneChip Murine Genome MOE430A array was quantified in pooled liver samples of nine animals that received the OO diet and another eight that received the UEOO diet. The livers of OO animals expressed 10 455 transcripts, while those of the UEOO animals expressed 10 675 (identified as ‘present’ by Affymetrix software). Using the Mann–Whitney ranking feature of the Affymetrix software to determine significant differences in gene expression (P < 0·01), the increased expression of 920 sequences plus the reduced expression of 420 sequences was identified in samples from the animals on the UEOO diet compared to those on the OO diet when no multiple test correction was applied. When the latter was taken into consideration by removing expressions with similar gene symbols, identical accession number and identical UNIGENE number, the number of genes with increased and repressed expression was reduced to 660 and 324, respectively. To select the most relevant, only differentially regulated genes with a signal log2 ratio higher than 1·5 (for those genes up-regulated) or lower than − 1·5 (for those repressed) were taken into account. Tables 3 and 4 list the genes whose mRNA reflected these expressions. Thirty genes fulfilled the criterion of showing increased expression as a response to the unsaponifiable fraction of olive oil (Table 3). Five of these genes coded for acute phase proteins (Orm1, Orm2, Orm3, Saa1 and Saa2), four coded for proteins belonging to the extracellular space (Apcs, Fgl1, Prg4 and Sdc4), three were involved in signal transduction (Egfr, Lepr and Sesn1), three in electron transport (Cyp17a1, Cyp2b20 and Qscn6) and two in protein metabolism (Ren1 and Serpina3n). A further three were enzymes involved in acetyl-CoA (Pdk4), fatty acid (Scd1) and bile acid (Cyp7a1) biosynthesis, two coded for ion binding proteins (Mt1 and Mt2), two for metabolite transport proteins (Fabp5 and Lcn2), four for proteins with miscellaneous functions (e.g. one was involved in apoptosis (Bcl2 l), another was an enzyme involved in nicotinamide metabolism (Nnmt), one was a member of the complement cascade (Cfh) and one was a transcription factor (Gadd45 g). Finally, two genes coded for unknown expressed sequence tags. Twenty-four genes met the criterion of showing a reduced expression as a response to the presence of the unsaponifiable fraction of olive oil (Table 4). Of these, eight were involved in proteolysis (Cpa1, Cpb1, Chym, Ela1, Ela2, Ela3b, Prss2 and Try4), four in lipid metabolism (Clps, Cel, Pnlip and Pnliprp1), three in glutathione conjugation (Gsta2, Gsta4 and Gstm3), two coded for heat shock proteins (Hspa1a and Hspb1), two for transcription factors (Nr1d1 and Dbp), one for an enzyme involved in carbohydrate metabolism (Gck), three for proteins with miscellaneous functions (one extracellular receptor (Dmbt1), one enzyme involved in RNA metabolism (Rnase1) and one cell surface protein (Sycn)), and finally one for an unknown expressed sequence tag.
Hepatic genes up-regulated by the unsaponifiable fraction of olive oil*

UE, unsaponifiable fraction-enriched.
* Data represent intensity of signal for each condition with the Affymetrix chip. For details of procedures, see p. 630.
Hepatic genes down-regulated by the unsaponifiable fraction of olive oil*

UE, unsaponifiable fraction-enriched.
* Data represent intensity of signal for each condition with the Affymetrix chip. For details of procedures, see p. 630.
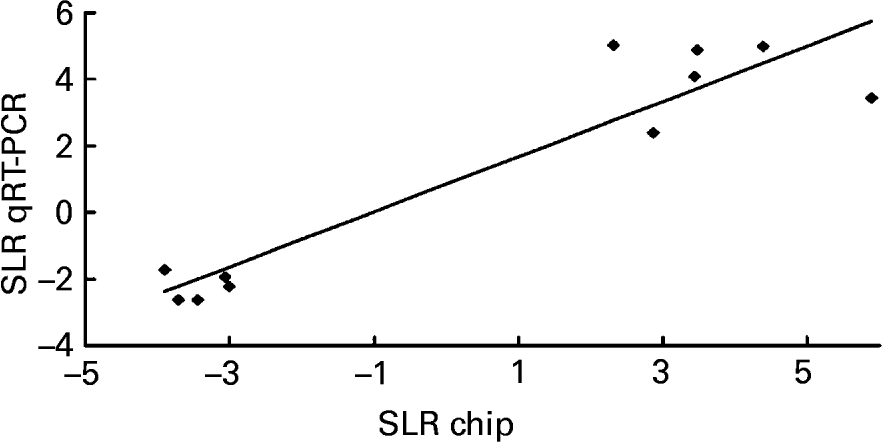
To validate the results obtained with the microarray, the expressions of eleven genes – Chym, Ela2, Fabp5, Gck, Lepr, Mt2, Nnmt, Orm2, Pnlip, Saa2, Try4 – that were strikingly up- or down-regulated (signal log2 ratio >3 or < − 3) were individually studied by specific qRT–PCR assays. β-actin was used to normalize the results that are shown in Table 5. The six up-regulated genes included in the validation analysis – Fabp5, Lepr, Mt2, Nnmt, Orm2, Saa2 – appeared significantly increased in their expressions by the presence of the unsaponifiable fraction of olive oil. The five down-regulated genes selected – Chym, Ela2, Gck, Pnlip, Try4 – were significantly decreased in mice receiving the diet enriched in the unsaponifiable fraction of olive oil. Fig. 1 shows the correlation between the mean values of signal log2 ratio for the eleven genes with the microarray assay performed with pooled samples (Tables 3 and 4), and the mean of each group obtained after the analysis of samples from each animal in both experimental groups (Table 5). Good agreement between these procedures was obtained (r 0·9382, P < 0·0001) and all samples were correctly classified, although in two cases the magnitude of the response differed between both methods. Two genes showing mild expression change (signal log2 ratio < 1·5), apolipoprotein 5 and paraoxonase 1, were also studied by Northern blotting, which confirmed their microassay results (data not shown). This indicates that pooled samples can be successfully used to provide an initial screening of gene expression in studies of this type, with the attending economic and time savings although with the limitation of no information on biological variability.
Hepatic genes regulated by the unsaponifiable fraction of olive oil*
UE, unsaponifiable fraction-enriched.
a,b Mean values within a row with unlike superscript letters were significantly different (Mann–Whitney U test; P < 0·001).
* Data represent arbitrary units normalized to the β-actin expression for each condition with the quantitative real-time RT–PCR. For details of procedures, see p. 630.
Correlation analysis between microarray and quantitative real-time RT–PCR (qRT–PCR) data. The expression of eleven genes – Chym, Ela2, Fabp5, Gck, Lepr, Mt2, Nnmt, Orm2, Pnlip, Saa2 and Try4 – was individually studied by qRT–PCR and normalized to the invariant β-actin gene. For details of procedures, see p. 630. The mean values obtained for signal log2 ratio (SLR) from individual analyses (see Table 5) were plotted against the microarray values which used pooled samples (see Tables 3 and 4). Good agreement between the procedures was seen (r 0·9382, P < 0·0001).
Plasma presence of unsaponifiable-activated gene products
Since five of the overexpressed genes (Orm1, Orm2, Orm3, Saa1 and Saa2) coded for circulating proteins that may influence general homeostasis, their plasma levels were determined. If the remarkable changes observed in the hepatic expression of these proteins were reflected in plasma to the same degree, this would make them highly attractive markers of the consumption of the unsaponifiable fraction of olive oil. Serum amyloid proteins are well-known modifiers of plasma lipoproteins but no physiological role for orosomucoid has been proposed besides its role in the acute phase response (Hochepied et al. Reference Hochepied, Berger, Baumann and Libert2003). Fig. 2(a ) shows the results of Western analysis of serum amyloid protein concentration. The observed increase of Saa mRNA expression (Table 3) was not reflected in plasma in either the OO or UEOO mice, suggesting the absence of an acute phase reaction. To confirm this lack of acute phase response, the livers of animals consuming the different diets were examined histologically. Fig. 2(b ) shows representative images of livers from animals of the two diet groups. For comparison, an image of an ApoE-deficient mouse of the same age that was fed the chow diet with no added oil of any type is included (marked as control group). The liver of this control animal shows marked steatosis, in agreement with the described accumulation of lipids in this model (Sehayek et al. Reference Sehayek, Shefer, Nguyen, Ono, Merkel and Breslow2000). Interestingly, both experimental diets alleviated these steatotic features. No inflammatory cells were detected in the liver of any animal, suggesting that the UEOO diet does not induce an acute phase response. However, the increased hepatic Orm2 mRNA levels observed in the chip analysis were confirmed by qRT–PCR (Fig. 3(A)) and were reflected in the plasma concentration of animals consuming the UEOO diet (Fig. 3(C)). The present results indicate that the increase in hepatic Orm2 mRNA leads to increased concentrations of the protein product in plasma.
Absence of acute phase reaction in mice fed the different diets (OO diet, diet supplemented with olive oil; UEOO diet, diet supplemented with unsaponifiable fraction-enriched olive oil). (a), Plasma serum amyloid A (SAA) Western blot analysis. Lane 1, a positive control corresponding to rat plasma from an animal treated with turpentine to induce the acute phase reaction. Lanes 2–4, plasma from mice consuming the different diets: chow, OO diet and UEOO diet, respectively. Light chain Ig detection was used as a loading control. (b), Representative liver micrographs from apoE-deficient mice consuming the different diets (bars = 25 μm). For details of procedures, see p. 630.

Influence of genetic background on orosomucoid expression in apoE-deficient mice consuming the different diets (OO diet, diet supplemented with olive oil; UEOO diet, diet supplemented with unsaponifiable fraction-enriched olive oil). (A), Plasma orosomucoid 2 levels in apoE-deficient mice with C57BL/6J × Ola129 genetic background. (B, C), mRNA expression for orosomucoid 2 in livers of apoE-deficient mice with C57BL/6J × Ola129 (B) and C57BL/6J (C) genetic backgrounds (determined by quantitative real-time RT–PCR). For details of procedures, see p. 630. Values are means with their standard errors depicted by vertical bars. Mean values were significantly different from those of the OO diet (Mann–Whitney U test): *P < 0·001.

To determine whether this induction of Orm2 also occurred in apoE-deficient mice with the C57BL/6J genetic background, their livers were studied for the expression of this gene. Although the UEOO diets led to a reduction in hepatic Orm2 mRNA levels (Fig. 3(B)), surprisingly this was not reflected at the plasma level (data not shown). The increase in hepatic Orm2 mRNA expression is probably a specific response elicited by the unsaponifiable fraction of olive oil, and is not related to an acute phase response but conditioned by the genetic background of the mice.
Effects of mouse genetic background on the response to unsaponifiable fraction-enriched olive oil
To investigate which of the selected genes – Chym, Ela2, Fabp5, Gck, Lepr, Mt2, Nnmt, Pnlip, Saa2, Try4 – were influenced by the genetic background, their expressions in apoE-deficient mice (C57BL/6J genetic background) receiving both diets were assayed by qRT–PCR (normalized to the invariant gene β-actin). The results are expressed as signal log2 ratios in both genetic backgrounds (Fig. 4). Interestingly, no Pnlip expression was detected in the livers of mice with the C57BL/6J background and lesser variability of response was observed in these mice. For the genes Lepr and Saa2, a significant opposite response was seen in mice of different genetic background. In contrast, for seven other genes the influence of the UEOO diet was similar in both types of mice (Mt2, Chym and Ela2 expressions), although the magnitude of response significantly differed (more pronounced for the Fabp5 gene in the C57BL/6J background, and less so in genes Gck, Nnmt and Try4 in the C57BL/6J × Ola129 background). The present results further illustrate that genetic background may influence the response to the unsaponifiable fraction of olive oil.
Influence of genetic background of apoE-deficient mice on the pattern of gene expression in response to the diet supplemented with unsaponifiable fraction-enriched olive oil (UEOO diet). Data are expressed as signal log2 ratios of hepatic mRNA expression (as determined by quantitative real-time RT–PCR) for each gene in apoE-deficient mice with C57BL/6J × Ola129 (□) and C57BL/6J (▒) genetic backgrounds consuming either the diet supplemented with olive oil (OO diet) or the UEOO diet. Animals receiving the OO diet were used as the reference against which to compare the effects of the UEOO diet. For details of procedures, see p. 630. Values are means with their standard deviations depicted by vertical bars. *P < 0·001 between genetic backgrounds according to the Mann–Whitney U test.

Discussion
The unsaponifiable fraction of olive oil remarkably influenced the activity of several genes. The nutrigenomic approach of the present work clearly shows the important effect of this fraction. Some of its components, such as phytosterols (Plosch et al. Reference Plosch, Bloks and Terasawa2004) and vitamin E (Barella et al. Reference Barella, Muller, Schlachter, Hunziker, Stocklin, Spitzer, Meier, de Pascual-Teresa, Minihane and Rimbach2004), have been shown to affect the expression of certain genes. Others, such as maslinic acid (Montilla et al. Reference Montilla, Agil, Navarro, Jimenez, Garcia-Granados, Parra and Cabo2003; Márquez-Martín et al. Reference Márquez-Martín, de la Puerta-Vázquez, Fernández-Arche and Ruiz-Gutiérrez2006) and erythrodiol (Rodriguez-Rodriguez et al. Reference Rodriguez-Rodriguez, Herrera, Perona and Ruiz-Gutierrez2004), are biologically active compounds but it is not known whether they influence the expression of any gene. Independent of the mechanism involved, the present results reveal the additional effects of the unsaponifiable fraction with respect to the influence of olive oil, and support the idea that not all MUFA-containing oils behave in the same way (Kritchevsky et al. Reference Kritchevsky, Tepper, Klurfeld, Vesselinovitch and Wissler1984; Kris-Etherton et al. Reference Kris-Etherton, Pearson, Wan, Hargrove, Moriarty, Fishell and Etherton1999).
The huge amounts of information provided by microarrays requires further action be undertaken if meaningful and manageable data are to be obtained, such as selecting only the genes with the highest expression changes (Dutta et al. Reference Dutta, Singh, Li, Fornage and Teng2003; Vergnes et al. Reference Vergnes, Phan, Strauss, Tafuri and Reue2003; Artieda et al. Reference Artieda, Cenarro, Junquera, Lasierra, Martinez-Lorenzo, Pocovi and Civeira2005; Calpe-Berdiel et al. Reference Calpe-Berdiel, Escola-Gil, Ribas, Navarro-Sastre, Garces-Garces and Blanco-Vaca2005) or those involved in a certain metabolic pathway (Horton et al. Reference Horton, Shah, Warrington, Anderson, Park, Brown and Goldstein2003; Kreeft et al. Reference Kreeft, Moen, Porter, Kasanmoentalib, Sverdlov, van Gorp, Havekes, Frants and Hofker2005). In the present work, analysis was performed by subjecting the microarray data to two rounds of selection. First, a restrictive step was performed, selecting only those genes with a signal log2 ratio of ± 1·5. With this criterion, only thirty genes were found to be remarkably up-regulated and twenty-four notably down-regulated. Second, only those genes whose expression was strongly modified were deemed to be potential markers of the intake of the unsaponifiable fraction. The strong modification of the expression of these genes was individually confirmed by qRT–PCR. Good agreement was observed between the Affymetrix chip and qRT–PCR data (Fig. 1). In high-density microarrays, such as the Affymetrix MOE430A gene chip, several probes are used for the same gene, therefore the main concern regarding repeatability is the natural individual variability of mRNA expression. Minimum information about a Microarray experiment (MIAME) standards recommend using several chips for this reason (http://www.mged.org/index.html), but this is not the only option and sometimes it may be too stringent in terms of sample demands, time, cost and the manageability of information. The present data clearly show that pooling RNA from different animals and using this in microarray analysis is a reliable screening method for the search of biological effects in terms of saving samples, time and economic resources, as other authors have found (Napoli et al. Reference Napoli, de Nigris, Welch, Calara, Stuart, Glass and Palinski2002; Dutta et al. Reference Dutta, Singh, Li, Fornage and Teng2003; Artieda et al. Reference Artieda, Cenarro, Junquera, Lasierra, Martinez-Lorenzo, Pocovi and Civeira2005; Calpe-Berdiel et al. Reference Calpe-Berdiel, Escola-Gil, Ribas, Navarro-Sastre, Garces-Garces and Blanco-Vaca2005; Kreeft et al. Reference Kreeft, Moen, Porter, Kasanmoentalib, Sverdlov, van Gorp, Havekes, Frants and Hofker2005). However, the main drawback of this approach is the lack of information on biological variability of individual samples. This limitation, also observed in other areas (Peng et al. Reference Peng, Wood, Blalock, Chen, Landfield and Stromberg2003), may be particularly important in the nutrition field in order to distinguish dietary responders and non-responders. Therefore, the experimenter should be aware of this caveat before deciding to pool samples.
The eleven genes whose expression was strongly modified – Chym, Ela2, Fabp5, Gck, Lepr, Mt2, Nnmt, Orm2, Pnlip, Saa2, Try4 – were tested for their suitability as markers of the consumption of the unsaponifiable fraction. Their dependency on genetic background in apoE-deficient mice was also analysed. Seven of these genes – Chym, Ela2, Fabp5, Gck, Mt2, Nnmt and Try4 – were representative markers of the presence of the unsaponifiable fraction of olive oil in the diet, independent of the genetic background. Three of these genes – Chym, Ela2 and Try4 – are involved in proteolysis and showed reduced expression in the UEOO animals. Gck, an enzyme involved in glucose metabolism and also repressed in animals receiving high-fat diets, showed similar behaviour (Dutta et al. Reference Dutta, Singh, Li, Fornage and Teng2003). The opposite (up-regulation) was observed for the expressions of Fabp5, Mt2 and Nnmt. Fabp5 (mal1) is considered to be an epidermal protein although it is also expressed in adipocytes (Maeda et al. Reference Maeda, Uysal, Makowski, Gorgun, Atsumi, Parker, Bruning, Hertzel, Bernlohr and Hotamisligil2003) and the liver (see GenBank accession AK167389 for a clone isolated from a liver cDNA library, and the present data). The exact role of this protein is not yet completely known, although it has been proposed to bind leukotriene A4 (Zimmer et al. Reference Zimmer, Dyckes, Bernlohr and Murphy2004) and to play a role in systemic insulin sensitivity (Maeda et al. Reference Maeda, Uysal, Makowski, Gorgun, Atsumi, Parker, Bruning, Hertzel, Bernlohr and Hotamisligil2003). The change in its expression induced by the UEOO diet was particularly dramatic in the C57BL/6J animals. Mt2 is thought to be associated with obesity since knock-out mice lacking this gene develop this problem (Miura & Koizumi, Reference Miura and Koizumi2005). In both studied substrates, the expression of this gene was up-regulated (Fig. 4). Nnmt has been recently associated with plasma homocysteine levels (Souto et al. Reference Souto, Blanco-Vaca, Soria, Buil, Almasy, Ordonez-Llanos, Martin-Campos, Lathrop, Stone, Blangero and Fontcuberta2005). Its genetic background-dependent response might explain the variation in homocysteine levels in different strains of mice. Taken as a whole, the present results suggest that the unsaponifiable components of olive oil play an important role in controlling the expression of genes with roles in obesity, insulin sensitivity and cardiovascular risk factors, and that it deserves further attention.
The expression levels of Lepr, Orm2 and Saa2 act as markers of the presence of the unsaponifiable fraction of olive oil in the diet, but in a genetic background-dependent fashion. No increase in plasma serum amyloid A was seen, but circulating levels of orosomucoid appeared to be elevated in mice with the hybrid genetic background (C57BL/6J × OLA129). The induction of orosomucoids has to date been attributed to acute phase reactions (Hochepied et al. Reference Hochepied, Berger, Baumann and Libert2003). In this regard, the absence of any hepatic steatosis or inflammation plus a lack of change in serum amyloid A after the administration of the unsaponifiable fraction suggests that increased orosomucoid plasma levels are a unique response elicited by these compounds via the induction of Orm2 expression. Recent studies have found that subjects with increased plasma concentrations of orosomucoid have higher levels of vitamin A (Thurnham et al. Reference Thurnham, McCabe, Northrop-Clewes and Nestel2003). In addition, in transgenic mice overexpressing srebp1 and srebp2, transcriptional factors involved in lipid metabolism, increased expression of this gene has also been described (Horton et al. Reference Horton, Shah, Warrington, Anderson, Park, Brown and Goldstein2003) although at a lower intensity than in mice consuming the UEOO diet. Together, the data suggest an unknown role for orosomucoid that might vary depending on the genetic background.
The absence of hepatic steatosis and inflammation after the administration of either diet is an interesting finding that confirms previous data showing hepatic TAG (in other experimental models) to be reduced when olive oil is consumed (Deng et al. Reference Deng, Elam, Wilcox, Cagen, Park, Raghow, Patel, Kumar, Sheybani and Russell2004). This effect is lost, however, when a higher percentage olive oil intake is provided or when the intake is accompanied by cholesterol (Acín et al. Reference Acín, Navarro, Carnicer, Arbonés, Guzmán, Arnal, Beltrán, Uceda, Maeda and Osada2005). Overall, the results indicate that in dyslipidaemic apoE-deficient mice, olive oil provides protection against hepatic steatosis until a certain fat intake is reached. This would be especially true in low-cholesterol diets such as with the traditional Mediterranean diet.
In conclusion, this nutrigenomic approach clearly illustrates the important effects of the unsaponifiable fraction of olive oil. The present results suggest that it is no longer appropriate to speak of MUFA-enriched oils (avocado, oleic acid-enriched safflower, oleic acid-enriched sunflower, olive and peanut oils) as though all had the same effects. Future studies should be aware of this to avoid confusion – both to researchers and consumers. The present approach also shows new connections between nutrition and gene expression. A gene product with unknown biological function, orosomucoid, was up-regulated to an extent depending on the genetic background of the mice. Fabp5 and Mt2 were strongly up-regulated while the expression of several proteases was repressed by the UEOO diet. These modifications in expression could be used as markers of the intake of the unsaponifiable fraction of olive oil. The present results also show the usefulness of Affymetrix chip technology for characterizing gene expression levels in response to nutritional components in intact animal systems.
Acknowledgements
V. R.-G. and J. O. contributed equally to this work. This research was supported by grants FEGA-FEOGA (CAO99-014), Ministerio de Educación y Ciencia, CICYT (SAF2004-08 173-C03-02 and AGL2005-00 572), Junta de Andalucía (CAO01-002), FISS 01/0202, Redes FISS de investigación cooperativa C03-01 and G03-140 and by the Fundación Española del Corazón. R. C., S. A., M. A. N. and N. G. were recipients of DGA, FEGA-FEOGA and Fundación Cuenca-Villoro fellowships. We thank Drs C. Junquera and L. Osaba of Progenika Biopharma for performing the microarray analyses, and Dr Martínez for critical reading of the manuscript. Thanks are also due to Angel Beltrán, Jesús Cazo, Jesús Navarro, Carmen Navarro and Clara Tapia of the Unidad Mixta de Investigación for their invaluable help in maintaining the experimental animals. We also thank Adrian Burton for editorial assistance.


