

1. Introduction
It has been known for some time that lake ice is sensitive to climate variability and change (e.g. Palecki and Barry, 1986; Robertson and others, 1992; Wynne and others, 1998). Since the mid-19th century, the duration of the ice cover on Northern Hemisphere lakes and rivers has declined at a rate of 12.3 days (100 a)–1, corresponding to an air-temperature increase of 1.2˚C (100 a)–1, due to later freeze-up (FU) in autumn and earlier break-up (BU) in spring (Magnuson and others, 2000). Changes of this magnitude can have a significant effect on lake ecology (e.g. Schindler and others, 1990).
In Alaska, USA, larger air-temperature increases occurred over a much shorter period of time in the late 20th century, when the Pacific Decadal Oscillation (PDO) shifted from strongly negative to strongly positive (Hartmann and Wendler, 2003). In Fairbanks, central Alaska, for example, mean annual air temperature increased from –3.3˚C during 1966–75 to –1.8˚C during 1977–86. Moreover, most of the +1.5˚C annual change was accounted for by air-temperature increases from November to March, i.e. a large proportion of the lake ice growth season.
Further significant climate changes are predicted for central Alaska during the course of the 21st century (ACIA, 2004). They include air-temperature increases of 4–6˚C from October to March and 1–2˚C during April and May, and a precipitation increase of around 6 mmmonth–1 between November and February. These magnitudes of change would be expected to have a significant effect on lake ice growth and decay.
The Magnuson and others (2000) study did not include any Alaska data, as there are no records of sufficient length. Furthermore, of the short lake-ice records that do exist as a result of a US Army Cold Regions Research and Engineering Laboratory (CRREL)-sponsored monitoring program between 1958 and 1977 (e.g. Bilello and Lunardini, 1996 and references therein), only one winter post-dates the mid-1970s PDO shift. Therefore, we resort to computer simulation to examine the effects of the PDO shift, and the possible effects of further climate change on lake ice growth and decay in central Alaska.
Long-term average ice thickness, composition (snow ice, congelation ice) and phenology (FU, BU, duration) are simulated for the 24 year periods 1952–75 and 1977–2000, i.e. before and after the PDO shift. The likely effects of changes in air temperature and snow depth on lake ice thickness, composition and phenology are then examined with a series of numerical experiments in which mean annual air temperature and snow depth are changed, and the magnitude and timing of monthly air-temperature and snow-depth changes are varied.
2. Data And Methods
2.1. Computer model
The Canadian Lake Ice Model (CLIMo), a one-dimensional, thermodynamic model with unsteady heat conduction and penetrating solar radiation, is used to simulate lake ice thickness, composition and phenology. Originally conceived to simulate land-fast sea ice in the Canadian Arctic (Flato and Brown, 1996), it has been modified for lake ice studies. A detailed description of the model can be found in Flato and Brown (1996), Ménard and others (2002a) and Duguay and others (2003). Comparisons of CLIMo simulations with recent observations and measurements of ice thickness, composition and phenology in central Alaska are described in Jeffries and others (2005).
2.2. Meteorological data
The US National Weather Service (NWS) has maintained a first-order weather station at Fairbanks International Airport (FAI; 64˚49′ N, 147˚51′ W) since 1951. To describe the effects of the PDO shift on the climate of Alaska, Hartmann and Wendler (2003) examined the 10 year periods immediately prior to and after 1976 (1966–75 and 1977–86). We calculated weighted daily means for each of the CLIMo meteorological input variables (daily mean cloud cover, relative humidity, wind speed, air temperature and snow on the ground) from the Fairbanks data for these two 10 year periods and for the two 24 year periods 1952–75 and 1977–2000 (the longest possible periods of equal length before and after the PDO shift). These data were used to simulate the effects of the PDO shift on lake ice phenology, thickness and composition, and explore the impact of climatic variability on these lake ice parameters.
3.
Effects of The Pdo Shift of THE MID-1970S Simulations were run using the five long-term average climate variables for the periods 1966–75, 1977–86, 1952–75 and 1977–2000. Snow-density values for these and all other simulations described hereafter were set at 169 Mgm–3 (cold) and 263 Mgm–3 (warm), as determined from systematic weekly measurements made at Poker Flat research range (35km northeast of FAI) from autumn 1999 to spring 2003 (Jeffries and others, 2005). The mixed-layer depth was set at 2 m, the same value used for ice-growth and -decay simulations on shallow ponds in Fairbanks and vicinity (Jeffries and others, 2005). Lake depth has been shown to be an important parameter to consider for the determination of FU dates (e.g. Vavrus and others, 1996), and small, shallow lakes are considered to be well suited for investigating the effects of climate variability and change on ice cover because the effects of heat storage and circulation are reduced (Duguay and others, 2003).
The ice phenology, thickness and composition results of the PDO shift simulations are summarized in Table 1. There are minor differences between the simulations run over 10 and 24 year periods, but overall the consequences of the PDO shift are the same: after the shift, the ice duration is shorter due entirely to earlier BU, and the thickness is lower primarily due to a reduction in the amount of snow ice.
Changes in ice phenology, maximum thickness and composition before and after the PDO shift

The thinner, shorter-duration ice cover with less snow ice after the PDO shift (Table 1) can be attributed primarily to air-temperature and snow-depth changes. Between 1952–75 and 1977–2000, the long term mean annual air temperature increased by 1.3˚C, mainly as a result of an increase in winter temperatures exemplified by the almost 400 fewer freezing degree days (a mean increase of 1.8˚C) during the 1977–2000 ice growth season (Table 2). The thinner, shorter-duration snow cover of 1977–2000 (Table 1) would have provided less thermal resistance and might be expected to allow higher CI growth rates and total CI thickness. However, the difference in CI thickness between 1952–75 and 1977–2000 was negligible (Table 1), suggesting that the lower thermal resistance of the snow was sufficient only to balance the effects of the higher winter temperatures of 1977–2000. The main effect of the thinner snow cover of 1977–2000 was to decrease the amount of SI formation and thus the total ice thickness.
Long-term meteorological averages (±1 s.d.) at FAI before (1952–75) and after (1977–2000) the PDO shift
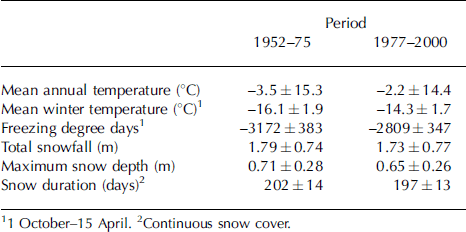
11 October–15 April. 2Continuous snow cover.
4. Sensitivity of Ice Phenology, Thickness and Composition to Air-Temperature and Snow-Depth Changes
The possible effects of further changes in air temperature and precipitation on lake ice growth and decay in central Alaska are examined by manipulating the 1952–75 and 1977–2000 air-temperature and snow-depth long-term averages. For the annual air-temperature experiments, the long-term daily averages are changed in 1˚C increments over the range –4 to +4˚C uniformly over the entire year. Similarly, the long-term daily snow-depth averages are changed in 25% increments over the range –100 to +100% uniformly over the entire snow season. The possible effects of future variations in the magnitude and timing of air-temperature and snow-depth changes on lake ice growth and decay in central Alaska are examined by manipulating the 1977–2000 long-term daily averages on a month-to-month basis. The changes are the same as in the annual experiment except that they are limited to a single month during the ice-growth and -decay season, leaving the other months unchanged.
4.1. Annual changes in air temperature and snow depth
4.1.1.
Effects on phenology
Annual air-temperature change has a greater effect than snow-depth change on duration (Fig. 1a and b). Positive air-temperature changes decrease ice duration due to later FU and earlier BU, and negative air-temperature changes increase ice duration due to earlier FU and later BU. BU is affected a little more than FU by air-temperature change: FU is delayed by 16 days in both 1952–75 and 1977–2000 as air temperature is increased, and BU occurs 18 days earlier for 1952–75 (17 days earlier in 1977–2000). Ice duration decreases by 34 days in 1952–75 and by 33 days in 1977–2000 for temperature changes between –4˚C and +4˚C.
The effects of simulated annual air-temperature changes and snow-depth changes on ice duration (a, b) and maximum ice thickness and composition (c, d) during the periods 1952–75 and 1977–2000. Symbols in (a) and (b) are used to show freeze-up and break-up dates and the date of maximum ice thickness. Numbers (e.g. 219/215) in (a) and (b) indicate the duration of the ice cover in 1952–75/1977–2000, respectively. Numbers in (c) and (d) are SI/TI ratios for 1952–75 (top) and 1977–2000 (bottom) for the ice-thickness bars above.

Annual snow-depth change does not affect FU, and causes only small changes in BU for the +100% to –50% cases (Fig. 1b). Ice duration decreases by 6 days for snow-depth changes between +100% and –50% in 1952–75, and by 4 days for the same range of snow-depth change in 1977–2000. Only when the ice cover has an unlikely zero snow cover (–100%) is BU delayed due to the greater amount of time (19 days for 1952–75, 18 days for 1977–2000) needed to melt the much thicker ice cover (Fig. 1d).
4.1.2.
Effects on maximum ice thickness and composition
Annual snow-depth change has a greater effect than air-temperature change on ice thickness and composition (Fig. 1cand d). As air temperature is changed from –4˚C to +4˚C, there is a progressive but small decrease in TI thickness (–0.1 m), SI thickness (–0.025 m) and CI thickness (–0.075 m) for both periods 1952–75 and 1977–2000 (Fig. 1c). TI thickness is lower (0.055 m) and SI/TI ratios are lower in 1977–2000 than in 1952–75 across the full range of air-temperature change. The most significant effect of air-temperature change is the timing of maximum ice thickness: as air temperature is changed from –4˚C to +4˚C, the date of maximum ice thickness occurs 14 and 15 days earlier in 1952–75 and 1977–2000, respectively (Fig. 1a).
The effects of annual snow-depth change on ice thickness and composition are more profound than the effects of air-temperature change (Fig. 1c and d). When the snow cover is changed from –50% to +100% and/or from –75% to –100%, the TI thickness increase is much greater than that across the full range of air-temperature changes (Fig. 3d). There is a doubling of TI thickness for a snow-cover change of –75% to –100% due to the lack of thermal resistance. The increase in TI thickness between –50% and +100% snow-cover change is due to eight-fold (1952–75) and ten-fold (1977–2000) increases in the amount of SI at the expense of the amount of CI (Fig. 1d). TI, SI and CI thickness in 1977–2000 are systematically less than in 1952–75, and SI/TI ratios in 1977–2000 are lower than those in 1952–75.
Annual snow-depth changes also affect the timing of maximum ice thickness. As snow depth is changed from –100% to +100%, the date of maximum ice thickness occurs 6 and 7 days later in 1952–75 and 1977–2000, respectively (Fig. 1b).
The effects of changes in monthly air temperature (a) and snow depth (b) on simulated maximum ice thickness and composition for the period 1977–2000. In (a) the maximum ice thickness and composition bars are arranged to illustrate the effects of air-temperature changes between –4˚C and +4˚C in 1˚C increments from left to right for each month. In (b) the maximum ice-thickness and composition bars are arranged to illustrate the effects of snow-depth changes between –100% and +100% in 25% increments from left to right for each month. The central black bars represent the 0˚C/0% case.

4.2. Monthly changes in air temperature and snow depth
4.2.1
Effects on phenology
Altering the magnitude and timing of air-temperature changes has a larger effect on phenology than changing the magnitude and timing of snow depth (Fig. 2). FU is affected by monthly air-temperature changes only in September and October, with changes in September having a smaller effect on FU than changes in October (±1day vs ±6 days). BU is significantly affected by air temperature in April (±6 days) and May (±2 days), with minor (1 day) BU changes from September to March. The FU and BU changes effected by air-temperature changes have a considerable effect on duration (Fig. 2a). For any 1˚C temperature change, as much as a 6 day change in duration is effected (–4˚C case). Across the full 8˚C range, duration is changed by as much as 13 days (+4˚C minimum to –4˚C maximum).
The effects of changes in monthly air temperature (a) and snow depth (b) on simulated phenology and date of maximum ice thickness for the period 1977–2000. The dotted lines and crosses represent the 0˚C/0% case ice duration and date of maximum ice thickness, respectively; the open circles indicate freeze-up or break-up dates that deviate from the 0˚C/0% case; the small dots indicate deviations from the date of maximum ice thickness; and the numbers (e.g. 209/214) indicate minimum/maximum duration, respectively, effected by a particular variable change. A single number indicates no difference between the minimum and maximum duration.

Monthly snow-depth changes have no effect on FU (Fig. 2b). BU is affected by some snow-depth changes each month from October through April. BU is 1 day later when no snow is added in October, because a greater TI thickness results from an absence of snow and thermal resistance to congelation-ice growth. Decreases in snow depth of –25 to –100% each month from November to April cause a 1 day earlier BU because of a reduction in flooding, SI formation and TI thickness. Overall, monthly snow-depth changes affect ice duration by only 0–2 days, i.e. far smaller effects on duration than those due to monthly air-temperature changes.
4.2.2
Effects on maximum ice thickness and composition
Altering the magnitude and timing of snow-depth variation has a much greater effect on maximum ice thickness and composition than changing the magnitude and timing of air-temperature variation. Indeed, the effects of monthly air-temperature change are negligible compared to those of snow-depth change (Fig. 3).
The greatest effects of monthly air-temperature change occur mainly in October and November (Fig. 3a). In October, the decrease in TI thickness as air temperature is changed by –4˚C to +4˚C is due to a decrease in SI thickness. Lower October air temperatures cause earlier initial ice formation and thus earlier snow accumulation and ultimately greater snow loads, flooding and SI formation. Higher October air temperatures have the opposite effect. In November, the decrease in TI thickness as air temperature is changed by –4˚C to +4˚C is due entirely to a decrease in CI thickness, as SI thickness remains constant. November temperature changes affect TI thickness through CI growth at the bottom of the ice cover, while October temperature changes affect TI thickness through SI formation at the top of the ice cover. Throughout the winter, the main effect of air-temperature changes is to determine congelation-ice growth rates and thickness; consequently, there is minimal variability in SI/TI ratios (Fig. 3a).
The effects of monthly snow-depth change are large and occur throughout the winter (Fig. 3b). In each month from October to April, decreasing the snow depth reduces the thermal resistance of the snow cover and effects a decrease in SI thickness, an increase in CI thickness, a decrease in TI thickness and a decrease in SI/TI ratio. Conversely, increasing the snow depth increases the snow load, and results in an increase in SI thickness, a decrease in CI thickness, an increase in TI thickness and an increase in SI/TI ratio. These effects are much smaller in April than in the previous 6 months because: (1) a decrease in snow depth (thermal resistance) is offset by increasing air temperatures, less negative snow and ice temperature gradients and thus low CI growth rates; and (2) an increase in snow depth (snow load) occurs at or near the time of maximum ice thickness and buoyancy, and thus a lower likelihood of deep flooding and snow ice accretion at the surface.
The timing of maximum ice thickness is affected by air-temperature changes only in April (Fig. 2a). Maximum ice thickness occurs 6 days earlier when air temperatures are increased, and 7 days later when air temperatures are decreased. The date of maximum ice thickness does not change with changing snow depth (Fig. 2b).
5. Discussion and Conclusions
In the late 20th and early 21st centuries there has been growing evidence of significant change in the cryosphere in Alaska and the vicinity (e.g. sea ice (Rothrock and others, 1999; Serreze and others, 2003), glaciers (Arendt and others, 2002) and permafrost (Osterkamp and Romanovsky, 1999)). Some changes, such as the reduction of sea-ice extent in the Bering Sea (Niebauer, 1998) and earlier onset of snowmelt on the North Slope (Stone and others, 2001), have been attributed directly to the effect of increased northward warm-air advection associated with the PDO shift of 1976.
Here, we have shown through model simulations that the effects of the PDO shift on lake ice in central Alaska might include a shorter-duration ice cover due to earlier BU associated with the air-temperature increase, and a decrease in ice thickness and change in ice composition due to a reduction in snow-ice formation associated with a decrease in snow depth. The simulated ice duration and BU change in particular are realistic in the context of increasingly earlier ice BU on the Tanana River at Nenana, 80km west of Fairbanks (Sagarin and Micheli, 2001). The decrease in ice thickness is plausible insofar as satisfactory ice-thickness simulation has been achieved using local data (Jeffries and others, 2005).
The simulated consequences of the PDO shift were essentially the same whether the model was run for 10 or 24 year periods each side of the shift. Those consequences are carried over into the simulation of future climate-change effects when the 1952–75 and 1977–2000 long-term daily air-temperature and snow-depth averages are manipulated on an annual or monthly basis. That is, for any given manipulation (e.g. annual temperature change of +2˚C or annual snow-depth change of +50%), the resultant ice duration, thickness and SI/TI values for 1977–2000 are always slightly lower than those for 1952–75. The magnitude of climate-change simulation outcomes, i.e. predictions of future change, depend on the dates of the period in the past that is chosen for manipulation and climate variability and change during that period.
This is not the first study to illustrate that FU, BU and thus ice duration are most affected by annual air-temperature change, and that ice thickness is most affected by annual snow-depth change (Liston and Hall, 1995; Vavrus and others, 1996; Stefan and Fang, 1997; Zhang and Jeffries, 2000; Ménard and others, 2002b). It is the first study to illustrate the effects of changing air temperature and snow depth on a month-to-month basis, and the profound effects of snow-depth change on the composition of the total ice thickness.
Rather than decreasing the total ice thickness due to increased thermal resistance and thus reduced congelation-ice formation at the bottom of the ice cover, increasing snow depth has the opposite effect: total ice thickness increases due to the formation of snow ice at the top of the ice cover at the expense of congelation ice. A change in snow depth in any month during winter affects the total ice thickness and composition at the end of winter, whereas it is mainly October and November air-temperature changes that effect total ice thickness and composition changes, small as they are, at the end of winter. A change in air temperature in any month during winter affects ice duration through both FU and BU changes, whereas snow-depth changes affect only BU.
The results reveal the complexity of the possible response of lake ice to climate change, yet we took a relatively straightforward approach to the simulations. That is, we changed either air temperature or snow depth and left the other meteorological variables unchanged, i.e. eight air-temperature change and eight snow-depth change experiments. For the chosen range and increments of air-temperature and snow-depth change, there are actually 81 possible experiments, not 16. The number of possible experiments increases if some cloud-cover and wind-speed experiments are added. The testing of the PDO simulations to wind-speed sensitivity revealed the potential role of wind speed in FU, and Liston and Hall (1995) have illustrated the sensitivity of ice thickness to wind-speed and cloud-cover change.
The results apply only to lake ice growth and decay on shallow lakes in central Alaska. A complete assessment of the effects of the PDO shift and predictions of future climate-change effects on lake ice in Alaska requires simulations for other locations with different climate conditions. Hartmann and Wendler (2003), for example, divided Alaska into four zones and showed that temperature response to the PDO shift was not uniform throughout the state due to variations in maritime, continental and Arctic influence. One would expect those temperature changes, combined with precipitation differences between zones (e.g. the dry, Arctic climate of northernmost Alaska vs the wet, maritime climate of the region bordering the north Pacific Ocean) to cause large variations in lake ice phenology, thickness and composition.
A program of lake ice growth and decay simulation of this scope would be a challenging but worthwhile undertaking. Observations, measurements and modelling have each revealed lake ice to be a sensitive indicator of climate variability and change (e.g. Liston and Hall, 1995; Magnuson and others, 2000), and changes in lake ice can have profound effects on the ecology of lakes (e.g. Schindler and others, 1990). The simulation effort ought to be accompanied by a program of observations and measurements for continued model evaluation, particularly for testing simulations after model improvements.
Jeffries and others (2005), for example, have suggested the need to improve the albedo parameterization, which is currently based on ice thickness. In view of the large changes in ice composition and thickness that the current model predicts will occur as snow depth changes, an albedo parameterization that takes into account the albedo differences between snow ice and congelation ice would be an important development. Because snow ice has a higher albedo than congelation ice, it can slow the ice-thinning rate during the decay season (Ashton, 1986, p. 355); hence, an albedo parameterization that takes compositional differences into account might allow better insight into the sensitivity of BU to snow-depth change.
Acknowledgements
This work was made possible with the support of US National Science Foundation (NSF) grant OPP 0117645 and the International Arctic Research Center (IARC) at the University of Alaska Fairbanks under the auspices of NSF Cooperative Agreement OPP 0002239. CLIMo was developed with support from the Meteorological Service of Canada.


