

Bacillus natto is a subspecies of Bacillus subtilis. It belongs to the Gram-positive aerobic bacteria species with long rod-like cells, acid and heat resistance and strong pathogenic bacteria inhibition ability(Reference Song, Kang and Wang1,Reference Wu, Chang and Shih2) . B. natto can secrete a variety of proteases (especially alkaline protease), glucoamylase, lipase and amylase. It can decompose proteins, fats, carbohydrates and other macromolecular substances into small peptides, amino acids, organic acids, oligosaccharides and other components that are easily absorbed by the human body and can produce amino acids, thereby improving the utilisation of fermentation products(Reference Choo, Lee and Yoon3,Reference Meng, Dong and Zhang4) . B. natto has been reported to show a variety of functions, including blood pressure lowering(Reference Jemil, Mora and Nasri5), anti-tumour(Reference Chen, Ai and Wang6), thrombolytic(Reference Peng, Wang and Kang7), etc. Moreover, as a probiotic, it plays an effective role in animals through the following mechanisms: production of antibiotics, competition with harmful bacteria for nutrition, alleviation of emergency response and enhancement of immunity(Reference Li, Wang and Li8). Therefore, B. natto has become a research hotspot these years. As one of the forty probiotics announced by the US Food and Drug Administration, it has been widely used in medicine, health food, agriculture, animal husbandry and other fields to date(Reference Yamashita, Oda and Giddings9).
Infant period is the fastest growing period after birth, in which adequate nutrition can lay a good foundation for health throughout life. It is not only necessary for physical growth of infants and young children but also the material basis for the formation of social behavioural abilities such as cognitive ability, language development and intelligence, physical strength and immunity(Reference Brown and Pollitt10). And among which protein, sugar and flavonoids are important factors that can affect brain development and growth. The fermentation products of B. natto have been reported to exhibit high antioxidant activity, and good scavenging capacity of 2,2'-diphenyl-1-pyridine hydrazine free radicals and hydroxyl free radicals(Reference Terlabie, Sakyi-Dawson and Amoa-Awua11,Reference Chu, Zhao and Lu12) which is so important for eliminating excessive free radicals in the body and improving or enhancing cognitive ability(Reference Ming-Yu, Ying-Ju and Liang-Hung13–Reference Introini, McGaugh and Baratti15). In addition, antioxidants have been found to improve learning ability. Extracts of natural products such as onion(Reference Nishimura, Higuchi and Tateshita16) and green tea(Reference Chan, Hosoda and Tsai17) can reverse memory impairment, reduce lipid peroxides and increase antioxidant enzyme activity in brain. The antioxidant capacity for fermentation broth of B. subtilis has important research significance for improving current human growth with age, cognitive decline and children’s growth and development(Reference Subash, Essa and Braidy18,Reference Go, Kim and Kwak19) .
The regulation of gut microbiota (GM) has become an important way for humans to treat gastrointestinal and metabolic diseases(Reference Delzenne, Knudsen and Beaumont20), and it plays an important role in the intestinal morphology, immunity, digestion and health of the host(Reference Ma, Wang and Zhang21,Reference Jazi, Boldaji and Dastar22) . A healthy GM ecology is critical for the establishment of tissue homeostasis health. Gut homeostasis plays a crucial role in maintaining animal and human health and is depended on the regulation of the microbiota(Reference Quigley23). Therefore, regulating the richness or diversity of intestinal microbes, thereby promoting the normal metabolism of GM, is of great significance to the health of the human body. Studies have shown the beneficial effects of probiotics in improving the GM, and they can further promote human health, immunity and digestion(Reference He, Mao and Wen24,Reference Hatanaka, Yamamoto and Suzuki25) . It has been reported that B. subtilis can effectively regulate GM(Reference Yao, Zhang and Wang26,Reference Li, Xu and Huang27) . It was demonstrated that a higher dose of B. subtilis administration ameliorated dextrose sulfate sodium (DSS)-induced dysbiosis and gut inflammation by balancing beneficial and harmful bacteria and associated anti- and pro-inflammatory agents, therefore aiding intestinal mucosa recovery from DSS-induced injuries(Reference Zhang, Li and Xu28). It was also well documented that B. subtilis can improve GM(Reference Hayashi, Lourenço and Kraieski29). As one of B. subtilis, B. natto, showing remarkable potential in regulating GM, has important clinical significance for lipid lowering and anti-cancer.
Peanut meal (PM) is a by-product of peanut oil pressed at high temperature(Reference Chen, Kong and Chi30). It is rich in protein, peanut fibre, minerals, vitamins, peanut polyphenols, etc. The protein content is as high as 47–55 %, and the biotin content is 1·79 mg/kg(Reference Shen, Qin and Wang31). China is the world’s largest producer for peanuts, of which about 50–60 % are used to extract oil, producing millions of tons of petroleum by-products (PM) per year(Reference Yang, Teng and Wang32,Reference Wang, Zhao and Li33) . However, PM has been merely utilised as an animal feed or even fertiliser so far, due to its protein denaturation caused by high-temperature pressing, imbalance of amino acid content and high-level aflatoxin contamination(Reference Wang, Niu and Hui34,Reference Costa, Miller and Pesti35) , causing waste issue to these mass resources. Herein, the high-value utilisation of PM remains challenging to date(Reference Hayashi, Lourenço and Kraieski29). Recently, evidences suggest that the microbial fermentation of PM can significantly improve its nutritional characteristics, increase the content of protein, small molecular peptide, amino acid and organic acid and improve its digestibility in vitro, which provides a new approach to settle the matter(Reference Yang, Teng and Wang32,Reference Zhou, Chen and Kong36) . Nonetheless, rare in-depth studies can be found on the benefits of PM fermented by B. subtilis species in experiments in vivo so far.
In the present study, mice were fed with PM extract fermented by B. natto to study the regulation of growth performance, learning and memory ability and GM in mice, which provided important reference for high-value utilisation and clinical research of PM.
Materials and methods
Animals
A total of ninety weanling male Kunming (KM) mice (20 (SE 2) g) were purchased from the Experimental Animal Center of Shandong Lukang Pharmaceutical Co. Ltd (animal quality qualification certificate no. SCXK (Lu) 20140001). The mice were fed with sterile food and water, and the temperature in the animal room was maintained at 24 (SE 2)°C with a 12 h light–12 h dark cycle.
Materials
B. subtilis was isolated from Japanese natto, which was preserved in Food Engineering Laboratory in Qingdao University. The PM was supplied by Qingdao Jiali Group Co. Ltd. The soyabean meal and wheat bran were purchased from local market. The mainly used agents were as follows: ampicillin (Zhuhai federal pharmaceutical Co. Ltd); Phusion® High-Fidelity PCR Master Mix with GC Buffer (New England Biolabs); Gene JET Gel Extraction Kit (Thermo Scientific); IlluminaTruSeq DNA PCR-Free Library Preparation Kit (Illumina) and Qubit@ 2·0 Fluorometer (Thermo Scientific). And, other chemical reagents were purchased from Sinopharm Chemical Reagent Co. Ltd.
Preparation of fermented extracts from peanut meal
PM–soyabean meal–bran (7:2:1) was placed in a fermentation medium, and then the seed liquid of B. natto was inoculated. The mixture was cultured for 38 h at 37°C afterwards(Reference Elumalai, Park and Cho37). Ferments were centrifuged, filtered and freeze-dried for reservation (fermented PM extract (FE)).
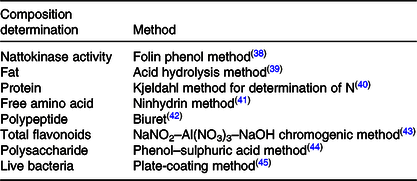
Composition determination in fermented peanut meal extract
The compositions to be analysed in FE and the related test methods are listed in Table 1.
Composition in fermented peanut meal extract and determination methods
Experimental groups
Expt I: After a week of habituation, mice were randomly divided into five groups as follows: (N) normal group: saline; low-dose FE group: 0·3 g/kg per d; middle-dose FE group (MFE): 1·5 g/kg per d; high-dose FE group (HFE): 7·5 g/kg per d and unfermented extraction group (UFE). Mice were gavaged once per d for 4 weeks, and the dosage for each gavage was 0·1 ml/g body weight (BW) per d. And then, ten mice from each group were randomly selected for the evaluation of growth performance, learning and memory skills.
Expt II: Regulation of PM fermentation on antibiotic-induced microbial imbalance in mice. After 1 week of adaptive feeding, mice were randomly divided into four groups: (A) normal group; (B) model group; (C) natural recovery group; (D) FE group. Except for normal saline group, the other groups were given FE for 4 weeks. The dosage of FE was the same as that of Expt I. After 4 weeks, except normal saline group, the other three groups began to induce diarrhoea: (B) model group: ampicillin; (C) natural recovery group: ampicillin + saline; (D) FE group: ampicillin + FE (0·1 ml/g BW per d). Among them, ampicillin dose was 2 mg/g BW per d, which was five times the adult dose. The mice in each group were killed after 1 week of continuous intragastric administration. In an aseptic environment, the intestinal contents were taken out and frozen and stored at –80°C for later evaluation.
Morris water maze tests
After intervention for 4 weeks, learning and memory skills were measured by the Morris water maze (MWM) tests(Reference Tomas Pereira and Burwell46). The experiment was performed as previously described(Reference Ma, Wang and Dong47–Reference Kang, Shin and Kim49): Mice were trained for 5 d. Daily training comprised of four sessions, starting at different quadrants of the water tank. The latency was recorded to reach the hidden platform. The rats were trained four times/d and put into the water from four entry points for 5 d. The time from entering water to climbing the platform within 60 s was recorded, that is, escape latency. If the mice did not find the platform within 60 s, it was induced to the platform with a rod and kept for 10 s. The incubation period was recorded as 60 s. After 5 d, the platform was removed and the mice were placed in the opposite side of the original platform quadrant. Then, the time ratio (the ratio of swimming time:total swimming time in the target quadrant), the distance ratio (the ratio of swimming distance:total swimming distance in target quadrant) and the number crossing over the position of the platform were recorded. Lastly, the data were recorded by an MWM image analysis system (Mobile Datum). After 24 h of MWM test, mice were killed by dislocation. Liver, spleen and kidney were separated immediately. The mice were weighed on ice and frozen in liquid N2 and then preserved at –80°C for later evaluation.
16S rDNA amplicon sequencing
Faecal bacterial DNA extraction
The DNA of faecal bacteria was extracted by cetyltrimethylammonium bromide/sodium dodecyl sulfate (SDS). The faecal DNA samples were concentrated and purified by 1 % agarose gel electrophoresis and UV spectrophotometer. Then, it was diluted to 1 ng/ul with sterile water according to the concentration and was preserved at –80°C as a template for 16S rDNA analysis.
16S rDNA gene PCR amplification and sequencing
The primers 515 F (5′-CACGGTCGKCGGCGCCATT-3′) and 806 R (5′-GGACTACHVGGGTWTCTAAT-3′)(Reference Li, Zhang and Gu50,Reference Li, Gao and Chen51) were used to amplify the V4 domain of bacterial 16S rDNA. And then, 5–10 ng DNA templates, 15 μl of Phusion® High-Fidelity PCR Master Mix and 2 μm of each primer were contained in 30 μl PCR reaction. Reaction conditions were as follows: an initial denaturation at 98°C for 1 min, followed by thirty cycles of 98°C for 10 s, 50°C for 30 s and 72°C for 30 s and a final extension of 72°C for 5 min. The same volume of 1× loading buffer (contained SYBR® Green) was mixed with PCR products and went for electrophoresis detection on 2 % agarose gel. The samples with bright main strip between 400 and 450 bp were chosen for further experiments. PCR products were mixed in equidensity ratios. Subsequently, mixture PCR products were purified with a Gene JET Gel Extraction Kit. Sequencing libraries were generated using an Illumina TruSeq DNA PCR-Free Library Preparation Kit following manufacturer’s recommendations, and index codes were added. The library quality was assessed on Qubit@ 2·0 Fluorometer and Agilent Bioanalyzer 2100 system. Finally, the library was sequenced on an Illumina HiSe platform, and 250 bp paired-end reads were generated.
16S rDNA gene analysis
Paired-end reads from the original DNA fragments were merged using FLASH(Reference Magoc and Salzberg52), a very fast and accurate analysis tool which is designed to merge paired-end reads when there were overlaps between reads 1 and reads 2. Sequences were analysed using QIIME software package (Quantitative Insights into Microbial Ecology)(Reference Caporaso53), and in-house Perl scripts were used to analyse α- (within samples) and β- (among samples) diversity. Sequences with ≥97 % similarity were assigned to the same operational taxonomic unit (OTU). A representative sequence for each OTU was picked, and the RDP classifier(Reference Wang, Garrity and Tiedje54) was used to annotate taxonomic information for each representative sequence. In order to compute α diversity, the OTU table was rarified and three metrics were calculated: Chao1 which estimates the species abundance; Observed Species which estimates the amount of unique OTU found in each sample and Shannon index. Rarefaction curves were generated based on the three metrics. Significant differences in taxonomic abundance between groups were tested by using the Wilcoxon rank sum test.
Statistical analysis
Data analyses were performed with SPSS Statistics 17.0 software. The significant differences of data were analysed by one-way ANOVA with Fisher’s least-significant difference (LSD) test. All results are presented as mean values with their standard errors, and the significant criterion was set for P < 0·05.
Results
Main composition of fermented peanut meal extract
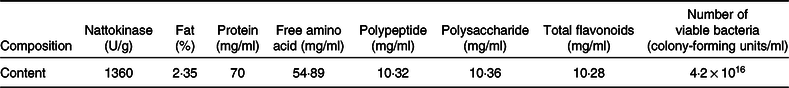
The tested results of the main composition of FE are listed in Table 2.
Determined main composition in fermented peanut meal extract
Effects of growth and development
The effects of FE on growth performance in mice were investigated, and the results are shown in Fig. 1. Compared with group N, average daily weight gain (ADG) index of mice in low-dose FE group, MFE and HFE was significantly increased and there were significant differences in the HFE group (P < 0·05), as shown in Fig. 1(A). It can be observed from Fig. 1(B)–(D) that there were no notable differences in liver, spleen and kidney index between low-dose FE group, MFE, HFE and group N (P > 0·05). The growth and organ index were affected by the fermentation products. It can be inferred from the effect of FE on growth and organ indexes of experimental mice that FE showed no harmful effect to the health of experimental animals.
(A) Average daily body weight gain (ADG) of mice in each group; (B) liver index of mice in each group; (C) spleen index of mice in each group; (D) kidney index of mice in each group. ADG = (last weight − first weight)/test date; viscera index = viscera weight (g)/body weight (g) × 100 %; values are presented as mean values with their standard errors. aP < 0·05 v. N group; bP < 0·05 v. UFE group. N, normal group; LFE, low-dose of fermented peanut meal extract (FE) group; MFE, middle-dose of FE group; HFE, high-dose of FE group; UFE, unfermented extraction group.

Morris water maze test
The MWM was performed to evaluate the effects of FE on the learning and memory skills of mice. The swimming trajectory of each experimental group during probe tracking is shown in Fig. 2(A).
(A) Swimming trajectory of mice from each group in probe trial; (B) escape latencies of each group in 5 d training trials; percentage of time (C) and distance (D) in target quadrant; number crossing over the position of the platform (E) and swimming speeds (F) in the probe trial. Values are presented as mean values with their standard errors. (B) ![]() , N;
, N; ![]() , LFE;
, LFE; ![]() , MFE;
, MFE; ![]() , HFE;
, HFE; ![]() , UFE. a P < 0·05 v. N group; b P < 0·05 v. UFE group. N, normal group; LFE, low-dose of fermented peanut meal extract (FE) group; MFE, middle-dose of FE group; HFE, high-dose of FE group; UFE, unfermented extraction group.
, UFE. a P < 0·05 v. N group; b P < 0·05 v. UFE group. N, normal group; LFE, low-dose of fermented peanut meal extract (FE) group; MFE, middle-dose of FE group; HFE, high-dose of FE group; UFE, unfermented extraction group.
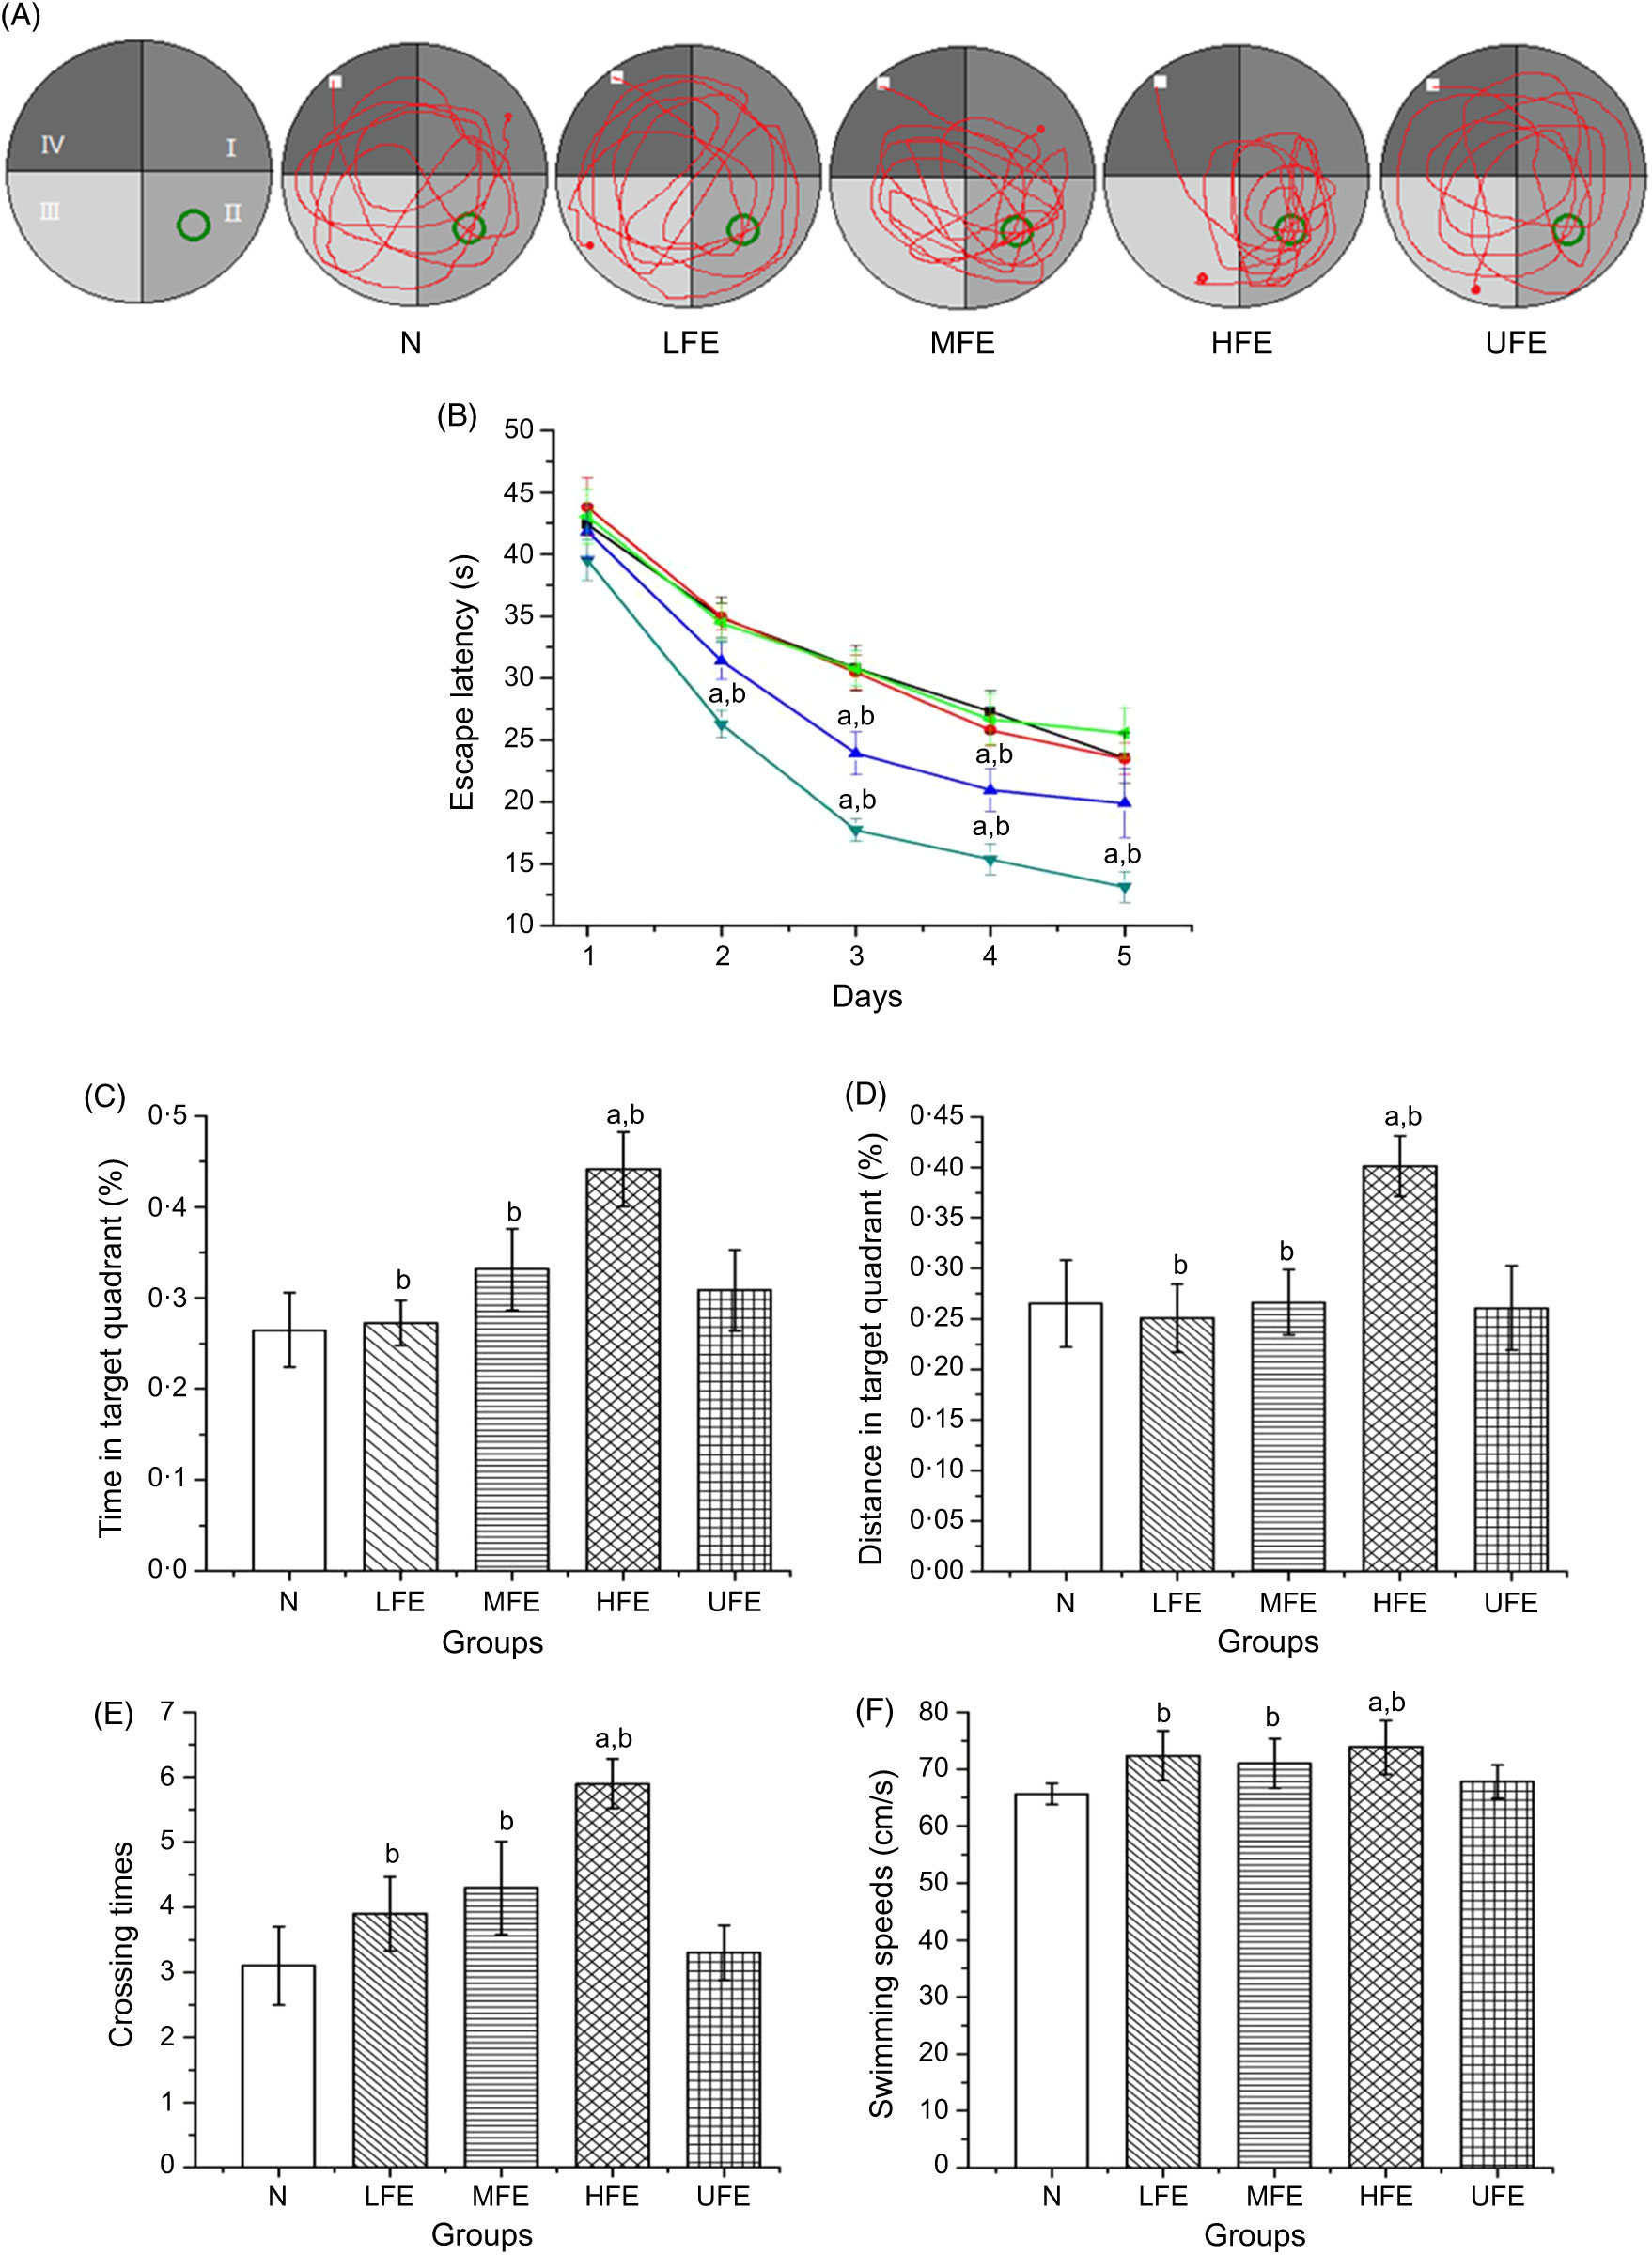
As shown in Fig. 2(B), the escape latencies during training tests showed remarkable differences within each group. On the 1st day of training, the average latency of mice in each group exhibited no statistical difference (P > 0·05). On the 2nd day, the average latency of mice in the HFE group was significantly shorter than that in N group and UFE group (P < 0·05). On the 3rd and 4th days, the average latency of mice in MFE and HFE groups was significantly shorter than that in N and UFE groups (P < 0·05). And on the 5th day, the average latency of mice in the HFE group was significantly shorter than that in N group and UFE group (P < 0·05).
After 5 d of training, the platform was removed and the probe trajectory was started. The results are shown in Fig. 2(C)–(F). The HFE group showed a larger percentage of swimming time and distance in target quadrant when compared with the N group and UFE group (P < 0·05). Furthermore, it can be found that the HFE group was crossed over the location where the hidden platform was located more frequently than the N group and UFE group (both P < 0·05). There were no remarkable differences of the swimming speeds within different groups during the probe test (P > 0·05). It can be inferred from the results that the high dose of contraction from fermented PM can improve the learning and memory skills in mice.
At the same time, the platform was removed and the swimming trajectories of mice in each group were measured. It can be observed from Fig. 2(C) and (D) that the percentage of swimming time and distance in target quadrant in the HFE group were higher than that in N group and UFE group (P < 0·05). Moreover, as seen in Fig. 2(E) and (F), the frequency of crossing the latent platform position in the HFE group was higher than that in N group and UFE group (P < 0·05). However, there were no significant differences in swimming speed among the groups in the probe test (P > 0·05). It can be inferred that PM after fermentation can improve the learning and memory ability of mice based on the experimental data.
Changes of gut microbiota
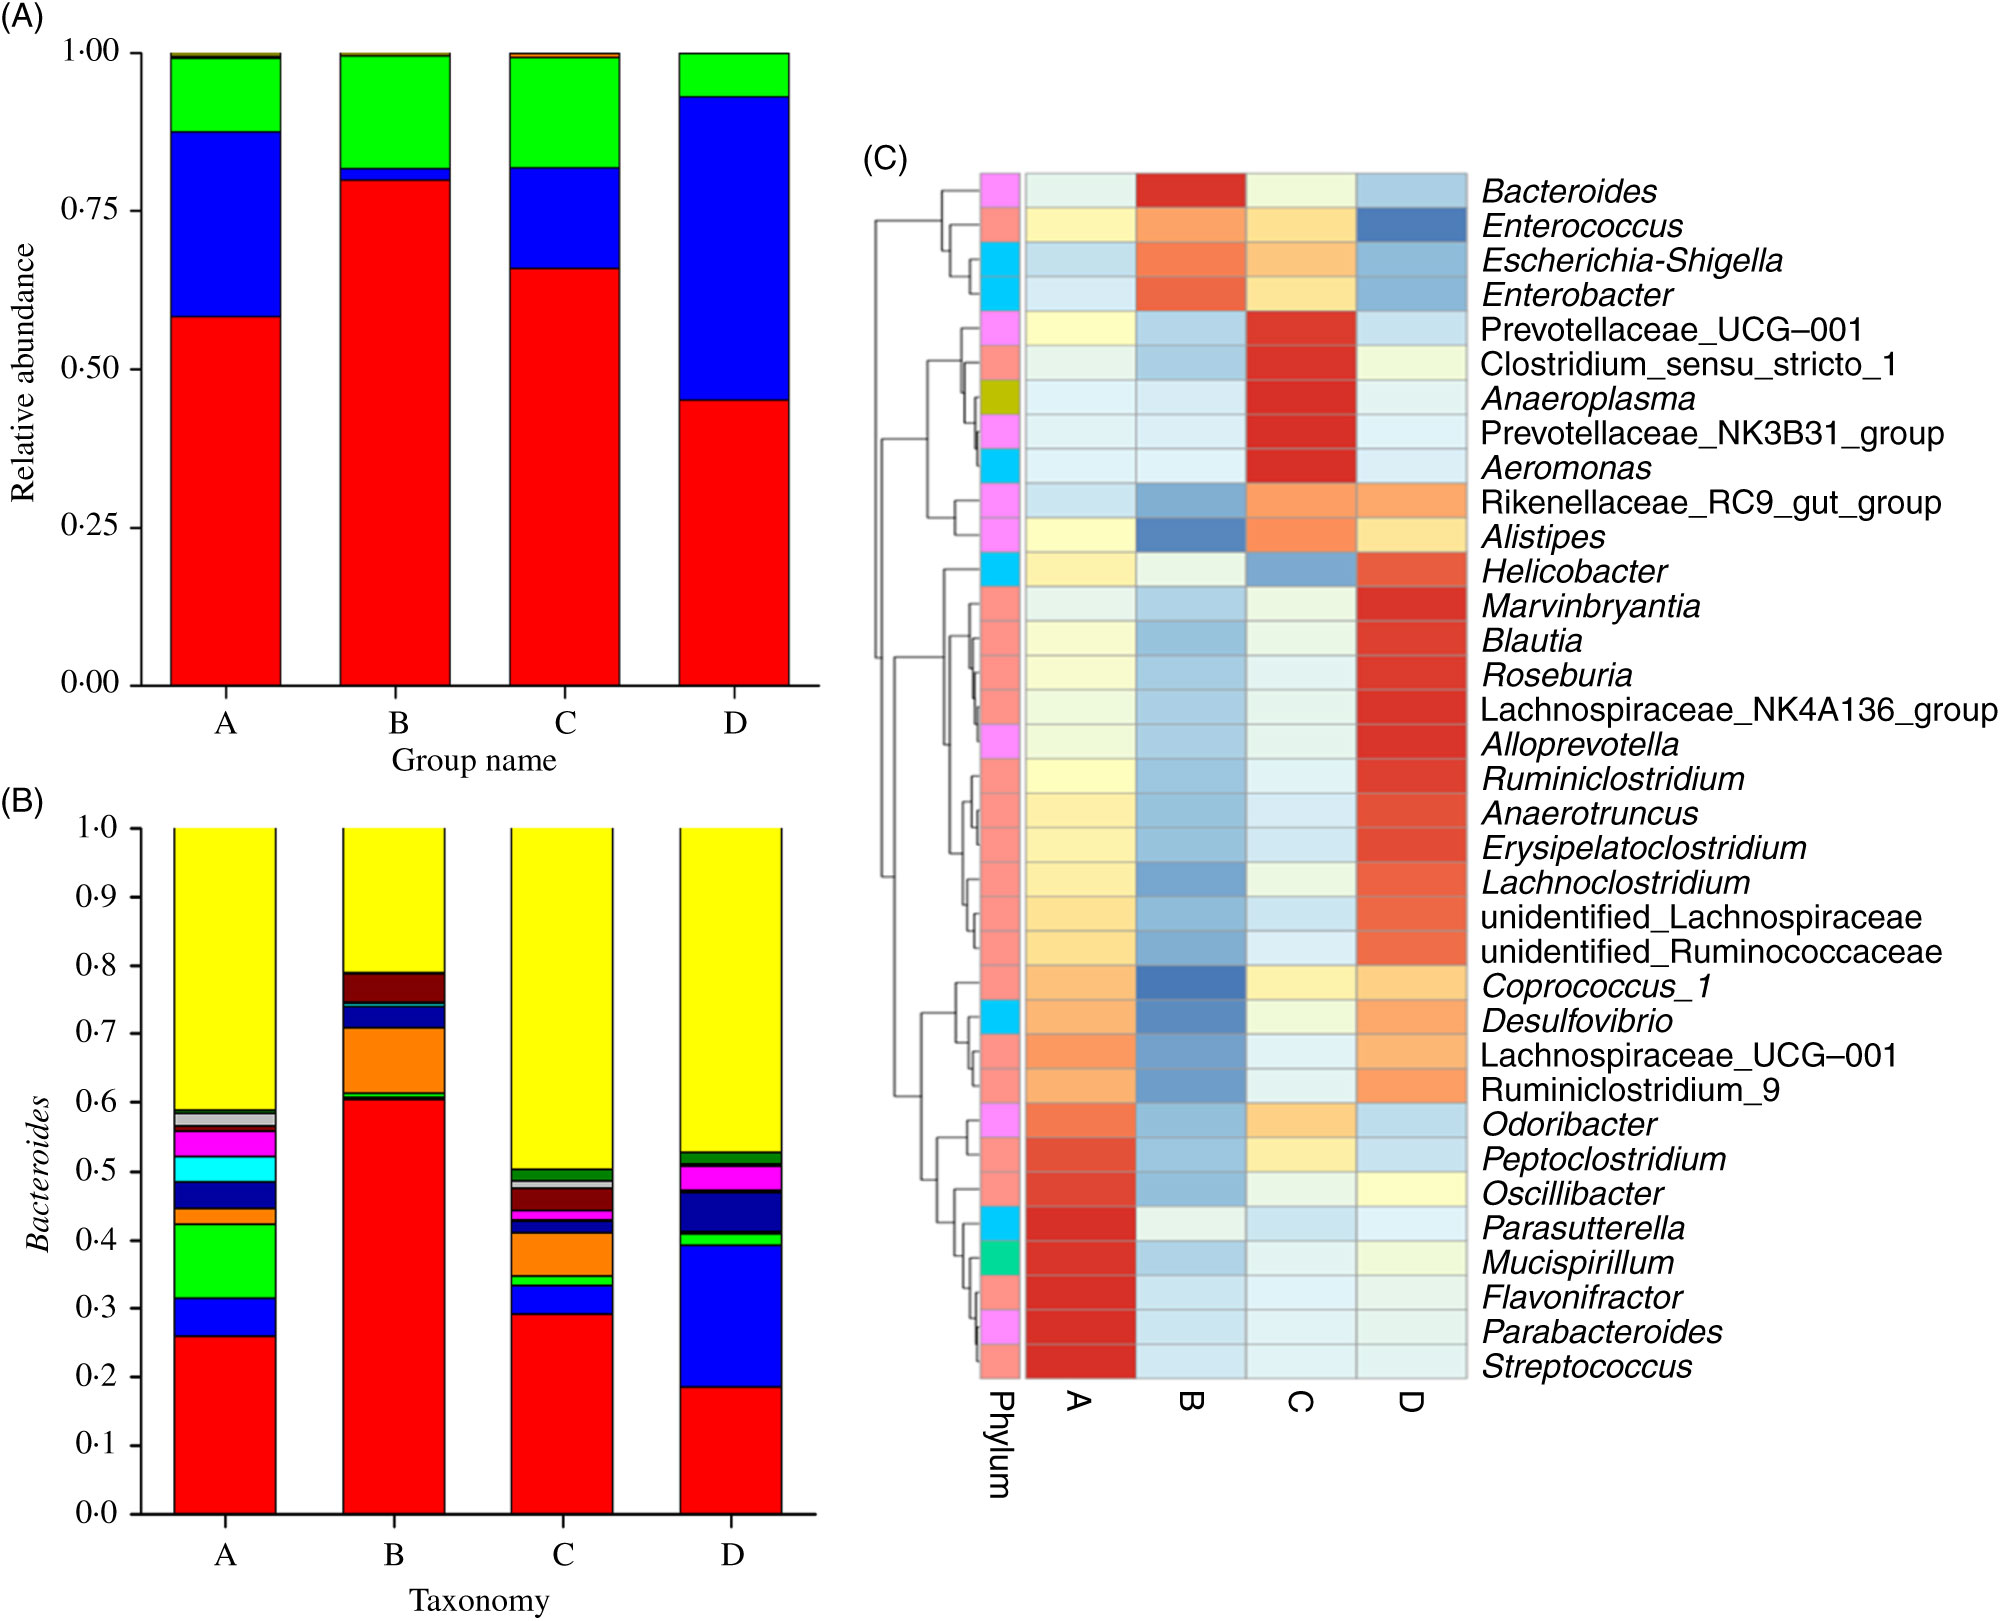
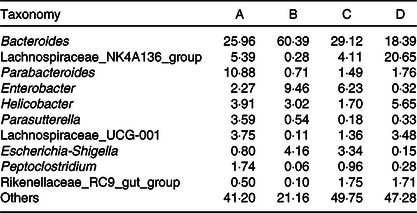
Fig. 3 displays the changes in the composition of GM at the phylum and genus levels in mice. It can be seen that the dominant gates are Bacteroidetes, Firmicutes and Proteobacteria. For Bacteroidetes, the relative content of group B was the highest (79·87 %), followed by group C (65·90 %), group A (58·22 %) and group D (45·10 %). At the level of door, the order of groups from high to low was group D (47·85 %), group A (29·28 %), group C (15·79 %) and group B (1·78 %). As can be seen in Fig. 3(A), the higher relative content was group B (17·73 %) and group C (17·60 %), followed by group A (11·63 %) and group D (6·92 %). As shown in Fig. 3(B) and Table 3, at the generic level, Bacteroides, Parabacteroides, Lachnospiraceae and Helicobacter were the most abundant bacteria in group A; Bacteroides, Enterobacter, Escherichia-Shigella were the main bacteria in group B; Bacteroides, Enterobacter, Lachnospiraceae and Escherichia-Shigella were the main bacteria in group C. Group D consisted mainly of Lachnospiraceae, Bacteroides and Helicobacter.
(A) Relative abundances of the gut microbiota at the phylum level in mice of each group. The stack column diagram indicates the bacterial phyla composition of different groups, and different colours represent different kinds of bacterial phyla. (B) Relative abundances of the gut microbiota at the genus level in mice of each group. The stack column diagram indicates the bacterial genus composition of different groups, and different colours represent different kinds of bacterial genus. (C) Cluster map of species abundance. A, normal group; B, model group; C, natural recovery group; D, fermented peanut meal extract group. (A) ![]() , Others;
, Others; ![]() , Fusobacteria;
, Fusobacteria; ![]() , Cyanobacteria;
, Cyanobacteria; ![]() , Actinobacteria;
, Actinobacteria; ![]() , Deferribacteres;
, Deferribacteres; ![]() , Tenericutes;
, Tenericutes; ![]() , Proteobacteria;
, Proteobacteria; ![]() , Firmicutes;
, Firmicutes; ![]() , Bacteroidetes. (B)
, Bacteroidetes. (B) ![]() , Others;
, Others; ![]() , Rikenellaceae_RC9_gut_group;
, Rikenellaceae_RC9_gut_group; ![]() , Peptoclostridium;
, Peptoclostridium; ![]() , Escherichia-Shigella;
, Escherichia-Shigella; ![]() , Lachnospiraceae_UCG-001;
, Lachnospiraceae_UCG-001; ![]() , Parasutterella;
, Parasutterella; ![]() , Helicobacter;
, Helicobacter; ![]() , Enterobacter;
, Enterobacter; ![]() , Parabacteroides;
, Parabacteroides; ![]() , Lachnospiraceae_NK4A136_group;
, Lachnospiraceae_NK4A136_group; ![]() , Bacteroides. (C)
, Bacteroides. (C) ![]() , 1;
, 1; ![]() , 0·5;
, 0·5; ![]() , 0;
, 0; ![]() , −0·5;
, −0·5; ![]() , 0;
, 0; ![]() , −1; Phylum:
, −1; Phylum: ![]() , Bacteroidetes;
, Bacteroidetes; ![]() , Deferribacteres;
, Deferribacteres; ![]() , Firmicutes;
, Firmicutes; ![]() , Proteobacteria;
, Proteobacteria; ![]() , Tenericutes.
, Tenericutes.
Relative abundances of the gut microbiota at the genus level in mice of each group (%)
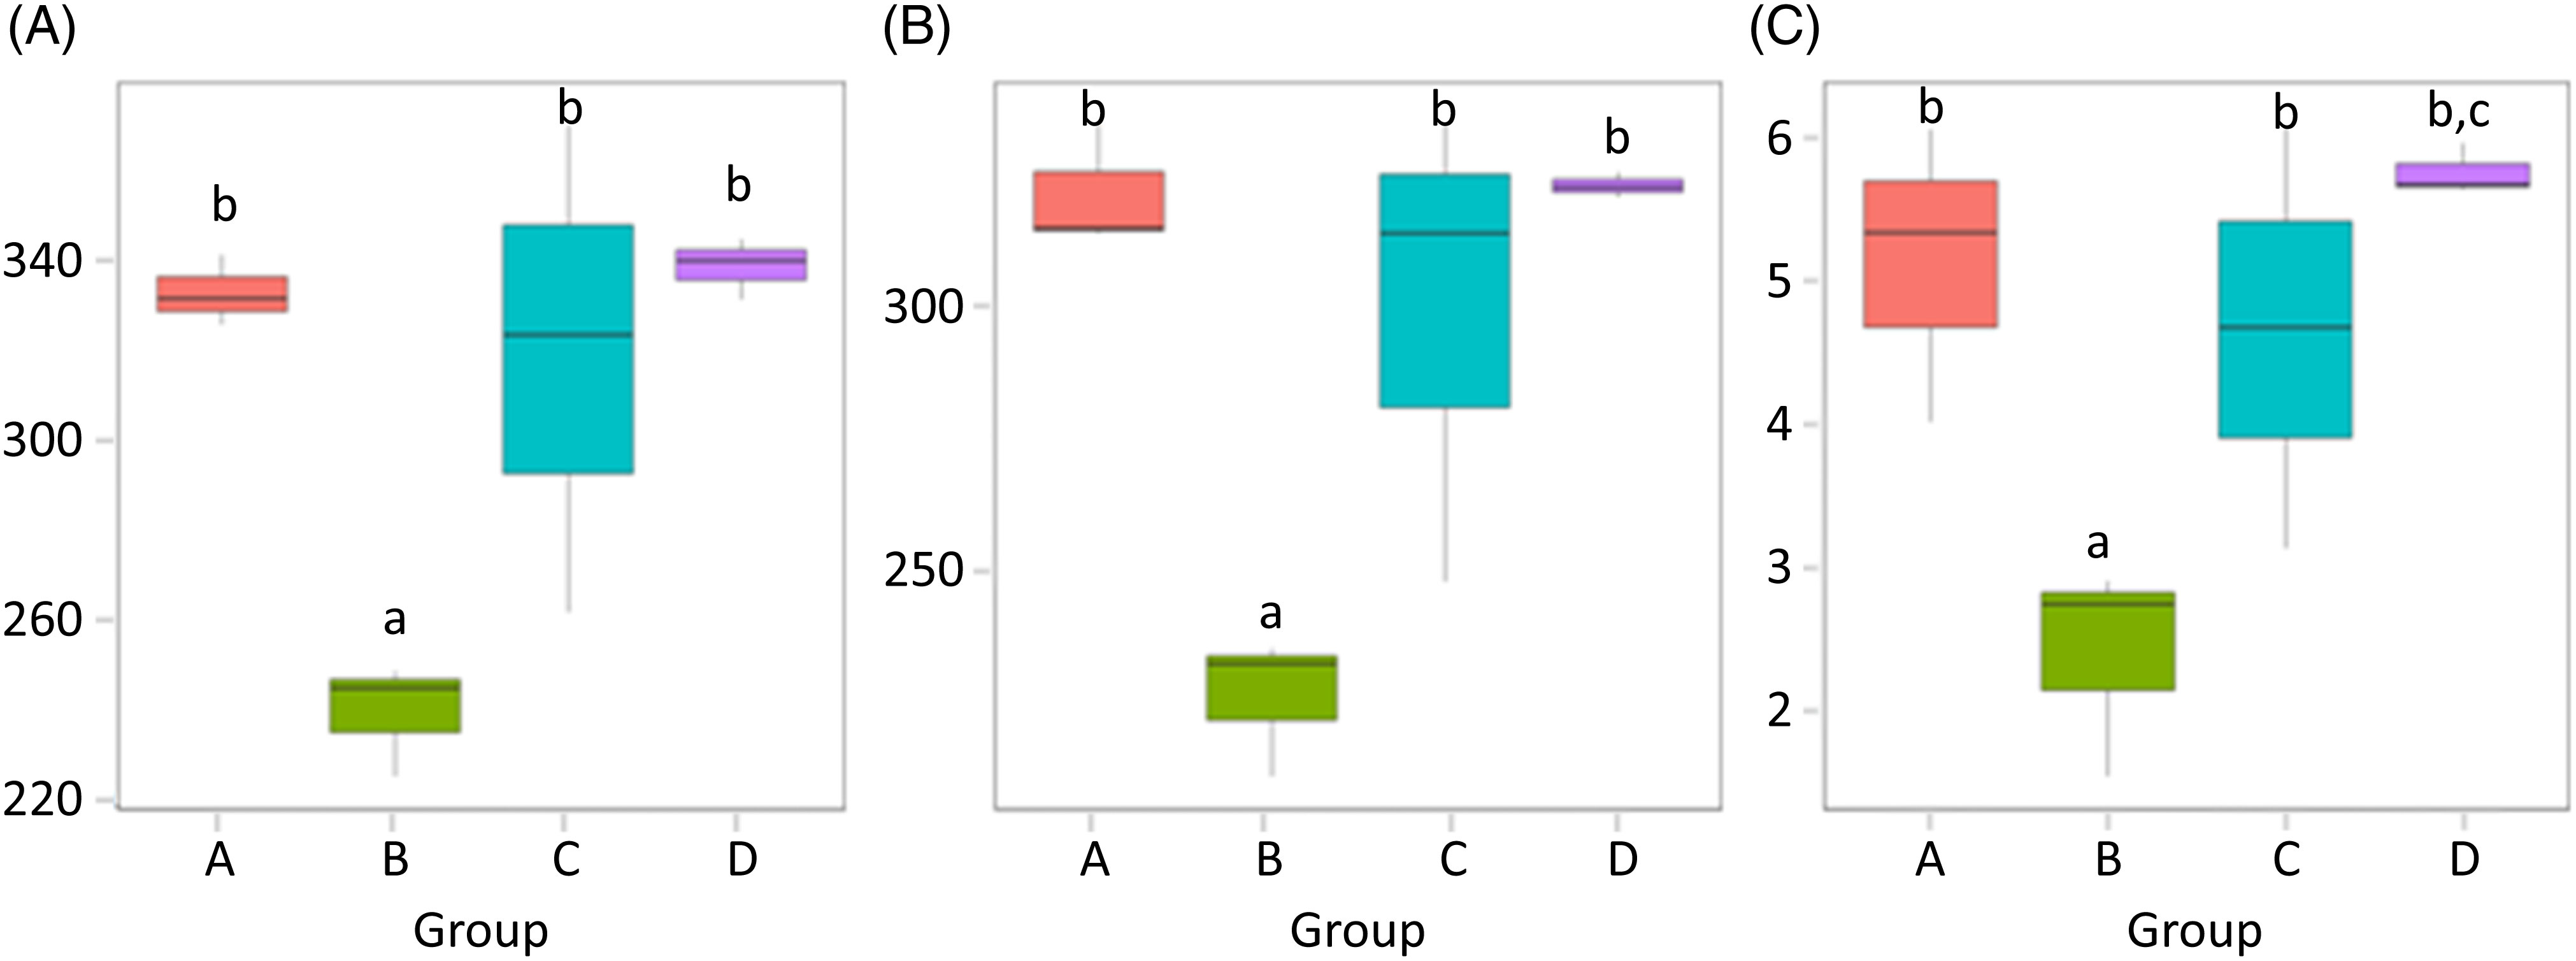
α-Diversity was applied to analyse the complexity of the species diversity for the samples, including community richness (Chao1) and diversity indices (Shannon). The Chao1 value is often used to estimate the total number of species in a sample, while Shannon indicates the α-diversity of intestinal microflora. The higher the Shannon is, the more evenly the distribution of microflora species is(Reference Jazi, Boldaji and Dastar22). As depicted in Fig. 4, the species abundance of group B significantly decreased compared with that of group A (P < 0·05). The species abundance of groups C and D both notably increased compared with that of group B (P < 0·05), and the Shannon value of group D was higher than that of group C (P < 0·05). α-Diversities were further tested by comparing the α-diversity indexes within the groups, and the results are shown in Table 4.
(A) Chao1 values; (B) observed species and (C) Shannon values of the gut microbiota in mice of each group. Values are presented as box plots. A, normal group; B, model group; C, natural recovery group; D, fermented peanut meal extract group. a P < 0·05 v. group A; b P < 0·05 v. group B; c P < 0·05 v. group C.
The P values of the five main α-diversity indices between groups
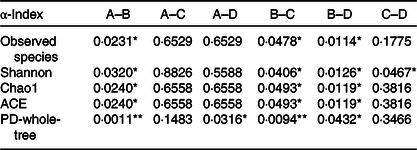
ACE, abundance-based coverage estimator; PD, phylogenetic diversity.
* P < 0·05, ** P < 0·01.
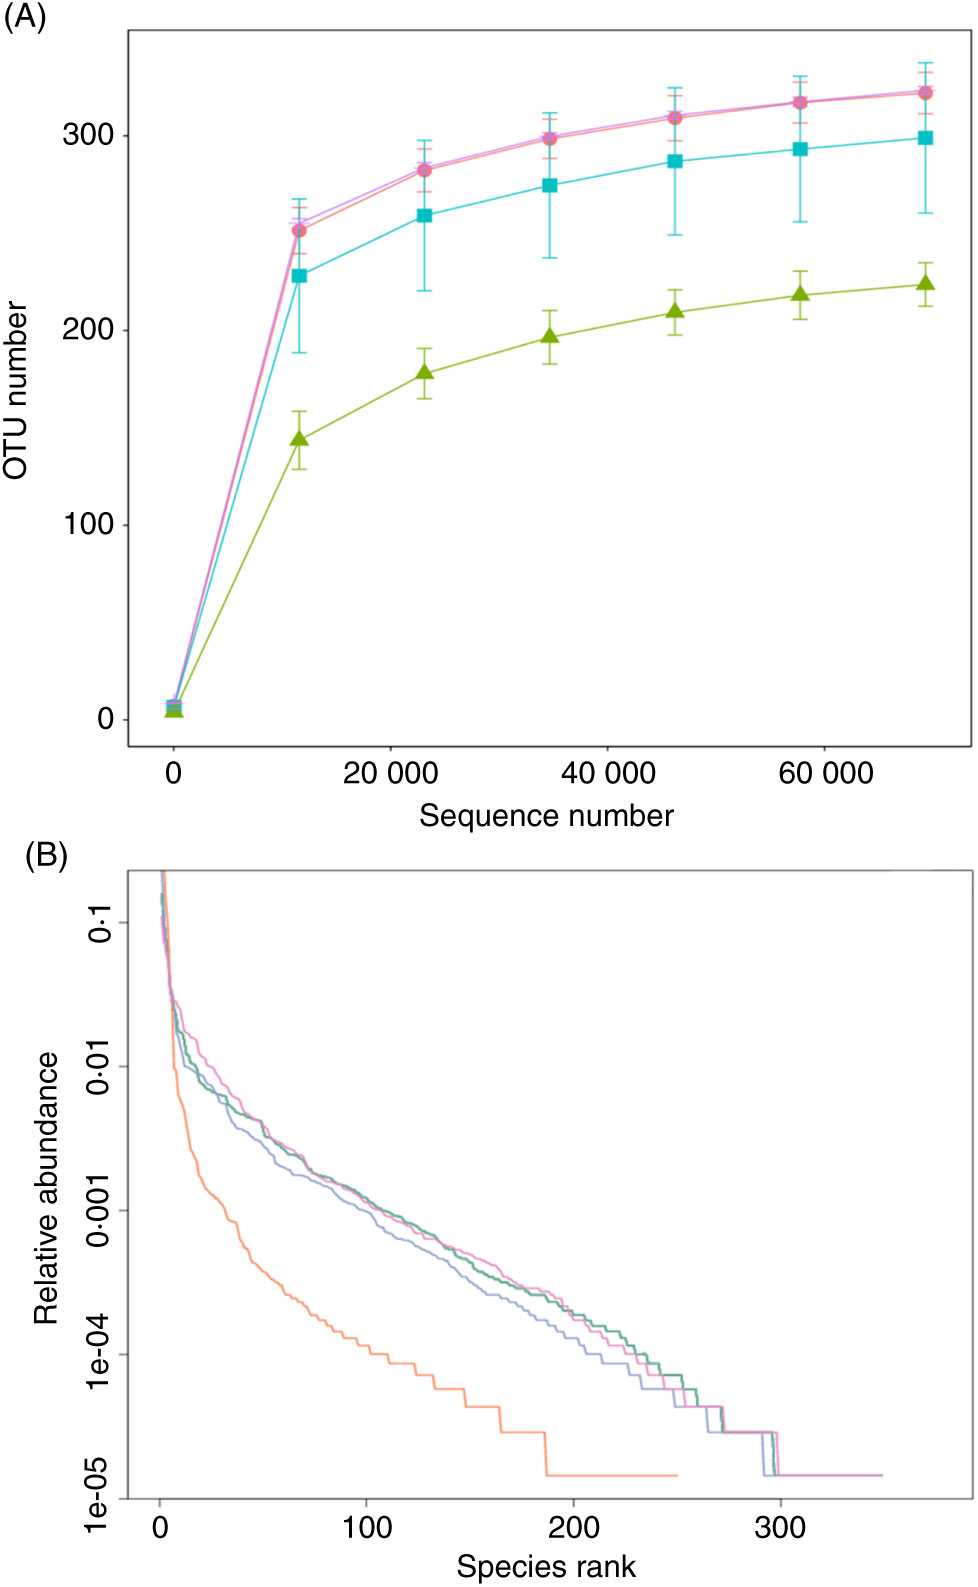
The effect of FE on the species richness of intestinal bacteria in mice is shown in Fig. 5. There were 322 OTU in group A, 224 OTU in group B, 299 OTU in group C and 323 OTU in group D, which indicates that FE can improve the richness of GM in antibiotic-induced diarrhoea mice. Moreover, as seen in Fig. 5(A), the dilution curve of each group was flat, suggesting that the sequencing quantity of the test can cover most of the micro-organisms in each sample. In addition, the curve width of group D was larger and smoother than that of group B, indicating that the species diversity of group D was more than that of group B. As shown in Fig. 5(B), compared with group A, the trend of group D was closer to that of group A, reflecting that the species diversity of fermented products was better than that of non-fermented products. It can be inferred that supplementation of natto fermentation products from PM can better alleviate and restore the richness of GM in mice.
(A) Rarefaction curves and (B) operational taxonomic unit (OTU) rank curves. A, normal group; B, model group; C, natural recovery group; D, fermented peanut meal extract group. (A) ![]() , A;
, A; ![]() , B;
, B; ![]() , C;
, C; ![]() , D. (B)
, D. (B) ![]() , A;
, A; ![]() , B;
, B; ![]() , C;
, C; ![]() , D.
, D.
Discussion
Growth performance is an important indicator of animal health and digestive function, while BMI and organ index are important manifestations of growth. Recently, more and more evidence shows that probiotic supplementation can promote animal growth and inhibit pathogenic micro-organisms(Reference Liu, Zeng and Yang55). In the present study, we found that the growth and development of mice supplemented with FE were better than that of mice supplemented with UFE, which may be related to the increase of nutritional characteristics of PM after fermentation. It was found that the protein content, polypeptide, polyphenol, DM content, organic acid and its digestibility in vitro of fermentation products were significantly increased. It is important to maintain a balance in essential amino acid content(Reference Costa, Miller and Pesti35). The increase of nutrients may be beneficial to the production of superoxide dismutase, which can eliminate the metabolic process of organisms, known as the first-line defensive role(Reference Steinmaus, Ferreccio and Yuan56). More importantly, antioxidants play an important role in enhancing learning and memory ability(Reference Xiang, Sun and Lu57), which is in accordance with the previous research(Reference Zhang, Bai and Zhang58).
In addition, improving cognitive ability plays an important role in preventing some neurological diseases. There are many facts affecting the development of intelligence, while food supplement is certainly one of them. MWM testing is generally considered to be associated with hippocampal-dependent memory tasks(Reference Tan, Nie and Zhu59), which are often used to assess learning and memory skills in mice. Learning and memory include at least three original processes: acquisition, consolidation and retention(Reference Yu, Liu and Zhang60). In the present study, training tests were designed to measure acquired and consolidated skills, while exploratory tests were designed to assess retention rates of learning and memory. It was found by us that the learning and memory abilities of mice in MFE group and HFE group were significantly improved, and the time ratio and distance ratio in target quadrant of mice in the HFE group were shorter. It can be seen from the side that the appropriate concentration of FE was conducive to improving learning and memory ability. This may be related to the improvement of nutrient composition of PM after fermentation and the increase of antioxidant enzymes activity in mice as well. Therefore, it can be inferred that supplementation of FE can improve the growth performance, learning and memory of mice, which is very important for promoting the growth and development of infants and adolescents and improving cognitive ability. In addition, further studies are needed to explore the possible underlying mechanism.
GM is a key determinant of nutritional intake, energy regulation and weight control. In addition to metabolic disorders, diet also plays a fundamental role in the formation of microflora(Reference Yuan, Li and He61). Inappropriate utilisation of antibiotics can lead to the imbalance of GM. Dysbacteriosis, which means that the number and proportion of normal flora in the human body have changed, can lead to the imbalance of ecology(Reference Jernberg, Lofmark and Edlund62). It has been reported that different antibiotics have different effects on GM(Reference Jernberg, Lofmark and Edlund63), in which ampicillin shows moderate effects, and the higher the dose, the stronger the inhibitory effect. In the present study, each group of mice was given different extracts of PM for 1 month and then ampicillin was selected to induce diarrhoea in mice, resulting in GM imbalance, and the preventive effect of FE on flora imbalance was observed. The intestinal probiotics are mainly anaerobic bacteria, and the main pathogen is aerobic bacteria. B. natto is a subspecies of B. subtilis. It belongs to non-pathogenic bacteria in aerobic bacteria and secretes bacteriostatin-like substances. It can competitively inhibit the growth of aerobic bacteria and provide conditions for the growth of anaerobic bacteria, thus increasing the number of beneficial bacteria in intestine(Reference Beaugerie and Petit64,Reference Khan, Ahmed and Zamzami65) . In order to investigate the specific changes of GM, we evaluated the relative abundance of dominant GM in mice by 16S rDNA sequencing. The results showed that the number of Bacteroides in group B was higher at the level of phylum and genus. The main flora composition in group C was similar to that in group B. The number of Bacteroides in group C was lower than that in group B, while still higher than that in groups A and D. The number of Bacteroides in group D was lower. However, the number of Lachnospiraceae and Helicobacter was higher. It can be seen that FE can significantly reduce the number of Proteobacteria and Firmicutes species in the intestinal tract of experimental mice at the gate level, indicating that FE can improve antibiotic-induced diarrhoea and GM disorder, and achieve the role of regulating GM and improving diarrhoea. By α diversity analysis, t test and Wilcoxon rank sum test, the diversity and species uniformity of group B were significantly lower than those of groups C and D. Shannon index analysis showed that species richness in group D was higher than that in other groups. The results reflected that FE can promote the growth of beneficial bacteria and inhibit the growth of harmful bacteria such as Bacteroides and Shigella. The results of high-throughput sequencing showed that FE can significantly improve the richness, diversity and uniformity of GM in antibiotic-induced diarrhoea mice. Our data are consistent with the results of reported studies, which have remarkable significance in preventing and even treating diseases(Reference Zhang, Li and Xu28). In conclusion, FE can improve the overall health status by increasing the number of beneficial bacteria and improving GM, particularly those aspects related to the improvement and treatment of diarrhoea and intestinal diseases.
The brain–intestinal–microbial axis is a two-way ‘communication system’ which provides conditions for the interaction between gut microbes and brain, as well as brain and gut microbes. In addition, related studies have also shown that mental stress can activate the neural activity of the relevant parts of the central nervous system and, at the same time, pass signals through the brain–gut axis, change the gastrointestinal motility, activate intestinal mucosal immunity and destroy the intestinal mucosal barrier function(Reference Kowalski and Mulak66). From the experimental data, we can see that peanut powder fermented by natto bacteria can improve the GM of the experimental mice, promote the growth of beneficial bacteria and increase the richness and diversity of GM. MWM testing results showed that the average latency of FE mice was significantly shorter, with the significant increase of the number for cross-platforms, and the time of target quadrant exploration was higher than that of normal mice. It can be seen that the improvement of GM can promote the growth and development of mice and the improvement of cognitive ability, while a certain relationship exists between the two factors. Our study supports the growing scientific evidence that probiotic supplementation may have health and welfare benefits for the host(Reference Mazkour, Shekarforoush and Basiri67). Although the mechanism of the two factors still needs to be further explored, the experimental data may provide justification for future studies in the brain–intestinal–microbial axis and human clinical trials.
Conclusion
Due to amino acid imbalance and protein denaturation of PM, the efficient way to improve its utilisation rate remains challenging. In the present study, the fermentation of PM with B. natto was demonstrated to be beneficial to the improvement of growth performance, learning and memory ability in mice. It was also found that the fermented product can improve the function of GM imbalance and promote the growth of beneficial bacteria. Moreover, it can also inhibit the growth of harmful bacteria such as Bacteroides and Shigella and significantly improve the richness, diversity and uniformity of the GM. Our research provides a theoretical basis for further in-depth research on the theory of brain–gut axis and reflects a possible way to facilitate deep utilisation of PM.
Acknowledgements
The authors wish to thank Dr Tingting Zhang from the Biology Experimental Teaching Center of College of Life Sciences in Qingdao University for the use of some instruments and assistance with the measurements.
This work was financially supported by the Shandong Provincial Science and Technology Development Project (2014GSF120011) and Shandong Provincial Natural Science Foundation (ZR2019PH020).
Conception and design of the study: Y. H. and Z. L.; experiments: X. J., H. D. and Q. L.; collection of data: X. J., H. D. and Y. L.; analysis and interpretation of data: H. D., Q. L., Y. Z. and Y. W.; drafting of the manuscript: X. J. and H. D. and critical revision of the manuscript for important intellectual content: Y. W., A. M., Z. L. and Y. H.
The authors declare that there are no conflicts of interest.


