

Dietary Na intake and blood pressure levels have a well-established causal relationship. Several studies have demonstrated that a high-Na diet causes an increase in both blood pressure values and the rate of hypertension( Reference He and Whelton 1 – Reference Elliott 3 ). This is particularly noteworthy as evidence has shown that increased blood pressure is associated with increases in CVD mortality. In the general population, an increase of 20 mmHg in systolic blood pressure has been associated with a twofold increase of death rates from cardiovascular causes( Reference Lewington, Clarke and Qizilbash 4 ). In this context, the Institute of Medicine has tried many efforts to find the proper dose of Na intake to decrease cardiovascular events. However, the evidence is still insufficient and inconsistent( 5 ).
In favour of the ‘sodium hypothesis’, two important meta-analyses have demonstrated the association between Na intake and total CVD events. One of them, the meta-analysis of prospective studies, reported a 23 % higher risk of stroke and a positive trend in the combined end point of myocardial infarction, stroke, revascularization or death due to cardiovascular cause( Reference Strazzullo, D’Elia and Kandala 6 ). The other, which included randomized clinical trials, found a 20 % reduction in total cardiovascular events in the low-Na intake group( Reference He and MacGregor 7 ).
Despite this evidence, the relationship between Na intake and mortality is still controversial. Since randomized clinical trials have failed to demonstrate a reduction in mortality rate probably due to insufficient power (small number of events), several analyses were made of cohort studies, achieving different conclusions( 5 , Reference Morrison and Ness 8 , Reference Alderman and Cohen 9 ). The last published systematic review performed a meta-analysis and found that higher Na intake was significantly associated with higher risk of stroke and CHD mortality( Reference Aburto, Ziolkovska and Hooper 10 ). However, the association with total CVD mortality or total mortality was not significant. The lack of power to detect a significant difference was probably related to the fact that some important cohort studies were not included( Reference Tunstall-Pedoe, Woodward and Tavendale 11 – Reference Nakamura, Ueshima and Okamura 15 ).
In addition, the heterogeneity shown in observational studies (different populations, quality and handling of variables) have led to methodological limitations that could have also hindered the pooling of results.
With the intention to reduce the clinical heterogeneity, we performed a systematic review and meta-analysis to assess Na intake in the general population and in relation to CVD mortality rather than total mortality, since total mortality is less strongly associated with Na intake.
Methods
Data sources, search strategy and eligibility criteria
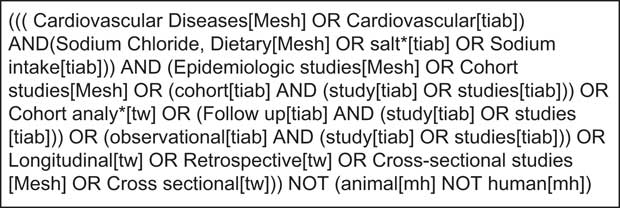
We searched the literature for recent systematic reviews of randomized controlled trials or cohort studies on the effect of lower Na intake relative to higher Na intake. We performed a systematic search of the literature using MEDLINE (February 2013), Embase (January 2013), the Cochrane Library (January 2013), ISI Web of Science (February 2013) and Google Scholar (February 2013). The literature search was stopped in September 2013. The main keywords used to identify the appropriate studies were: ‘salt’, ‘sodium intake’, ‘observational’, ‘cardiovascular’ and ‘follow up’. The MeSH (Medical Subject Heading) terms used were: ‘Cardiovascular Disease’, ‘Sodium Chloride, Dietary’, ‘Epidemiologic studies’, ‘Cohort studies’ and ‘Cross-sectional studies’. The search strategy was performed according to specified criteria (Fig. 1) with no language restrictions. We also searched references from reviews and key publications on the topic.
Search strategy
Study selection
Titles and papers were independently reviewed by two authors (R.P. and M.G.M.). Discrepancies were adjudicated by A.R. The first selection was performed according to the title and abstract contents. We then reviewed the full texts of the publications and selected those that met the following inclusion criteria: (i) prospective population studies and (ii) studies assessing the relationship between daily Na intake and mortality. Studies were excluded when: (i) populations were selected by a particular cardiovascular risk factor or CVD, thus not representing the average risk of the general population; (ii) the outcome was not reported by levels of Na intake, (iii) there were no CVD mortality data reported; and (iv) different publications analysed the same population.
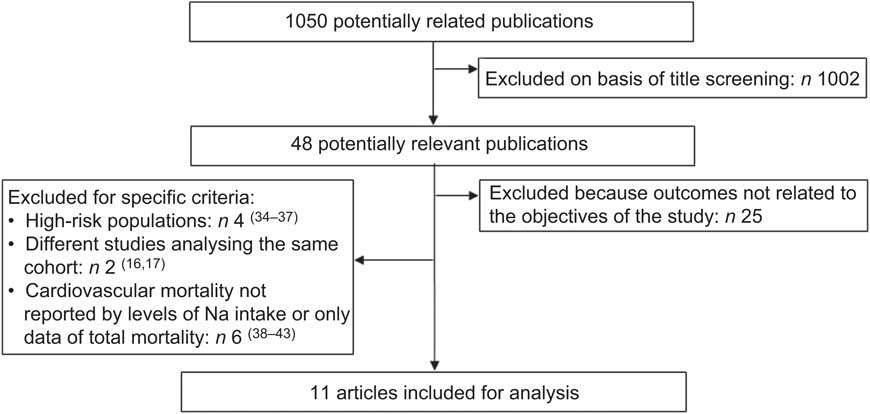
The selection process can be seen in Fig. 2. In short, out of 1050 publications extracted, only eleven studies met the inclusion criteria for the present analysis (see Tables 1 and 2). Of the forty-eight potentially relevant publications, twenty-five were excluded because they analysed the Na intake with outcomes not related to the objectives of the study. Another four studies focused on high-risk people with diabetes, hypertension or CVD. Six studies did not report CVD mortality data or their relative risks (RR) were not reported by levels of Na intake. Finally, two studies were excluded because they analysed the same population. Because we considered the most recent follow-up data for the analysis, the published studies of Alderman et al.( Reference Alderman, Cohen and Madhavan 16 ) and Cohen et al.( Reference Cohen, Hailpern and Alderman 17 ) were substituted by the ones of He et al.( Reference He, Ogden and Vupputuri 18 ) and Yang et al.( Reference Yang, Liu and Kuklina 13 ), respectively.
Flowchart showing selection of studies for the present review and meta-analysis
Methods and results of studies included in the present review and meta-analysis assessing daily sodium intake and CVD mortality
M, males; F, females.
* Difference in Na intake in mmol/d between categories (highest v. reference).
† mmol per unit of increase.
‡ Approximate difference. The precise difference between quartiles was not reported.
Characteristics of the prospective studies included in the present review and meta-analysis assessing daily sodium intake and CVD mortality
M, males; F, females; SBP, systolic blood pressure.
Data extraction
For the analysis, we used the RR reported by the authors for any CVD death (total CVD mortality, stroke or CHD mortality) adjusted for the most number of covariates (to reduce bias). RR were reported very differently depending on the way in which Na intake was treated as a variable (continuous, categorical or as the ratio of Na intake divided by total energy). One study reported the adjusted RR of each tertile compared with the overall risk of the whole study population( Reference Stolarz-Skrzypek, Kuznetsova and Thijs 19 ). Another study reported the RR of Na intake using the Healthy reduced-sodium Japanese diet score from 0 to 7, with 0 for the highest Na consumption and 7 the lowest. The authors divided scores in tertiles and used the low Na intake category (score ≥4) as reference( Reference Nakamura, Ueshima and Okamura 15 ). Two studies reported differences in the event rate for a unit of increase in Na intake( Reference Geleijnse, Witteman and Stijnen 20 , Reference Tuomilehto, Jousilahti and Rastenyte 21 ). The rest of the studies reported the RR by categories of Na intake considering the lowest category as a reference with the exception of two studies that considered the highest. In these cases, we recalculated the RR for the lowest category as reference( Reference Cohen, Hailpern and Fang 12 , Reference Nakamura, Ueshima and Okamura 15 ).
For the pooled result, in order to standardize our comparison, we used the RR in which Na intake was treated as categorical variable. When available, we included the RR adjusted by total energy because the total energy intake is correlated with Na intake and may act as a confounder that may not be possible to control in multivariable analysis( Reference Willett, Howe and Kushi 22 , Reference Willett and Stampfer 23 ). Two studies reported the RR of CVD mortality as a continuous variable and there was no other RR reported( Reference Geleijnse, Witteman and Stijnen 20 , Reference Tuomilehto, Jousilahti and Rastenyte 21 ). We were unable to categorize the study participants by level of Na intake; therefore we included the RR reported by the authors for a unit of increase in Na intake. We also extracted the following data: year of publication of each study, sample size, country, sex and age, follow-up (years), rate of hypertension, number of events, method of assessment and the net difference in Na intake.
Quality control was performed with the Downs and Black score system for assessing quality and susceptibility to bias in observational studies( Reference Downs and Black 24 ). Each author scored the studies and the final score was performed according to a full consensus. Reporting of the different sections followed the MOOSE (Meta-analysis of Observational Studies in Epidemiology) statement for meta-analysis of observational studies( Reference Stroup, Berlin and Morton 25 ).
Statistical analysis
We used the adjusted RR or hazard ratios and their standard errors obtained from the respective confidence intervals, and transformed them into their natural logarithms with the intention to normalize their distribution. The pooled RR and the 95 % CI were estimated with a random-effect model, weighting by inverse variance. We considered results to be statistically significant at α=0·05. We assessed the likelihood of publication bias using funnel plots and Begg (rank correlation method) and Egger tests (linear regression).
We assessed heterogeneity through the ‘I squared statistic’ (I 2), which quantifies the percentage of variation attributable to heterogeneity, reported as a measure of consistency across the studies. An I 2 statistic of 75 % or greater was considered an important level of inconsistency( Reference Higgins, Thompson and Deeks 26 ). We attempted to explain the heterogeneity by conducting sensitivity, subgroup and meta-regression analyses. The sensitivity analysis was conducted by omitting one study at a time in order to determine the degree of influence of each one on the pooled result. For the meta-regression and subgroup analysis, we investigated the association between the outcome and the individual subgroup characteristics.
All statistical analyses were conducted with the statistical software package Stata version 11. The meta-regression was conducted through the inverse variance weighted method using the ‘meta-command’.
Results
Study population
Eleven studies met the inclusion criteria( Reference Tunstall-Pedoe, Woodward and Tavendale 11 – Reference Nakamura, Ueshima and Okamura 15 , Reference He, Ogden and Vupputuri 18 – Reference Tuomilehto, Jousilahti and Rastenyte 21 , Reference Umesawa, Iso and Date 27 , Reference Nagata, Takatsuka and Shimizu 28 ). The final population consisted of 229 785 participants from six different countries: four studies from Japan( Reference Ikehara, Iso and Date 14 , Reference Nakamura, Ueshima and Okamura 15 , Reference Umesawa, Iso and Date 27 , Reference Nagata, Takatsuka and Shimizu 28 ), three from the USA( Reference Cohen, Hailpern and Fang 12 , Reference Yang, Liu and Kuklina 13 , Reference He, Ogden and Vupputuri 18 ) and one each from Belgium( Reference Stolarz-Skrzypek, Kuznetsova and Thijs 19 ), Scotland( Reference Tunstall-Pedoe, Woodward and Tavendale 11 ), the Netherlands( Reference Geleijnse, Witteman and Stijnen 20 ) and Finland( Reference Tuomilehto, Jousilahti and Rastenyte 21 ). The mean follow-up period was 13·37 years (range 5·5–19 years), with 9346 cardiovascular deaths.
Regarding quality control, scores ranged from 15 to 19 and only three studies scored 17 or lower( Reference Tunstall-Pedoe, Woodward and Tavendale 11 , Reference He, Ogden and Vupputuri 18 , Reference Geleijnse, Witteman and Stijnen 20 ).
Na intake and CVD mortality risk
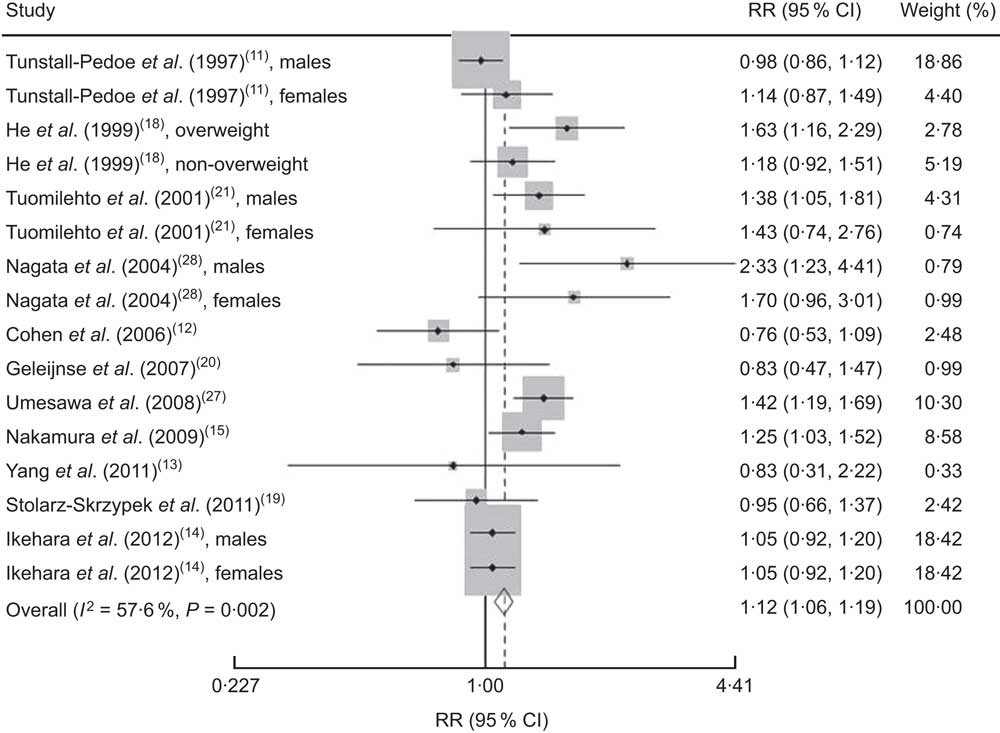
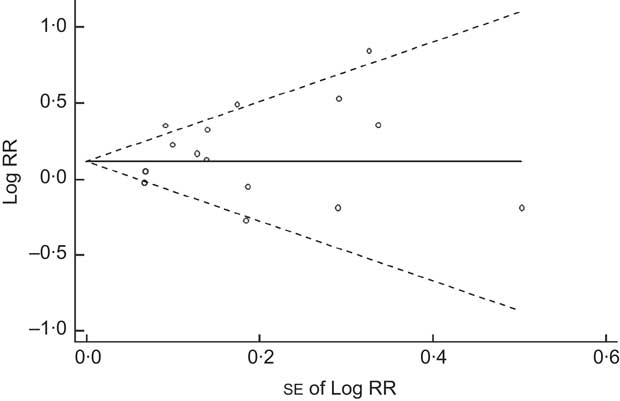
We found that higher Na intake was significantly associated with higher CVD mortality (RR=1·12; 95 % CI 1·06, 1·19; Fig. 3). The I 2 test suggested a moderate level of heterogeneity among the studies (57·6 %; P=0·002). Six studies showed a direct association( Reference Ikehara, Iso and Date 14 , Reference Nakamura, Ueshima and Okamura 15 , Reference He, Ogden and Vupputuri 18 , Reference Tuomilehto, Jousilahti and Rastenyte 21 , Reference Umesawa, Iso and Date 27 , Reference Nagata, Takatsuka and Shimizu 28 ), three studies showed an inverse association( Reference Cohen, Hailpern and Fang 12 , Reference Yang, Liu and Kuklina 13 , Reference Geleijnse, Witteman and Stijnen 20 ) and two studies showed no association( Reference Tunstall-Pedoe, Woodward and Tavendale 11 , Reference Stolarz-Skrzypek, Kuznetsova and Thijs 19 ). The funnel plot showed no publication bias (Begg’s test P=0·32 and Egger’s test P=0·25; Fig. 4).
Risk of CVD mortality associated with higher compared with lower sodium intake in eleven published prospective studies. Shown are authors, year and reference, relative risk (RR) and 95 % confidence interval, and the weight to the overall meta-analysis. The study-specific RR and 95 % CI are represented by the black diamond and horizontal line, respectively; the area of the grey square is proportional to the specific-study weight to the overall meta-analysis. The centre of the open diamond presents the pooled RR risk and its width represents the pooled 95 % CI. The percentage of heterogeneity due to between-study variation is shown by the I 2 statistic
Begg’s funnel plot for prospective studies of sodium intake and CVD mortality. Studies are plotted with their relative risk (RR; logarithmic scale) on the y-axis and the corresponding standard error on the x-axis; pseudo 95 % confidence limits are represented by dashed lines
In the sensitivity analyses (Fig. 5), higher Na intake was always significantly associated with higher CVD mortality. Also when excluding the studies by Umesawa et al.( Reference Umesawa, Iso and Date 27 ) and Nakamura et al.( Reference Nakamura, Ueshima and Okamura 15 ) (strong positive association and relative weight) the pooled RR remained significant (1·08; 95 % CI 1·01, 1·15) and the I 2 decreased to 49·5 %. With the exclusion of the two studies that treated the Na intake as a continuous variable( Reference Geleijnse, Witteman and Stijnen 20 , Reference Tuomilehto, Jousilahti and Rastenyte 21 ), the RR was 1·10 (95 % CI 1·05, 1·18). Finally, when we excluded the two studies that reported only a specific cause of mortality (CHD( Reference Tunstall-Pedoe, Woodward and Tavendale 11 ) and stroke( Reference Nagata, Takatsuka and Shimizu 28 )) the association was stronger (RR=1·14; 95 % CI 1·07, 1·21).
Forest plot for risk of CVD mortality associated with sodium intake in eleven published prospective studies: (a) sensitivity analysis and (b) subgroup analysis. The relative risk (RR) and 95 % CI are represented by the black square and horizontal line, respectively

Potential sources of heterogeneity
Meta-regression
Na intake
The net difference in Na intake reported (highest v. lowest consumption) was heterogeneous among studies. Most studies showed a net difference in Na intake between 70 and 110 mmol/d (1·680 and 2·640 mg Na/d, respectively). Two studies reported a net difference outside the previously mentioned range( Reference Ikehara, Iso and Date 14 , Reference Stolarz-Skrzypek, Kuznetsova and Thijs 19 ). One study did not report specific data( Reference Nakamura, Ueshima and Okamura 15 ). The meta-regression analysis showed that for every 10 mmol/d increase in Na intake the CVD mortality increased by 1 % (exp (b)=1·0096; 95 % CI 1·0002, 1·0017; P=0·016).
Duration of follow-up
The meta-regression analysis showed a mild and positive association between the duration of follow-up and CVD mortality. For every year of increase in the follow-up period, the CVD mortality increased by 0·7 % (exp (b)=1·007; 95 % CI 1·003, 1·011; P=0·000).
Age
Ten studies reported data regarding the age of the population( Reference Tunstall-Pedoe, Woodward and Tavendale 11 , Reference Cohen, Hailpern and Fang 12 , Reference Ikehara, Iso and Date 14 , Reference Nakamura, Ueshima and Okamura 15 , Reference He, Ogden and Vupputuri 18 – Reference Tuomilehto, Jousilahti and Rastenyte 21 , Reference Umesawa, Iso and Date 27 , Reference Nagata, Takatsuka and Shimizu 28 ). With the exception of one study( Reference Geleijnse, Witteman and Stijnen 20 ) the mean age of the populations was very similar, ranging between 21 and 57·4 years. Meta-regression showed that for every 10 years of increase in mean age, the CVD mortality increased significantly by 2·1 % (exp (b) =1·021; 95 % CI 1·011, 1·031; P=0·000).
Rate of hypertension
Nine studies reported the rate of hypertension in the population( Reference Cohen, Hailpern and Fang 12 – Reference Nakamura, Ueshima and Okamura 15 , Reference He, Ogden and Vupputuri 18 – Reference Geleijnse, Witteman and Stijnen 20 , Reference Umesawa, Iso and Date 27 , Reference Nagata, Takatsuka and Shimizu 28 ). The rate of hypertensive subjects ranged between 14·0 % and 22·2 % except for three studies in which it ranged between 30 % and 38 %. For every increase of 10 % in hypertension rate, the CVD mortality increased by 4·2 % (exp (b) =1·042; 95 % CI 1·016, 1·069; P=0·002).
Subgroup analysis
Method of Na assessment
The Na intake assessment varied among studies. Three studies used a 24 h dietary recall( Reference Cohen, Hailpern and Fang 12 , Reference Yang, Liu and Kuklina 13 , Reference He, Ogden and Vupputuri 18 ), four studies used an FFQ( Reference Ikehara, Iso and Date 14 , Reference Nakamura, Ueshima and Okamura 15 , Reference Umesawa, Iso and Date 27 , Reference Nagata, Takatsuka and Shimizu 28 ) and four used 24 h urinary Na excretion( Reference Tunstall-Pedoe, Woodward and Tavendale 11 , Reference Stolarz-Skrzypek, Kuznetsova and Thijs 19 , Reference Geleijnse, Witteman and Stijnen 20 , Reference Tuomilehto, Jousilahti and Rastenyte 21 ). The pooled estimation for CVD mortality assessed by urinary Na excretion was a RR=1·05 (95 % CI 0·95, 1·16). When assessed by 24 h dietary recall, the RR was 1·15 (95 % CI 0·97, 1·37); and for FFQ the RR was 1·16 (95 % CI 1·07, 1·25). There were no data regarding the result of the urine collection process (number of samples dropped or total volume obtained). In all cases, the Na intake assessment was performed only at the baseline measurements.
Adjustment for energy intake
Six studies made adjustments of Na intake by total energy( Reference Cohen, Hailpern and Fang 12 , Reference Yang, Liu and Kuklina 13 , Reference He, Ogden and Vupputuri 18 , Reference Geleijnse, Witteman and Stijnen 20 , Reference Umesawa, Iso and Date 27 , Reference Nagata, Takatsuka and Shimizu 28 ) (see Table 2). The RR of CVD mortality in the studies that adjusted the Na intake was 1·22 (95 % CI 1·08, 1·38). In the studies that did not perform the adjustment, the RR was 1·10 (95 % CI 1·03, 1·17).
Adjustment for systolic blood pressure or hypertension status
Some studies adjusted for hypertension status( Reference Ikehara, Iso and Date 14 , Reference Nakamura, Ueshima and Okamura 15 , Reference Umesawa, Iso and Date 27 , Reference Nagata, Takatsuka and Shimizu 28 ), others for systolic blood pressure( Reference Tuomilehto, Jousilahti and Rastenyte 12 , Reference He, Ogden and Vupputuri 18 , Reference Stolarz-Skrzypek, Kuznetsova and Thijs 19 , Reference Tuomilehto, Jousilahti and Rastenyte 21 ) and a few of them for prescription of antihypertensive drugs( Reference Cohen, Hailpern and Fang 12 , Reference Stolarz-Skrzypek, Kuznetsova and Thijs 19 ). Only three studies did not make any adjustment for these variables( Reference Tunstall-Pedoe, Woodward and Tavendale 11 , Reference Yang, Liu and Kuklina 13 , Reference Geleijnse, Witteman and Stijnen 20 ). The RR of CVD mortality in the studies that adjusted for hypertension status was 1·13 (95 % CI 1·06, 1·19). In the studies that did not perform the adjustment, the RR was 0·99 (95 % CI 0·89, 1·12).
Gender
Five studies reported CVD mortality for men and women separately( Reference Tunstall-Pedoe, Woodward and Tavendale 11 , Reference Ikehara, Iso and Date 14 , Reference Stolarz-Skrzypek, Kuznetsova and Thijs 19 , Reference Tuomilehto, Jousilahti and Rastenyte 21 , Reference Nagata, Takatsuka and Shimizu 28 ). The pooled estimation for men was RR=1·11 (95 % CI 1·02, 1·20) and for women RR=1·15 (95 % CI 1·03, 1·27).
Age
The pooled estimation reported for CVD mortality in those populations under 50 years old( Reference Tunstall-Pedoe, Woodward and Tavendale 11 – Reference Ikehara, Iso and Date 14 , Reference Stolarz-Skrzypek, Kuznetsova and Thijs 19 , Reference Tuomilehto, Jousilahti and Rastenyte 21 ) was RR=1·08 (95 % CI 0·99, 1·17) and for those aged 50 years or more( Reference Ikehara, Iso and Date 14 , Reference He, Ogden and Vupputuri 18 , Reference Geleijnse, Witteman and Stijnen 20 , Reference Umesawa, Iso and Date 27 , Reference Nagata, Takatsuka and Shimizu 28 ), RR=1·16 (95 % CI 1·07, 1·25).
Nationality
The only available comparison in the study population is between the USA and Japan. Because all studies conducted in the USA used 24 h dietary recall and all studies conducted in Japan used FFQ, this comparison result is identical to the method of Na intake assessment.
Discussion
We found that higher Na intake was significantly associated with higher CVD mortality. Although the I 2 statistic suggested some level of heterogeneity among studies, we did not find publication bias and the results were demonstrated to be robust in the sensitivity and subgroup analyses (Fig. 5).
Our study showed that one of the most important sources of heterogeneity was related to assessment of the exposure variable. Contrary to expectations and in accordance with a previous meta-analysis( Reference Strazzullo, D’Elia and Kandala 6 ), the studies that assessed Na consumption by 24 h urine collection were unable to find any significant association with CVD mortality. There are no data published in relation to the urine collection process in the studies included in our analysis. Possible reasons for this finding could be: (i) although the 24 h urine collection is the most objective indicator of Na intake, several factors can affect its validity (30 % within-person variability)( Reference Bentley 29 ) and (ii) this method mostly reflects the Na intake over the last 24 h. Taking into consideration the usual day-to-day variation, this method may not provide a reliable estimation of the actual average Na consumption over longer periods of time( Reference Flegal, Keyl and Nieto 30 ).
On the other hand, the studies that assessed Na intake by FFQ found a significant association with CVD mortality (RR=1·16; 95 % CI 1·07, 1·25). Although the assessment of Na intake by FFQ is not as accurate as that by 24 h urine collection, it may better reflect the average Na consumption since the exposure is assessed over a wider time frame (usually 6 months to 1 year)( Reference Cade, Thompson and Burley 31 ).
With regard to energy adjustment, epidemiological studies demonstrate that total energy intake is often related to CVD risk but also to physical activity and body size. Differences in disease incidence may also be related to metabolic efficiency and therefore to total energy intake( Reference Willett, Howe and Kushi 22 ). Because intakes of most specific nutrients are correlated with total energy intake, they may be non-causally associated with disease as a result of confounding by total energy intake. Therefore, several reports highlight the importance to adjust in epidemiological studies for the confounding effect of total energy intake to avoid falling into misinterpretation( Reference Willett and Stampfer 23 ). As known, total energy intake is also highly correlated with Na intake (correlation coefficient greater than 0·70 in most age groups); thus it is always advisable to adjust the Na intake for the total energy consumed( Reference Cohen, Hailpern and Fang 12 , 32 ).
In our analysis, when Na intake was adjusted by total energy intake, the association became stronger. A good example is seen in the study of Alderman et al. because they found contradictory results when adjusting the Na intake by total energy: the RR for CVD mortality changed from 0·89 before to 1·13 after adjustment( Reference Alderman, Cohen and Madhavan 16 ).
To our knowledge, the present study is the first meta-analysis to assess the association of Na intake and CVD mortality focusing only on the general population. Strazzullo et al. performed a meta-analysis with prospective studies but did not analyse CVD mortality as a separate end point( Reference Strazzullo, D’Elia and Kandala 6 ). Morrison and Ness found that Na reduction decreased CVD risk in the general population but did not perform a meta-analysis( Reference Morrison and Ness 8 ). A recent systematic review challenged the widespread indication to reduce Na intake, reporting a ‘J-shaped’ relationship between Na intake and CVD events( Reference Alderman and Cohen 9 ). However: (i) this finding was only seen in two populations with higher cardiovascular risk (individuals with diabetes, hypertension or previous cardiovascular events); (ii) the authors analysed the Na intake in relation to a composite cardiovascular end point which encompassed all-cause mortality; and (iii) as mentioned above, several studies in that review included special populations with higher CVD mortality risk. We did not find a ‘J-shaped’ relationship between Na intake and CVD mortality in the general population. Compared with the general population, individuals with high CVD risk are likely consume less Na as a result of their condition. In this regard, low Na intake could be, in some cases, just a marker of severity of the disease and not a cause of higher CVD mortality, thus making this association spurious (reverse causality).
A recently published meta-analysis of randomized controlled trials and cohort studies analysed this association( Reference Aburto, Ziolkovska and Hooper 10 ). It concluded that randomized controlled trials had insufficient power to assess the effects of reduced Na intake on mortality when analysed as an isolated outcome. In relation to cohort studies, those authors found that increased Na intake was associated with an increased risk of stroke mortality (RR=1·63; 95 % CI 1·27, 2·10) and CHD mortality (RR=1·32; 95 % CI 1·13, 1·53) but they were unable to detect a significant reduction in CVD and total mortality (RR=1·08; 95 % CI 0·87, 1·33). The lack of power to detect a significant difference in mortality is probably related to the exclusion of several important cohort studies with available data for analysis( Reference Tunstall-Pedoe, Woodward and Tavendale 11 – Reference Nakamura, Ueshima and Okamura 15 ).
Compared with other systematic reviews and meta-analyses, our study has the following strengths: (i) we reduced the clinical heterogeneity among studies by excluding populations selected by a particular condition such as diabetes, hypertension or a previous cardiovascular event( Reference Strazzullo, D’Elia and Kandala 6 , Reference Aburto, Ziolkovska and Hooper 10 ). In effect, the characteristics of our population were very similar those of the general population in relation to age, gender and prevalence of hypertension. Moreover, with the exception of one study( Reference Cohen, Hailpern and Fang 12 ), the confidence intervals overlapped, showing that the variation found among the results could be due to chance; (ii) with the exclusion of high-risk populations, we also reduced a potential reverse causality in the results; and (iii) we included all data available regarding CVD mortality.
Yet, some limitations in our study should be highlighted: (i) Na intake was categorized very differently across studies. The studies by Geleijnse et al.( Reference Geleijnse, Witteman and Stijnen 20 ) and Tuomilehto et al. ( Reference Tuomilehto, Jousilahti and Rastenyte 21 ) did not categorize Na intake and we were not able to categorize the variable due to insufficient data. However, the RR of the outcome represents a difference in Na intake of 70 and 100 mmol/d, respectively, both of which are very similar to the differences reported in other studies. (ii) We were not able to correct the average estimation for regression dilution bias because only a single measurement of Na intake was reported. Due to this limitation, the CVD mortality may have been underestimated( Reference Cook 33 ). (iii) The adjustment for confounders was not homogeneous across all studies (see Table 2). In five studies, Na intakes were not adjusted for total energy intake and in most studies they were adjusted for systolic blood pressure (mediator variable). A well-known principle of epidemiology is to avoid controlling for factors in the causal pathway because the mediator variable (blood pressure) can alter the association between Na and CVD. (iv) Finally, the variability of the assessment of the exposure variable (different instruments used), as well as different lengths of follow-up, sample size and number of events, were partially overcome with subgroup and meta-regression analyses.
The methodological heterogeneity among reports, especially in relation to the exposure variable (method of assessment and variable handling), has been the major obstacle to summarizing the evidence.
Further consensus is needed to standardize data reporting by harmonizing: (i) the method of assessment of Na intake; (ii) the cut-off point of Na intake categories; (iii) the adjustment of Na intake for total energy in all cases; and (iv) the correction for regression dilution bias.
Conclusion
We have been able to partially overcome the clinical heterogeneity and find that higher Na intake is associated with higher total CVD mortality in the general population. Our study result suggests a reduction in Na intake to prevent CVD mortality from any cause. Harmonization efforts should be made in future observational studies to reduce the sources of heterogeneity and to make data more comparable for evidence synthesis.
Acknowledgements
Financial support: This research received no specific grant from any funding agency in the public, commercial or not-for-profit sectors. Conflict of interest: None. Authorship: All authors contributed significantly to the manuscript. R.P. conceived the study aims and design and contributed to the systematic review and data extraction. A.R. contributed to the interpretation of results. L.G. performed the analysis and interpreted the results. R.P., M.G.M. and A.R. drafted the manuscript. V.I. and N.E. contributed to the data extraction, interpretation of results and revision of the manuscript. R.P. is guarantor. Ethics of human subject participation: Ethical approval was not required.


