


Introduction
Radiolarian faunas have been reported from Ordovician strata globally from North America, Spitsbergen, Scotland, Russia, and China (see Danelian et al., Reference Danelian, Aitchison, Noble, Caridroit, Suzuki, O'Dogherty, Danelian, Caridroit, Noble and Aitchison2017 and references therein). However, the biostratigraphic potential of this fossil group remains underdeveloped. Many gaps in knowledge and understanding of phylogenetic relationships exist due to the lack of precise taxonomic descriptions of many taxa (Noble et al., Reference Noble, Aitchison, Danelian, Dumitria, Maletz, Suzuki, Cuvelier, Caridroit, O'Dogherty, Danelian, Caridroit, Noble and Aitchison2017). This is largely a result of difficulties experienced in examining details of internal structures, many of which are obscured by diagenesis and/or poor preservation. Moreover, the stratigraphic and paleogeographic ranges of many important morphological groups are poorly constrained because they are largely only reported from isolated occurrences commonly with uncertain stratigraphic assignment (Aitchison et al., Reference Aitchison, Suzuki, Caridroit, Danelian and Noble2017).
Western Newfoundland was chosen for this study because earlier investigations in lower Paleozoic rocks in this area have yielded numerous well-preserved radiolarian faunas from upper Cambrian to Lower Ordovician strata (Bergström, Reference Bergström1979; Aitchison et al., Reference Aitchison, Flood and Malpas1998; Zhang and Pratt, Reference Zhang and Pratt2000; Won and Iams, Reference Won and Iams2002, Reference Won and Iams2011, Reference Won and Iams2013, Reference Won and Iams2015; Won et al., Reference Won, Iams and Reed2005; Maletz, Reference Maletz2007; Maletz and Bruton, Reference Maletz and Bruton2007; Pouille et al., Reference Pouille, Danelian, Pour and Popov2013). Previous work in the Middle Ordovician Table Head Formation also indicated the presence of radiolarians (Renz, Reference Renz1990; Bergström, Reference Bergström1979; Zhang and Pratt, Reference Zhang and Pratt2000; Maletz and Bruton, Reference Maletz and Bruton2007) at Piccadilly Quarry, a well-known fossil locality. Thirty-nine species, eight of which are described herein, were recognized in our investigation.
The remarkable preservation of the fauna provided us with the opportunity to examine this entirely new assemblage with the aid of μ-CT. All of the thirteen samples collected yielded useful radiolarians. However, the interiors of many of the spherical forms were commonly in-filled with calcite and pyrite and/or the delicate internal structures were missing. Therefore, an initial detailed investigation with the scanning electron microscope (SEM) and transmitted light microscope (TLM) was undertaken in order to identify and select the most promising specimens for μ-CT imaging.
Stratigraphic setting
Sedimentary sequences of western Newfoundland accumulated on a carbonate platform situated on a passive continental margin of an early Paleozoic microplate. It now incorporates the most north-east margin of the Appalachian Mountains that run through the North American continent. The Table Head Group of the Port au Port Peninsula area is well studied (Stenzel et al., Reference Stenzel, Knight and James1990) and incorporates carbonate platform sediments of the Middle Ordovician Table Cove Formation.
Locality information
Thirteen samples were systematically collected from dark gray nodules interstratified in a four-meter-thick section of fossiliferous, peloidal limestone of the Table Cove Formation, at the Piccadilly Quarry (also called West Bay Centre Quarry), Port au Port Peninsula, western Newfoundland (Fig. 1; 48°35′29.6″N 58°55′13.1″W WGS84). The Table Cove Formation was deposited in a slope-to-basin environment (Zhang and Pratt, Reference Zhang and Pratt2000) and consists primarily of dark gray, thin-bedded argillaceous lime-mudstones interbedded with black calcareous shales (Stenzel et al., Reference Stenzel, Knight and James1990). The limestone has a predominance of pelagic organisms where radiolarians commonly can be observed in abundance with a hand lens.
Locality map showing position of study area (after Cooper et al., Reference Cooper, Weissenberger, Knight, Hostad, Gillespie, Williams and Clark2001). Inset map shows Port au Port Peninsula's location in relation to Newfoundland.

Samples yielded a diverse co-occurring assemblage of hexactinellid sponge spicules, conodonts, and rare lingulate organophosphatic brachiopods. A middle Darriwilian (late Dw2) age was established for the entire section (samples PD01 and PD13) based on the presence of several conodonts. Relevant zonal index species include pectiniform taxa such as Histiodella kristinae Stouge, Reference Stouge1984 and the genus Polonodus (Fig. 2). Histiodella kristinae has its first occurrence in the uppermost Eoplacognathus pseudoplanus Conodont Zone and allows regional correlation with the Histiodella kristinae subzone in western Newfoundland (late Dw2) (Stouge, Reference Stouge1984).
Composite figure of scanning electron micrographs of the diverse assemblages of age-diagnostic conodonts, which were used for determining stratigraphic assignment. Scale bar: 100 μm: (1, 2, 17, 21) Paroistodus horridus (Barnes and Poplavski, Reference Barnes and Poplawski1973) (PD13): (3–5, 11) Protopanderodus cooperi (Sweet and Bergström, Reference Sweet and Bergström1962) (PD13): (6, 8) Drepanodus reclinatus (Lindström, Reference Lindström1955) (PD05, PD10, respectively): (7, 9) Parapanderodus elegans Stouge, Reference Stouge1984 (PD13): (10) Drepanoistodus costatus (Abaimova, Reference Abaimova1971): (12, 13) Panderodus gracilis (Branson and Mehl, Reference Branson and Mehl1933) (PD13): (14–16, 18) Histiodella kristinae Stouge, Reference Stouge1984 (15, 18 PD13; 16 PD05; 17 PD13): (19) Polonodus sp. (PD13): (20, 22) Periodon macrodentatus (Graves and Ellison, Reference Graves and Ellison1941) (PD13).

A middle Darriwilian assignment correlates with the Holmograptus spinosus graptolite biozone tentatively assigned by Maletz and Egenhoff (Reference Maletz and Egenhoff2011) for the Table Cove Formation at this exposure. This is also supported by assignment to the graptolite Nicholsonograptus fasciculatus biozone for the overlying Black Cove Formation (Figs. 3, 4; Morris and Kay, Reference Morris and Kay1966; Finney and Skevington, Reference Finnery and Skevington1979; Williams et al., Reference Williams, Boyace and James1987; Maletz and Egenhoff, Reference Maletz and Egenhoff2011).
Stratigraphic context of the Table Cove Formation at the Piccadilly Quarry: (1) lithostratigraphic log after Maletz and Egenhoff (Reference Maletz and Egenhoff2011) showing the sampled levels (PD01, -03, -05, -07, -09, -11, -12, and -13). Generalized stratigraphy after Knight (Reference Knight1991) and James et al. (Reference James, Botsford and Williams1987); (2) field photo, facing southwest, of the exposure of gently dipping beds of rhythmically bedded limestone.

Ordovician radiolarian zonation, after Aitchison et al. (Reference Aitchison, Suzuki, Caridroit, Danelian and Noble2017). The Histiodella kristinae subzone recognized in Samples PD01–PD13 is highlighted in blue.

Radiolarian biostratigraphy
Although some intervals in the Ordovician have not yet provided useful radiolarian faunas, 12 assemblages are presently recognized (Aitchison et al., Reference Aitchison, Suzuki, Caridroit, Danelian and Noble2017) (Fig. 5). The Ordovician stratigraphy used herein follows North American and western Newfoundland zonal schemes for conodonts and graptolites. Middle Ordovician radiolarian stratigraphy follows the work of Nazarov and Popov (Reference Nazarov and Popov1980), Nazarov (Reference Nazarov1988), Danelian and Popov (Reference Danelian and Popov2003), Jones and Noble (Reference Jones and Noble2006), MacDonald (Reference MacDonald2006), Pouille et al. (Reference Pouille, Danelian, Pour and Popov2013), and Aitchison et al. (Reference Aitchison, Suzuki, Caridroit, Danelian and Noble2017). Key references used in construction of Figure 4, in addition to those mentioned in the text, are Maletz (Reference Maletz2009) and Feltes et al. (Reference Feltes, Albanesi and Bergström2016).
Faunal diversity. List of radiolarian taxa recovered from Piccadilly Quarry samples with the number of specimens indicating relative abundance of different species.

Correlations using graptolite data indicate that the material collected for this study comes from within the interval between the Proventocitum procerulum and Haplentactinia juncta-Inanigutta unica radiolarian assemblages. This is an interval from which well-preserved Middle Ordovician radiolarian assemblages have also been reported from Kazakhstan (Nazarov et al., Reference Nazarov, Popov and Apollonov1975, Reference Nazarov, Popov and Apollonov1977; Nazarov and Popov, Reference Nazarov and Popov1980; Nazarov, Reference Nazarov1988; Nazarov and Ormiston, Reference Nazarov, Ormiston, Blueford and Murchey1993; Danelian and Popov, Reference Danelian and Popov2003; Pouille et al., Reference Pouille, Danelian, Pour and Popov2013, Reference Pouille, Danelian and Popov2014). The Haplentactinia juncta-Inanigutta unica assemblage from the radiolarian-bearing Sample 19, reported by Nazarov and Popov (Reference Nazarov and Popov1980) from the North-Balkhash Region, Kazakhstan is the closest known assemblage in age, faunal composition and lithology. Nazarov and Popov's (Reference Nazarov and Popov1980) material comes from bedded argillaceous limestones situated at the lower part of the Kurchilik Formation (Apollonov et al., Reference Apollonov, Zhemchuzhnikov and Dubinina1990; Dubinina, Reference Dubinina2000). Although they provided a detailed description of the fauna, many taxonomic details require revision.
Materials and methods
All samples were processed with 10% acetic acid for two months to free specimens. Once specimens were isolated from the matrix they were then sieved through a 250 µm sieve and collected at the 63 µm sieve. Residues were hand-picked for initial investigation with both SEM and TLM where relative abundance was calculated either at the species, genus, or family level depending on the difficulty of identification or state of preservation. Specimens were imaged using a Hitachi TM3030 desktop SEM at the Research Laboratory of the School of Earth and Environmental Sciences. A lower accelerating voltage (5 kV) was chosen for the secondary electron beam because uncoated samples were susceptible to charging. Specimens selected for μ-CT imaging were transferred into a labeled micropaleontological slide for storage before sample preparation.
Micro-CT imagery and analysis
Micro-CT images of selected radiolarians were obtained using the Xradia Versa 500 scanner at the University of Queensland Julius Kruttschnitt Mineral Research Centre. Details of the methodology employed are presented in Kachovich et al. (Reference Kachovich, Sheng and Aitchison2019). A multiple specimen mount was used to minimize the opening of the chamber, thus minimizing the effect of thermal flux. Acrylonitrile butadiene styrene (ABS) plastic for 3D printing was selected for specimen mounting because of its low density (1.07 g/cm3) compared to radiolarian skeletons (~2.65 g/cm3). Ultraviolet (UV) curing resin NOA61 (1.231 g/cm3) was selected for its low density and ability to allow enough time for mount preparation and sample transferring.
The specimens were scanned with an X-ray source current of 77 μA and beam voltage of 60 kV for four hours each. High attenuation differences are needed to achieve radiographs with adequate phase contrast. Stacks of 970 images with 0.42 µm resolution were reconstructed for each specimen. The acquired 3D data set was processed with volume reconstruction software built in the Xradia 500 scanner and exported as 32-bits stacks. Data were saved as grayscale TIFF images, which were then imported into Avizo® 9.4 software for 3D visualization and data analysis.
Repository and institutional abbreviations
Specimens examined in this study are deposited in The University of Queensland (UQ), Brisbane, Australia. Other repositories include Muséum national d'Histoire naturelle (MNHN), Lille University of Science and Technology (USTL), and Geological Survey of Canada (GSC).
Systematic paleontology
Phylum Radiozoa Cavalier-Smith, Reference Cavalier-Smith1987
Class Polycystina Ehrenberg, Reference Ehrenberg1838, sensu Riedel, Reference Riedel1967
Order Spumellaria, Ehrenberg, Reference Ehrenberg1875, sensu De Wever et al., Reference De Wever, Dumitrica, Caulet, Nigrini and Caridroit2001
Remarks
Polycystines with radial arrangement of numerous spines with a distinct internal microsphere and without an internal spicular system. Spumellarians described herein are characterized by the presence of a small microsphere with a variable number of outer spheres. All spheres are connected to the microsphere by a variable number of outer spines.
Family Inaniguttidae Nazarov and Ormiston, Reference Nazarov and Ormiston1984, sensu Noble, Reference Noble1994, sensu Danelian and Popov, Reference Danelian and Popov2003
Remarks
Identification to genus level within this family requires observation of the number and sizes of internal spheres in conjunction with an accurate assessment of the number of spines. Several genera are recognized based on the number of spheres, spines, and the presence or absence of a pylome and a microsphere (Noble et al., Reference Noble, Aitchison, Danelian, Dumitria, Maletz, Suzuki, Cuvelier, Caridroit, O'Dogherty, Danelian, Caridroit, Noble and Aitchison2017). These genera include: Inanibigutta, Inanigutta, Inanihella, Oriundogutta, Plussatispila, and Triplococcus (Caridroit et al., Reference Caridroit, Danelian, O'Dogherty, Cuvelier, Aitchison, Pouille, Noble, Dumitrica, Suzuki, Kuwahara, Maletz and Feng2017).
Genus Triplococcus Danelian and Popov, Reference Danelian and Popov2003
Type species
Triplococcus acanthicus Danelian and Popov, Reference Danelian and Popov2003, from siliceous limestone of the Akzhal Formation, southern Betpak-Dala desert, Kazakhstan, by original designation.
Occurrence
Ordovician, upper Dapingian? to upper Darriwilian from Kazakhstan, China, Argentina, and Newfoundland (Danelian and Popov, Reference Danelian and Popov2003; Maletz et al., Reference Maletz, Albanesi and Voldman2009; Pouille et al., Reference Pouille, Danelian, Pour and Popov2013, Reference Pouille, Danelian and Popov2014; herein).
Remarks
Triplococcus can be distinguished from other inaniguttids chiefly by the greater number of closely spaced spheres. Pouille et al. (Reference Pouille, Danelian, Pour and Popov2013, p. 1144–1145) commented that Triplococcus is an inaniguttid “composed of three (possibly four) shells placed around a small microsphere from which originate five to twelve outer spines. The latter emerge from the bars of the microsphere as thin spines, becoming thicker rod-like spines from the median shell (second after the microsphere) onwards. Inner and median shells are rather closely spaced. The microsphere and inner shell's wall structure consists of a thin layer, pierced irregularly, whereas the median and outer shells are regularly perforated. Numerous beams originate either from the surface of the inner shell or from the median shell. Outer spines may bear some apophyses indicating the possible presence of a fourth shell.”
Four specimens assignable to this genus were analyzed using μ-CT. A small “primitive” pylome is commonly developed within each genus. Detailed observation of sphere walls revealed thin, bandage-like layers of silica (the term bandage is applied to refer to flat layers on the sphere wall that is made of perforations, sensu Maletz and Bruton, Reference Maletz and Bruton2007), in contrast to rounded bars typical of many radiolarians. These coalesce into a thin spherical layer with irregular pores that pierce the surface. On complete specimens, the median sphere regularly develops high ridges between pore junctions, forming a hexagonal pattern on top of the primary bandage (Fig. 6.7). Triplococcus therefore can be distinguished easily from most multi-sphered inaniguttids by the thin bandages constructed on the inner spheres rather than a series of interconnected bars with a rounded cross-section. This unusual skeletal development has also been observed in the Lower Ordovician genus Antygopora (Maletz and Bruton, Reference Maletz and Bruton2007). The main difference between the skeletal wall of Antygopora and Triplococcus is that in Antygopora the bandages are very wide (~18 µm) and the small pores (~9 µm) have raised rims.
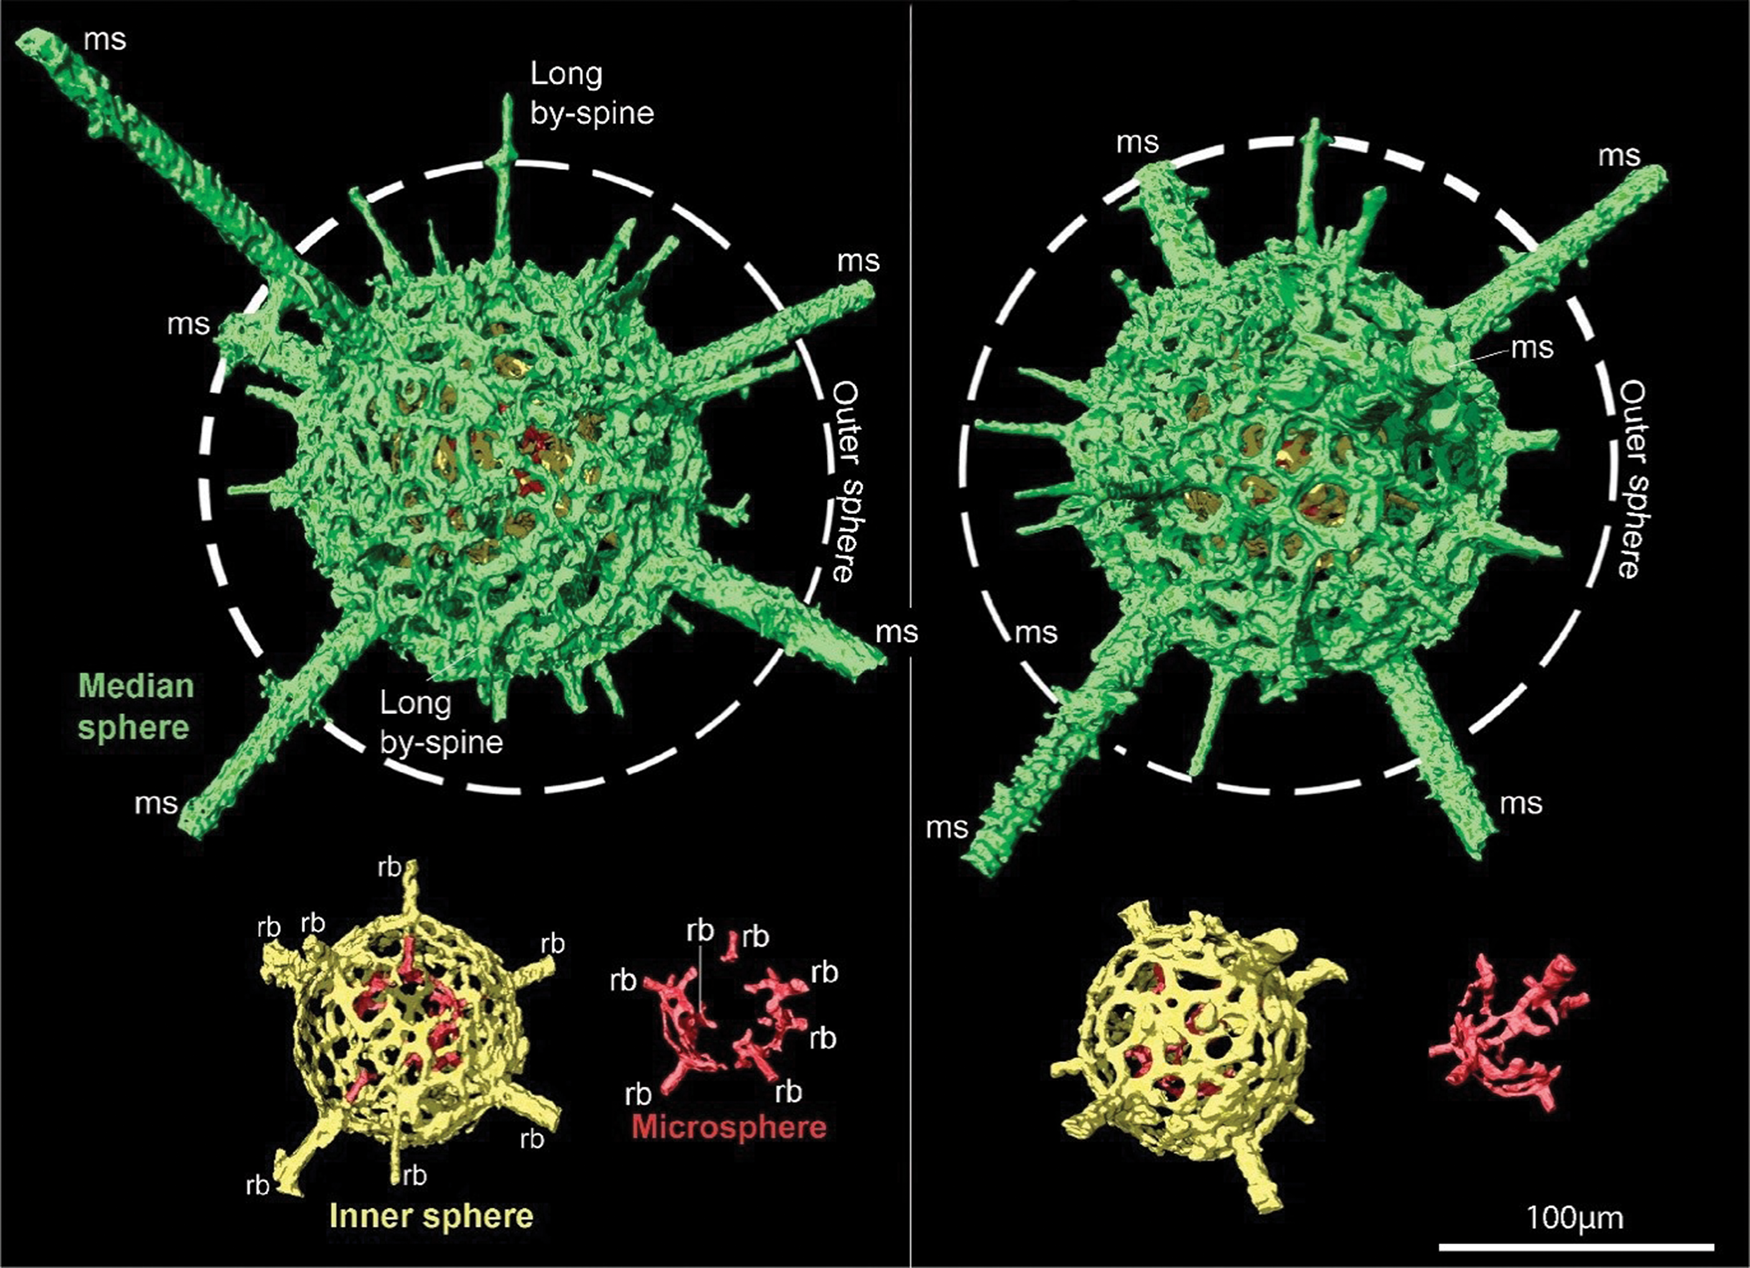
Triplococcus acanthicus Danelian and Popov. A compilation of line drawings and μ-CT models illustrating a heteropolar skeleton of radial symmetry originating from a structurally stable microsphere: (1) three spheres and a microsphere digitally segmented for individual observation. Outer sphere is also sliced in half in order to demonstrate the relationship between spheres and spines. Each segment is shown at the same scale; (2) diagram showing the configuration of spheres, spines, ap, py, and by-spine related to the s-py; (3) detailed diagram showing the true relationship between features; (4) apical view of the apical pore on the inner sphere. Planar extraction of the apical (5) view of the inner sphere and basal (6) view of the median sphere; (7) basal view of the primitive pylome on the median sphere and its relationship with the other spheres and microsphere. Apical pore (ap), plyome (py), by-spine (bs), by-spine related to the pylome (s-py), radial bar (rb), microsphere (ms).

Triplococcus acanthicus Danelian and Popov, Reference Danelian and Popov2003
Figures 6, 7.6, 7.10, 7.13–18
- Reference Danelian and Popov2003
Triplococcus acanthicus Danelian and Popov, p. 333, figs. 5g–5m, 6a–6c.
- Reference Zong, Wang, Gong, Xiao, Wang and Fan2015
Triplococcus acanthicus; Zong et al., figs. 4.12–4.15, 4.18.
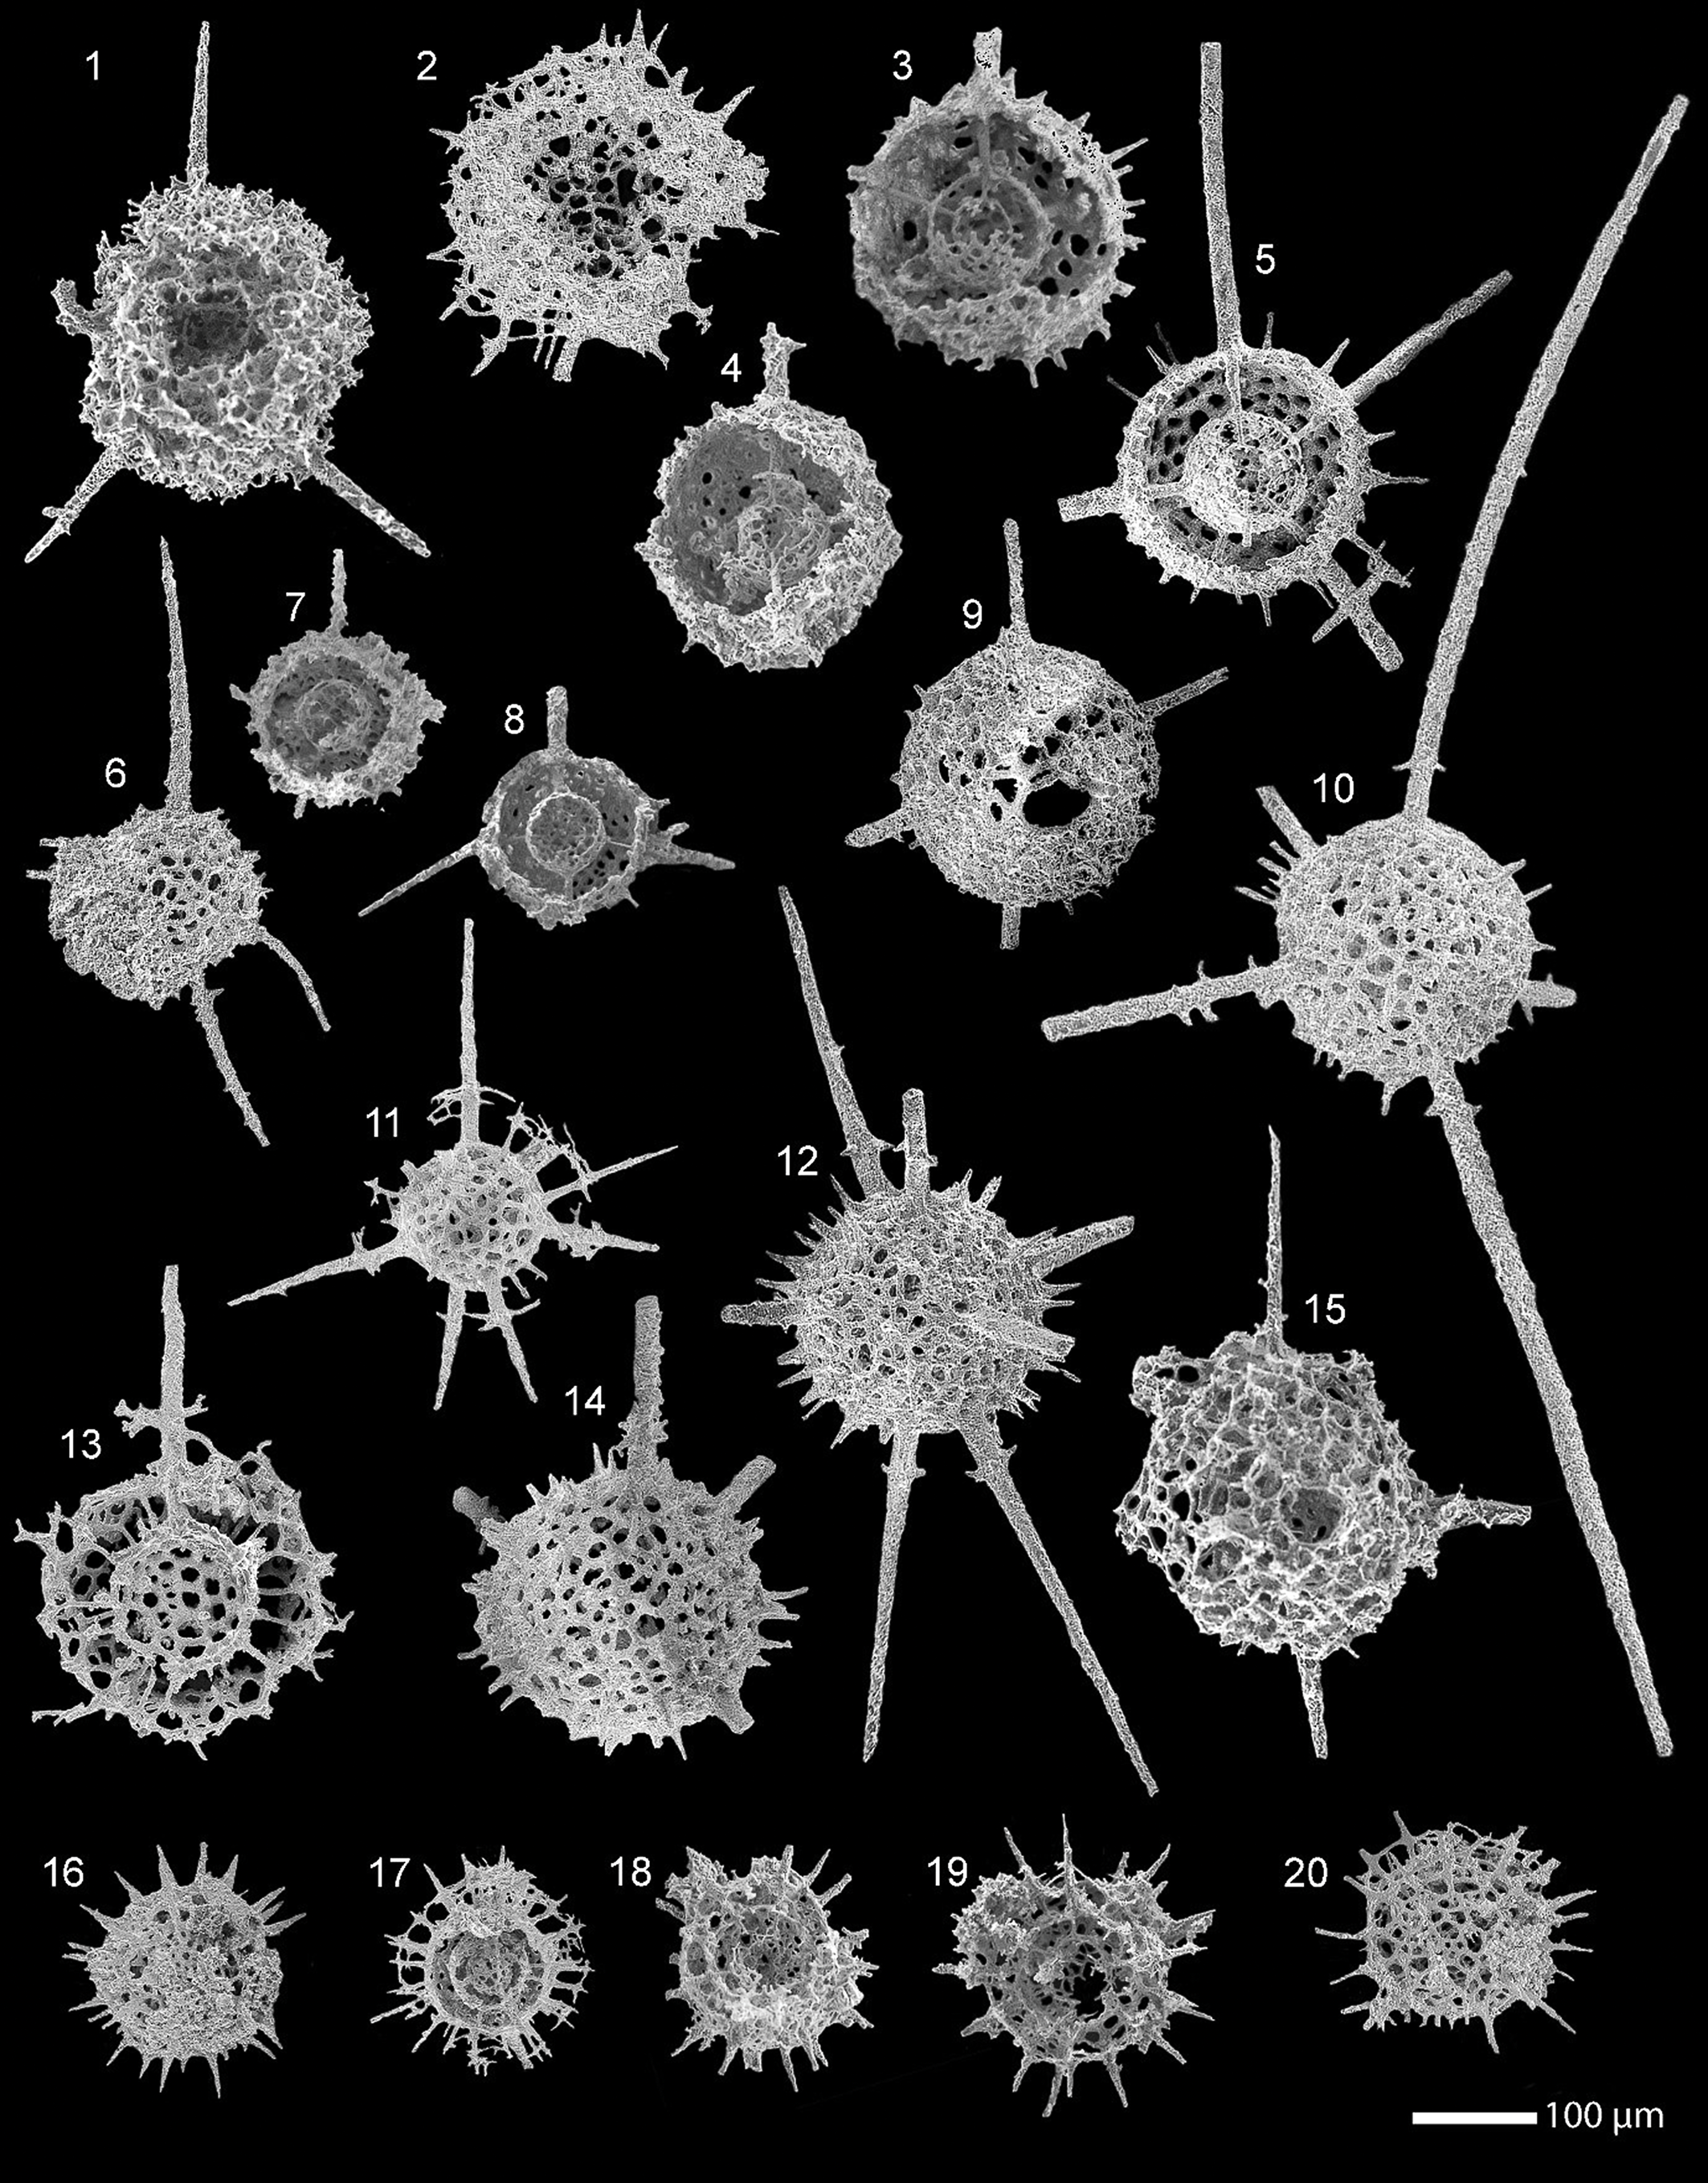
Scanning electron and transmitted light micrographs of radiolarians extracted from the limestone at the Piccadilly Quarry, western Newfoundland, Canada. Scale bar = 100 µm. (1–5) Plussatispila sp. cf. P. cornwallisensis MacDonald: (1–3, 5) from PD13: (4) from PD05: (7–9, 11, 12) comparison of the entactinarian, Spongentactinia armillata (Fortey and Holdsworth, Reference Fortey and Holdsworth1971) to show the external similarities with the spumellarians: (6, 10, 13–18) Triplococcus acanthicus Danelian and Popov from PD13.

Holotype
Specimen (MNHN F62107) from the Akzhal Formation, southern Betpak-Dala desert, Kazakhstan (Danelian and Popov, Reference Danelian and Popov2003, fig. 5h).
Emended diagnosis
Skeleton consisting of three encapsulated and perforated spheres, five main spines that traverse all spheres to join at a small microsphere. Numerous by-spines commonly originate from the inner sphere. The shape of external and internal spheres is almost perfectly spherical with a radial body plan. Main spines project outside the external sphere in the form of robust rod-like spines that taper only slightly distally. Variability in the origin of the by-spines at the external surface of the median sphere and occasionally the innermost sphere. Their projection outside the external sphere tapers relatively rapidly distally. The abundance of by-spines commonly increases from the external surface of the inner sphere to the median sphere, with the majority of by-spines present on the outer sphere.
Occurrence
Ordovician, upper Dapingian? of the Akzhal Mountains, Balkhash Region, Kazakhstan (Danelian and Popov, Reference Danelian and Popov2003); China (Zong et al., Reference Zong, Wang, Gong, Xiao, Wang and Fan2015); middle Darriwilian from the Table Cove Formation, western Newfoundland (herein).
Description
Skeleton consisting of three almost perfect spheres and a microsphere: outer sphere Ø: 216–230 µm; well-defined median sphere Ø: 140–152 µm; inner sphere Ø: 80–85 µm; microsphere Ø: 40 µm (Ø denotes the diameter of the sphere). Each sphere is typically thin, with irregular pore framework. Clear development of a fragile microsphere (rarely preserved on many specimens) was observed in a μ-CT scan (M1S03; Fig. 6) and a few SEM images (Fig. 7.18, 7.19). No variation in size of the microsphere was observed. The microsphere consists of narrow bandages that form a thin sphere with irregular oval perforated pores. The inner sphere is also made of narrow bandages that are thickest close to an apical pore (apical pore Ø: 38 µm; bandages: 6–12 µm wide and ~1–2 µm thick). Towards the basal region, bandages are 2.72–7.63 µm wide and <1 µm thick. The pores have a diameter of 9–49 µm; average 11.8 µm on the inner sphere. Typically, pores are oval, but some elongated shapes are also common.
Five equally dispersed outer spines (~220 µm long), with their widest diameter at their junction with the external surface of the outer sphere, are present. The five main spines traverse all spheres to join to the five radial bars developed on the microsphere without support structures. There is no evidence that these spines continue into the microsphere. In the μ-CT scan, one main radial ray was not preserved at the microsphere, but spines continue inside from the outer sphere, indicating the likelihood that it was formerly present. Numerous by-spines originate on the external surface of the median sphere and 12 out of 43 of these by-spines originate from the outer surface of the inner sphere. The by-spines are short (up to 23 µm) and taper relatively rapidly, distally.
The median sphere contains a small un-rimmed, primitive pylome (Ø: 48 µm), which is obstructed by the outer sphere (Fig. 6.5). Pore shape, size, and configuration vary, even across a single specimen. The surfaces of the bandages usually bear large (8 µm high) ridges, which support the by-spines and connect the pore junctions. Variation in the nature of the median sphere wall was observed on the same specimen ranging from a hexagonal pattern with semi-regularly sized pores to a labyrinth of thin bandages with irregular pores.
An apical pore (Ø: 39 µm) is developed between two radial bars on the inner sphere. It is located in the opposite location to the primitive pylome on the median sphere. The apical pore (Fig. 6.4) roughly mimics the shape and the size of the pylome opening, compared to its size on the median sphere. Two small by-spines are located around the apical pore on the inner sphere and the pylome on the median sphere. These by-spines both originate from the inner sphere. Pores that directly surround the apical pore are slightly larger (Ø: 20–23 µm) than those on the rest of the inner sphere (Ø: 12 µm). Therefore, the symmetry of Triplococcus acanthicus is radial, but heteropolar.
Materials
Three hundred and fifty-four specimens identified from the Table Cove Formation, Piccadilly Quarry, western Newfoundland.
Remarks
Triplococcus acanthicus is the smallest taxon assigned to the genus. It is also the most dominant taxon in all samples, comprising 36% of all radiolarian specimens. Although the microsphere was observed for the first time in this study, the structure of the inner sphere is considered to have greater taxonomic value. The polar nature of T. acanthicus is recognized for the first time due to the arrangement of spines, the presence of an apical pore on the inner sphere, and a pylomate opening on the median sphere. Considerable variation is noted in the preservation of the skeleton among specimens, especially in wall thickness. The conspicuous hexagonal pattern at different ontogenic stages may cause confusion in taxonomy and reflects a distinct style of growth.
Danelian and Popov (Reference Danelian and Popov2003) reported a slightly larger median sphere than that documented by Zong et al. (Reference Zong, Wang, Gong, Xiao, Wang and Fan2015) or observed in our specimens (median sphere Ø: 155–167 µm in Danelian and Popov, Reference Danelian and Popov2003; 140 µm in Zong et al., Reference Zong, Wang, Gong, Xiao, Wang and Fan2015; 140–152 µm herein). The material in our study also exhibits less variation in the size of the outer sphere (Ø: 216–230 µm from 131 measured specimens) compared to the nine measured specimens reported by Danelian and Popov (Reference Danelian and Popov2003; outer sphere Ø: 214–257 µm).
Triplococcus sp. aff. T. acanthicus (Danelian and Popov, Reference Danelian and Popov2003)
Figure 8.16–8.20
- aff. Reference Danelian and Popov2003
Triplococcus acanthicus Danelian and Popov, p. 333, figs. 5g–m, 6a–c.
- aff. 2015
Triplococcus acanthicus; Zong et al., Reference Zong, Wang, Gong, Xiao, Wang and Fan2015, figs. 4.12–15, 4.18.
Scanning electron micrographs of radiolarians extracted from the limestone at the Piccadilly Quarry, western Newfoundland, Canada. Scale bar = 100 µm. (1) Syntagentactinia biocculosa Nazarov. PD05; (2) Haplotaeniatum sp. PD13: (3–5, 9, 10, 12, 15) Triplococcus aksuranesis Pouille and Danelian; (3–5, 10, 12) from PD13; (9, 15) from PD05; (6–8) Inanibigutta sp. A.; (6, 8) from PD13; (7) from PD09; (11, 13, 14) comparison of broken specimens of the entactinarian, Spongentactinia armillata (Nazarov), with the spumellarians to show the similarities of the inner shells, from PD13; (16–20) Triplococcus sp. aff. T. acanthicus (Danelian and Popov), PD13.
Occurrence
Middle Ordovician, middle Darriwilian from the Table Cove Formation, western Newfoundland (herein).
Description
Small variant of Triplococcus with numerous thick by-spines where five of these spines originate at the external surface of the microsphere and the majority of the others originate at the inner sphere. By-spines are thickest between the median and outer sphere, then taper relatively rapidly distally. Some additional, thinner by-spines are also developed on the external surface of the median sphere. The shapes of external and internal spheres are slightly oblate, with a radial body plan. Sphere dimensions are similar to the median and inner sphere and microsphere of T. acanthicus: outer sphere Ø: 190–200 µm; median sphere Ø: 110–135 µm; inner sphere Ø: 75–80 µm; microsphere Ø: 45 µm. Correlation between a smaller inner sphere (Ø: 75 µm vs 80 µm) and longer by-spines (90 µm vs 50 µm long) is observed.
Materials
Twenty-eight specimens identified from the Table Cove Formation, Piccadilly Quarry, western Newfoundland.
Remarks
Triplococcus sp. aff. T. acanthicus lacks development of the five main spines that traverse all spheres, which is characteristic of T. acanthicus. However, five beams are developed on the microsphere, which is also seen in T. acanthicus. These beams do not develop into robust main spines, only into by-spines on the outer sphere. The five by-spines on the outer sphere that developed on the microsphere are indistinguishable from the numerous by-spines that develop on the inner sphere.
Triplococcus aksuranesis Pouille and Danelian in Pouille et al., Reference Pouille, Danelian, Pour and Popov2013
Figures 8.3–8.5, 8.9, 8.10, 8.12, 8.15, 9
- Reference Pouille, Danelian, Pour and Popov2013
Triplococcus aksuranesis Pouille and Danelian in Pouille et al., p. 1147, figs. 4.1–4.14, 6.2.
- aff. Reference Nazarov, Popov and Apollonov1975
Pylentonema aperta Nazarov, Popov, and Apollonov, p. 102, figs. 1, 2.
- aff. Reference Nazarov1988
Cessipylorum apertum Nazarov, p. 70, pl. 10, fig. 6.
μ-CT model of a digitally segmented T. aksuranesis from two orientations. The total length of the main spines was not scanned in an attempt to improve the resolution of the scan of the spheres. Seven main spines and two long by-spines. Radial bar (rb), microsphere (ms).
Holotype
Specimen (USTL1173/048) from the Shundy Formation, Balkhash Region, Kazakhstan (Pouille et al., Reference Pouille, Danelian, Pour and Popov2013, fig. 4.3a).
Occurrence
Middle Ordovician, upper Darriwilian of the Shundy Formation, Balkhash Region, Kazakhstan (Pouille et al., Reference Pouille, Danelian, Pour and Popov2013); middle Darriwilian from the Table Cove Formation, western Newfoundland (herein).
Description
Dimensions comparable to those of the holotype, Triplococcus aksuranesis Pouille and Danelian (Pouille et al., Reference Pouille, Danelian, Pour and Popov2013). Outer sphere Ø: 260–360 µm; median sphere Ø: 183–220 µm; inner sphere Ø: 90–110 µm; microsphere Ø: 50 µm. The inner sphere and microsphere are typically thin and appear to be constructed of thin bandages producing irregular sub-circular, pores (Ø: ~10–25 µm). The median sphere is constructed from bandages with a thickened pore-frame, which is regularly perforated with numerous hexagonal to sub-circular pores (Ø: 5–20 µm). Occasionally a primitive pylome (20–25 µm) develops on the median sphere (Figs. 8.9, 8.15, 9). The rim of the pylome opening is fringed with a small ridge (5 µm thick).
The outer sphere is thick and irregularly latticed with oval to angular-oval pores (more rarely rounded). The size of the pores is variable (9–30 µm). The microsphere and inner sphere are typically very thin and appear to be constructed by thin bandages producing irregular sub-circular, pores (Ø: 5–18 µm). A microsphere is commonly present, but is typically only partially preserved. Only relics of the outer sphere are preserved as apophyses in the Table Cove Formation material.
Six to eight outer spines originate from the microsphere, where six of the spines commonly develop into robust outer spines and the other two into long by-spines. Commonly, the robust main spines gradually thicken until the outer sphere, from which they can extend up to 590 µm farther (average length 320 µm). Straight or curved rays may branch from the base of the outer spine and merge into the latticed outer sphere. Numerous short by-spines (up to 30 µm long) originate from the pore-frame junctions of the median sphere and project where the outer sphere should be.
Materials
Thirty-one specimens were identified, most likely in various stages of their ontogeny: two specimens from sample PD02, nine specimens from PD05, 10 specimens from sample PD09, and 10 specimens from sample PD13 from the Table Cove Formation, Piccadilly Quarry, western Newfoundland.
Remarks
Triplococcus aksuranensis differs from T. acanthicus in its larger size (outer sphere Ø: 214–257 µm; median sphere Ø: 140–152 µm; inner sphere Ø: 80–85 µm for T. acanthicus). Triplococcus aksuranensis has similar dimensions and structures to Triplococcus akzhala (Danelian and Popov, Reference Danelian and Popov2003) (median sphere Ø: 180–260 µm; inner sphere Ø: 90–100 µm for T. akzhala). However, T. akzhala can be distinguished from T. aksuranensis by its ellipsoidal shape and greater number of outer spines (maximum 12 outer spines in T. akzhala, maximum eight outer spines in T. aksuranensis).
Triplococcus aksuranensis displays some morphological similarities with the Inanigutta penrosei group sensu Maletz and Bruton (Reference Maletz and Bruton2008) in the presence of two spheres and a microsphere. Juveniles or broken specimens of T. aksuranensis may also be confused with the genus Inanihella, which has a similar dimension for its microsphere (Ø: 45–55 µm) and inner sphere (Ø: 200–220 µm). Inanihella may also have a pylome on the outer sphere and can be distinguished from Triplococcus by the close spacing between its outer and inner sphere.
The long spines are diagnostic of this taxon, but are not always present or preserved. Noble and Aitchison (Reference Noble and Aitchison2000) defined a “long-spined inaniguttid zone 1” as a characteristic biostratigraphic interval covering the Darriwilian, which correlates with Nazarov's (Reference Nazarov1988) Haplentactinia juncta-Inanigutta unica Zone.
The material described herein is highly variable and could potentially belong to more than one species. Currently, the intra-specific variation among different taxa of the inaniguttids is not fully understood. A polarity can be argued because the two long by-spines extend at 120° to one another, as seen in T. acanthicus and the robust main spines are distributed on the lateral plane.
Our material is morphologically similar to Triplococcus aksuranesis reported by Pouille et al. (Reference Pouille, Danelian, Pour and Popov2013, fig. 4.1–4.14), which differs from the material in this study only in the number of outer spines and presence of numerous beams that originate at the surface of the median sphere rather than the surface of the inner sphere.
Genus Plussatispila MacDonald, Reference MacDonald2006
Type species
Plussatispila magnilimax MacDonald, Reference MacDonald2006, from the upper Llandovery of the Cape Phillips Formation, Cornwallis Island, Nunavut, Canada, by original designation.
Remarks
Larger taxa are more difficult to compare because their internal features can be more affected by infilling and breakage. Furthermore, the resolution of the number of spheres and spines number in the family Inaniguttidae remains elusive. Thus, synonymies should be approached with caution.
Plussatispila sp. cf. P. cornwallisensis MacDonald, Reference MacDonald2006
Figures 8.1–8.5, 10
- cf. Reference MacDonald2006
Plussatispila cornwallisensis MacDonald, p. 34, figs. 3.2, 3.4, 3.6, 3.9, 7.1, 7.2, 7.4, 7.5, 7.7, 7.8, 7.11, 7.12.
μ-CT model of a digitally segmented specimen of Plussatispila sp. cf. P. cornwallisensis MacDonald, M4S09 from sample PD13. Main spines are left out of the field of view in order to gain maximum resolution for the internal features. The inner sphere and microsphere have been destroyed by secondary infilling and the growth of calcite crystals (false color purple). Radial bar (rb).

Holotype
Specimen (GSC 126515) from the upper Llandovery of the Cape Phillips Formation, Cornwallis Island, Nunavut, Canada (Plussatispila cornwallisensis MacDonald, Reference MacDonald2006, fig. 3.2).
Occurrence
Middle Ordovician, middle Darriwilian from the Table Cove Formation, western Newfoundland.
Description
Outer sphere Ø: 358–418 µm (average 362 µm); median sphere Ø: 250–297 µm; inner sphere Ø: ~100 µm. Secondary infilling and imperfect preservation preclude detailed observation of the microsphere. Specimens show no evidence of a fourth sphere. Numerous by-spines originate at the pore-junction of the median sphere. Twelve out of 18 specimens have by-spines that do not project to the external surface of the outer sphere (Figs. 8.5, 10). The presence of a pylome is difficult to assess.
Materials
Nineteen specimens identified from the Table Cove Formation, Piccadilly Quarry, western Newfoundland.
Remarks
Plussatispila sp. cf. P. cornwallisensis is easily distinguished by its large size, even though it is commonly poorly preserved. This taxon can be distinguished from Triplococcus and other three-sphered inaniguttids by the larger diameter of the outer and median spheres (outer sphere Ø: 358–418 µm; median sphere Ø: 250–297 µm).
Our material can be compared to the lower Silurian (upper Llandovery) P. cornwallisensis reported by MacDonald (Reference MacDonald2006: outer sphere Ø: 384–495 µm; median sphere Ø: 240–303 µm; inner sphere Ø: 83–98 µm). This could possibly extend the stratigraphic range of P. cornwallisensis to the Middle Ordovician. Our material differs by lacking the apophyses that develop on the radial beams between the inner and median sphere, and is likely to represent an intermediate form between Plussatispila and possibly Triplococcus.
Genus Inanibigutta Nazarov, Reference Nazarov1988
Type species
Inanibigutta aksakensis (Nazarov, Reference Nazarov1975) from the dark gray argillaceous limestone of the lower part of the Bestamak Formation, Chingiz Range Kazakhstan, by original designation.
Remarks
Preservation and obstruction of the internal elements makes the identification of the genus Inanibigutta difficult from the rest of the inaniguttids. It was curious to note the rarity of this this genus in our material when other authors report it at higher relative abundance from other localities (Fig. 5). Whether this is a true faunal bias or a selection bias is uncertain.
Inanibigutta sp. A
Figure 8.6–8.8
Occurrence
Middle Ordovician, middle Darriwilian from the Table Cove Formation, western Newfoundland.
Description
Spherical skeleton, with six main spines of approximately the same size (up to 310 µm long). Main spines rod-like, thin, regularly narrowing towards a sharp distal end. No by-spines observed. Outer sphere (Ø: 184–200 µm) with many small pores (Ø: ~5–8 µm) of various shapes (from oval to purely hexagonal). Inner sphere large (Ø: 90–100 µm), thin, with many small pores of various shapes but of approximately the same size. Microsphere (Ø: ~50 µm) occasionally preserved.
Materials
Five specimens identified from the Table Cove Formation, Piccadilly Quarry, western Newfoundland.
Remarks
It is difficult to distinguish Inanibigutta sp. A from the long-spined Triplococcus aksuranesis due to the identical sphere dimensions of T. aksuranesis (median sphere Ø: 183–220 µm; inner sphere Ø: 90–110 µm; microsphere Ø: 50 µm). The only difference being that there is no growth of a fourth shells, like that seen in T. aksuranesis.
Family Haplotaeniatidae Won, Blodgett, and Nestor, Reference Won, Blodgett and Nestor2002
Emended diagnosis
Spherical skeleton with continuous but irregular whorls with a spiraliform arrangement. A microsphere is positioned at the innermost part of the skeleton and directly connected to the first whorl.
Remarks
Emendment to the diagnosis of Won et al. (Reference Won, Blodgett and Nestor2002) is appropriate because a continuous spiral arrangement can be observed with the μ-CT (Fig. 11). The first whorl begins from the microsphere (some authors use the term proloculus) and is spirally arranged. The whorl continues in a relatively well-developed but irregular spiral structure throughout most of its skeleton to the outer surface where it then becomes discontinuous to form a closed, outer sphere. Although the extent of development of spiral structures may vary between taxa, the existence of a continuous spiral arrangement should be included in the family description.
Compilation of line drawings, μ-CT models and SEM images illustrating Haplotaeniatum sp. cf. H. vertigospongum Jones and Noble. (1, 2) μ-CT models with the microsphere identified in red; (3, 4) SEM images of a sectioned specimen of Haplotaeniatum sp. cf. H. vertigospongum Jones and Noble; (3) PD13; (4) PD09; (5) digitally segmented microsphere including the initiation of the first whorl; (6) view from inside the first whorl demonstrating the distinct gap and surface between whorls; (7) spongy outer sphere; (8) diagram showing configuration of the microsphere's irregular spiral structure and by-spines; (9) detailed diagram showing the relationship among the microsphere, spiraliform arrangement of whorls, and the by-spines.

Genus Haplotaeniatum Nazarov and Ormiston, Reference Nazarov, Ormiston, Chuashov, Zhamoida and Amon1990, sensu Won, Blodgett, and Nestor, Reference Won, Blodgett and Nestor2002, sensu Jones and Noble, Reference Jones and Noble2006
Type species
Haplotaeniatum labyrintheum Nazarov and Ormiston, Reference Nazarov, Ormiston, Chuashov, Zhamoida and Amon1990, from the middle to upper Llandovery of the Sakmarskaya Suite, southern Urals, by original designation.
Remarks
The genus Haplotaeniatum is restricted to forms with a weakly labyrinthine to spiraliform layering without a distinct microsphere and outer sphere that can occur with or without major spines. The spiraliform layering is weak but recognizable in most sectioned specimens. However, due to the dense nature of the skeleton and the plane of the section being a function of how a specimen is sectioned, the spiraliform nature of the skeleton can still be difficult to distinguish on broken specimens.
It is difficult to discern the features that distinguish among species, but Middle Ordovician haplotaeniatids appear to differ from those of the Upper Ordovician in having a centrally positioned microsphere with a thinner meshwork.
Haplotaeniatum sp. cf. H. vertigospongum Jones and Noble, Reference Jones and Noble2006
Figure 11
- cf. Reference Jones and Noble2006
Haplotaeniatum vertigospongum Jones and Noble, p. 302, pl. 4, figs. 8, 9; pl. 6, fig. 6.
Holotype
Specimen (UCMP 49802) from the lower Wenlock to upper Sheinwoodian of the Cape Phillips Formation, Arctic Canadian (Jones and Noble, Reference Jones and Noble2006, pl. 4, fig. 8).
Occurrence
Uppermost lower Silurian (Sheinwoodian) from the Cape Phillips Formation, Nunavut, Canada (Jones and Noble, Reference Jones and Noble2006) and Middle Ordovician, middle Darriwilian from the Table Cove Formation, western Newfoundland (herein).
Description
Test as per the genus description, consisting of three to four labyrinthine whorls in a spiraliform arrangement growing from a near-spherical microsphere (Ø: 55–70 µm). The microsphere is centrally positioned and latticed with semi-regularly sized pores with irregular shape (pores Ø: ~10 µm). The first whorl quickly develops into a loose meshwork consisting of interconnected loops after ~45 µm of growth. Whorls are compact where the irregular spiraliform is generally difficult to distinguish, but can be recognized by the initial structure of the first whorl (Fig. 11). The first whorl begins from a distinct layer that is connected to the microsphere by a thickened growth with small, irregularly distributed pores (pore Ø: 4–12 µm). The distance between the first whorl and the microsphere can range from 16–30 µm before starting the next whorl. The whorls are continuous and can be followed in three-dimensional space with the μ-CT model. Numerous thin beams are irregularly placed and connect between two whorls. The beams are generally not aligned, but intersect the beams in the previous whorl to produce an alternating arrangement of compartments in the three dimensions of space. The outermost whorl is bent out of the plane of coiling and closed to form a spherical outer sphere (outer sphere surface Ø: 175–200 µm). The outer pores are irregularly shaped, sub-round to angular, and variable in size, giving the outer sphere a spongy appearance. Numerous by-spines cover the outer surface, which commonly consists of a protrusion of struts within the labyrinthine wall structure. No pylome was observed.
Materials
Twenty-one specimens identified from the Table Cove Formation, Piccadilly Quarry, western Newfoundland.
Remarks
The complex structure of Haplotaeniatum was studied with the μ-CT to understand skeletal formation. Despite the regular shape in equatorial and axial thin section, the spiraliform structure cannot always be easily discerned. The meshwork is not interwoven tightly enough to define a spherical layer. The spiraliform structure was only visible in properly oriented cross-sections. However, the spiral is most pronounced in the area where the first whorl develops and this provides the clearest indicator of a spiral arrangement. The microsphere of haplotaeniatids differs from the microsphere observed in the multi-sphered inaniguttids by being directly connected to the next layer to form a spiral arrangement.
Our material is most closely comparable to Haplotaeniatum vertigospongum from the lower Silurian Cape Phillips Formation, Nunavut, Canada (Jones and Noble, Reference Jones and Noble2006). Both lack any robust main spines, but the material in this study differs in its denser and more finely porous labyrinthine wall structure with numerous by-spines. The microsphere was not measured on H. vertigospongum. However, the outer sphere surface on the material in this study is smaller (outer sphere Ø: 175–200 µm; ~220–283 μm in H. vertigospongum). This, however, could be a result of development of an extra whorl found in the Cape Phillips Formation material. Furthermore, Haplotaeniatum sp. cf. H. vertigospongum can be distinguished easily from other Middle Ordovician taxa assigned to Haplotaeniatum in its smaller size (outer sphere Ø: 336–354 µm in H. circulus; 296–354 µm in H. labyrintheum) and slightly larger, centrally positioned microsphere (Ø: 40–52 µm in H. circulus Pouille, Danelian, and Popov, Reference Pouille, Danelian and Popov2014; 38–43 µm in H. labyrintheum; 55–70 µm in Haplotaeniatum sp. cf. H. vertigospongum).
Haplotaeniatum sp. cf. H. vertigospongum differs from H. tegimentum Nazarov (Nazarov and Ormiston, Reference Nazarov, Ormiston, Chuashov, Zhamoida and Amon1990, fig. 9.8) in having a larger, eccentrically placed microsphere (55–70 µm cf. 34–42 µm in H. tegimentum), aligned compartments, and a more robust skeleton.
Haplotaeniatum sp.
Figure 8.2
Occurrence
Upper Ordovician, middle Darriwilian from the Table Cove Formation, western Newfoundland.
Description
Small specimen of Haplotaeniatum (outer sphere Ø: 240 µm) with numerous by-spines (40 µm long) where main spines are absent. Three, likely more, pseudo-spongy internal spheres displaying a slightly spiraliform arrangement.
Materials
Ten specimens identified from sample PD13 from the Table Cove Formation, Piccadilly Quarry, western Newfoundland.
Remarks
The innermost framework is broken, but the spiral structure can be detected. Haplotaeniatum sp. (Fig. 8.2) is noteworthy because it is noticeably larger than Haplotaeniatum sp. cf. H. vertigospongum (Fig. 11). Since the innermost structure is broken on all specimens observed, it cannot be identified to the species level.
Genus Syntagentactinia Nazarov in Nazarov and Popov, Reference Nazarov and Popov1980
Type species
Syntagentactinia biocculosa Nazarov in Nazarov and Popov, Reference Nazarov and Popov1980, from the Middle Ordovician Bestamak Formation, Southwest Pre-Tschingiz, Kazakhstan.
Syntagentactinia biocculosa Nazarov in Nazarov and Popov, Reference Nazarov and Popov1980
Figure 8.1
- 1980
Syntagentactinia biocculosa Nazarov in Nazarov and Popov, pl. 12, figs. 1–3.
- 2014
Syntagentactinia biocculosa; Pouille et al., p. 151, pl. 1, figs. 5–7.
- 2018
Syntagentactinia sp. aff. S. excels Yi et al., figs. 4E–H.
Holotype
Specimen (GIN 4333-18a) from the Middle Ordovician Bestamak Formation, Southwest Pre-Tschingiz, Kazakhstan (Nazarov and Popov, Reference Nazarov and Popov1980, pl. 12, fig. 1).
Occurrence
Middle Ordovician, Kazakhstan (Nazarov and Popov, Reference Nazarov and Popov1980); South China (Yi et al., Reference Yi, Yuan, Aitchison and Feng2018); middle Darriwilian from the Table Cove Formation, western Newfoundland.
Description
The outermost sphere (Ø: 250 µm) is formed of a dense labyrinth of spongy meshwork that originates from two levels of apophyses branching from the primary spines. Internal framework consists of a small, centrally located, latticed microsphere (Ø: 50 µm). Four visible long, massive main spines (up to 150 µm or more) outside the outer sphere. No secondary spines are present. Four to six thin beams radiate from microsphere and become thick, robust primary spines at the surface.
Materials
Two specimens identified from the Table Cove Formation, Piccadilly Quarry, western Newfoundland.
Remarks
Syntagentactinia biocculosa is distinguished from other members of the genus Syntagentactinia by its denser labyrinth and possession of six long, robust rod-like spines. Because the primary spicules of the observed specimens are broken, it is difficult to know the exact number of primary rays that originated from the microsphere of the specimens in the material. The skeleton structure and dimensions closely resemble those of Syntagentactinia sp. cf. S. excelsa Nazarov and Ormiston, Reference Nazarov, Ormiston, Blueford and Murchey1993. However, Syntagentactinia sp. cf. S. excelsa differs by having a looser latticed inner sphere and in having a more distinct inner cavity.
Results
The absence of the radiolarian species Haplentactinia juncta Nazarov, Reference Nazarov1975, which is one of the characteristic species of the Haplentactinia juncta-Inanigutta unica assemblage (Nazarov and Ormiston, Reference Nazarov, Ormiston, Blueford and Murchey1993; Danelian and Popov, Reference Danelian and Popov2003; Maletz, Reference Maletz2011) is notable. The absence H. juncta as well as the distinctive genus Protoceratoikiscum seems inconsistent with the conodont and graptolite age assignment. However, Protoceratoikiscum has been only reported, so far, from relatively deep-water facies (Goto et al., Reference Goto, Umeda and Ishiga1992; Li, Reference Li1995; Danelian and Clarkson, Reference Danelian and Clarkson1998; Danelian, Reference Danelian1999; Cui et al., Reference Cui, Hua and Song2000; Buckman and Aitchison, Reference Buckman and Aitchison2001; Danelian and Floyd, Reference Danelian and Floyd2001; Noble and Webby, Reference Noble and Webby2009; Obut and Semenova, Reference Obut, Semenova, Guiterrez-Marco, Rabano and Garcia- Bellido2011). The absence of Protoceratoikiscum supports the suggestion of Nazarov and Popov (Reference Nazarov and Popov1980) and Pouille et al. (Reference Pouille, Danelian, Pour and Popov2013) that this taxon potentially reflects a particular paleoecological preference.
All taxa reported from this site (Fig. 5) are used to determine the relative abundances of the groups discussed below. Although a large variety of forms can be documented, a dominance (96% of the relative abundance) of spherical radiolarians (with at least one well-developed sphere) is attributable to the entactinarians, spumellarians, and the aspiculids. Furthermore, one spumellarian genus, Triplococcus, dominates and characterizes the assemblage (48% of the relative abundance). A similar dominance of the genus Triplococcus (37%) was reported from a similar black to dark-gray micritic limestone lithology from the uppermost Darriwilian Shundy Formation of Kazakhstan (Pouille et al., Reference Pouille, Danelian and Popov2014). Other researchers examining the Shundy Formation have also commented on this characteristic composition (Nazarov, Reference Nazarov1975, Reference Nazarov1988; Nazarov et al., Reference Nazarov, Popov and Apollonov1977; Nazarov and Popov, Reference Nazarov and Popov1980; Nazarov and Ormiston, Reference Nazarov, Ormiston, Blueford and Murchey1993; Danelian and Popov, Reference Danelian and Popov2003). Thus, it is likely that this similarity is due to similarities in sedimentary and oceanographical conditions, which favored large blooms of spumellarians.
Discussion
Assessment of biodiversity is hindered by difficulties in observing internal features. Some specimens were successfully sectioned for SEM analysis using Dumitrică’s method (e.g., De Wever et al., Reference De Wever, Dumitrica, Caulet, Nigrini and Caridroit2001), but very few clear images were obtained, creating uncertainty in identifications. This could explain the apparent difference in faunal compositions between the material reported in this study and that reported from a nearby locality by Renz (Reference Renz1990). Renz (Reference Renz1990) reported that 92% of the relative abundance was attributable to the Family Inaniguttidae. Whereas the inaniguttid genus, Triplococcus, comprises 48% of the fauna reported herein. Such differences among Ordovician radiolarian faunas may be a result of preservational bias. For example, most studies have been made from cherts (Danelian and Clarkson, Reference Danelian and Clarkson1998; Buckman and Aitchison, Reference Buckman and Aitchison2001; Danelian and Floyd, Reference Danelian and Floyd2001) where the specimens are strongly recrystallized and the full original range of taxa may be indeterminable.
Taxonomic review
A high degree of variability exists among the sizes of different spheres in many groups (e.g., inaniguttids). However, they all appear to be united within their families by the mode of construction of their skeletal features. The presence of homologous elements of the internal framework and its rudiments in the majority of radiolarians suggests the monophyletic origin of this group. They are constructed from pore-bars with slightly polygonal outlines or from bandages. Bandage-like development and labyrinthine skeletons first appeared in the Middle Ordovician (uppermost Floian to basal Dapingian; Maletz and Bruton, Reference Maletz and Bruton2007). Radiolarians with these types of skeletal development represent the first known appearances of members of the order Spumellaria. In this study, μ-CT images of Triplococcus acanthicus and T. aksuranesis reveal a development of the initial sphere with “bandages.” Haplotaeniatum sp. cf. H. vertigospongum is revealed to be a labyrinthine species.
Examination of the structural development of sphere walls is necessary in the identification of extant taxa. However, taphonomy can easily affect the thickness and structure of a fossil skeleton. Even in the well-preserved specimens studied here, there is a varying degree of development from different regions on the same specimen. Depending on the angle of observation, this can affect the shape, size, and configuration of pores.
Inaniguttidae
A brief review of the dominant Ordovician inaniguttids is provided here. Although first described over 30 years ago (Nazarov and Ormiston, Reference Nazarov and Ormiston1984), the internal structures of the type species of several genera assigned to this family have never been clearly displayed and are in need of revision. Currently, in order to differentiate between species within the inaniguttid genera, comparisons are based on a wide variety of the sphere dimensions, numbers of outer spines, sphericity, and spacing between spheres. For example, in spite of the overall morphological similarity of T. acanthicus and T. aksuranensis, T. acanthicus has smaller, robust spheres that can be easily identified (outer sphere Ø: 216–230 µm in T. acanthicus; Ø: 290 µm in T. aksuranensis). The practice of quantitatively comparing the dimensions of skeletal elements of spherical radiolarians among various morphotypes similar to that applied in studies of Cenozoic forms (Cortese and Björklund, Reference Cortese and Björklund1998) is adopted here. Centrifugal growth is an essential part of skeletal development, allowing the living cell to increase in size as it grows. The relevance of the number of spheres, skeletal spines, and their connections needs to be seen from a phylogenetic view in order to differentiate homoplasies from homologies. Hollande and Enjumet (Reference Hollande and Enjumet1960) remarked that there is a constant relationship between the structure and the size of the innermost skeleton and the morphology of the nucleo-axopodial complex they established. In other words, there is a constant relationship between the structure and size of the innermost skeleton and the systematics. Number of spheres is important, but considerable caution in identification is recommended because the internal features are generally delicate and fragile and, as a result, their preservation is uncommon.
When spheres are not all preserved, the median spheres of genus Triplococcus can easily be misidentified as spheres from one of the members of the genera Inanihella, Inanibigutta, and Inanigutta. Moreover, in other studies of Cenozoic radiolarians, it has been found that the number of spheres is variable depending on the ontogenic stage (Cleve, Reference Cleve1899; Petrushevskaya, Reference Petrushevskaya1967; Björklund, Reference Björklund1974; Itaki et al., Reference Itaki, Ito, Narita, Ahagond and Sakai2003; Nishimura, Reference Nishimura2003; Suzuki, Reference Suzuki2006). MacDonald (Reference MacDonald2006) questioned the use of sphere number as a diagnostic feature, and Maletz (Reference Maletz2011) argued that taxa in this family need to be re-evaluated because sphere number may also depend on the ontogenetic growth stage of the specimen being observed. Lastly, we are still uncertain about the limits of morphological variation in the dimensions of spheres between taxa. In our material, the inaniguttids were observed to have less variation in their species groups than those described in similar faunas by Danelian and Popov (Reference Danelian and Popov2003) and Pouille et al. (Reference Pouille, Danelian, Pour and Popov2013).
Polarization of the skeleton is observed in the majority of the μ-CT scans. This is not simply a single or homologous character in radiolarian evolution, but a general possibility and trend in many groups of radiolarians. It develops independently and is expressed in various ways and in different skeletal features. However, the type of polarization is unique and can occur as an eccentrically placed spicule or sphere, apical and basal pores, polarized spines, or as a pylome.
The presence of a pylome is variable and not a distinguishing criterion in many inaniguttids. However, the size of the pylome might be important. The presence of an indistinct pylome that is sometimes present on the median sphere of Triplococcus aksuranesis and T. acanthicus is a vague and unreliable feature for identification. It is noteworthy though because a similar pylome is used to distinguish the genus Kalimnasphaera, which can be externally similar to Triplococcus.
The microsphere of the inaniguttids is distinct from that in the haplotaeniatids, and the phylogenetic relevance of the microsphere still needs to be explored in more detail. Although μ-CT work has resolved some species-level problems, secondary infilling and poor preservation of the innermost features in our material precludes complete observation. The nature and relationship of the microsphere (if it existed) to other skeletal elements was not always revealed.
Conclusions
The internal features of the radiolarians are much more complex than their external appearance suggests, with interlocking facets between numerous spheres of varying geometry and thickness. The mode of construction of their skeletal features is revealed to be a uniting feature within different clades of the order Spumellaria in the Middle Ordovician. The μ-CT data from specimens of a new, previously undescribed radiolarian assemblage from the Table Cove Formation at the Piccadilly Quarry, western Newfoundland has provided a diagnostic tool for taxonomic assignment and an insight into the significance for the development of a natural taxonomy of Paleozoic radiolarians.
Acknowledgments
We thank D. Wang and C. Evans at the University of Queensland Julius Kruttschnitt Mineral Research Centre (Brisbane, Australia) for their technical assistance and advice. Financial support towards investigation of early Paleozoic radiolarian evolution was provided by the Australian Research Council (ARC DP 1501013325 to Aitchison). Lastly, a big thanks to T. Danelian, O. Obut, and P. Noble for the helpful corrections to the manuscript.
Accessibility of supplemental data
Data available from the UQ eSpace data repository. DOI: http://dx.doi.org/10.14264/uql.2019.296


 Open access