

Gastric emptying (GE) has a fundamental role in the digestion of nutrients, and is a major determinant of postprandial glycaemia( Reference Horowitz and Fraser 1 ) and gastric symptoms( Reference Delgado-Aros, Camilleri and Cremonini 2 , Reference Delgado-Aros, Camilleri and Castillo 3 ). In addition, altered GE has been implicated in the pathogenesis of overconsumption, leading to weight gain and obesity( Reference Hellström 4 – Reference Jackson, Leahy and McGowan 10 ). Over the last 30 years, a number of studies have investigated this possible linkage but with conflicting outcomes, indicating that the role of GE in obesity is still unclear. Accelerated( Reference Wright, Krinsky and Fleeman 6 – Reference Mathus-Vliegen, Leeuwen and Roolker 8 ), similar( Reference Hutson and Wald 11 – Reference Vazquez Roque, Camilleri and Stephens 13 ) and delayed( Reference Jackson, Leahy and McGowan 10 , Reference Maddox, Horowitz and Wishart 14 – Reference Meyer-Gerspach, Wolnerhanssen and Beglinger 16 ) emptying rates have been reported when comparing obese with lean individuals. This inconsistency has generally been attributed to methodological differences and limitations (e.g. meal size, sex)( Reference Park and Camilleri 17 ). Another possibility is that inconclusive findings may be due to the influence of additional unmeasured or uncontrolled factors, for example habitual physical activity level, body composition (fat mass (FM) and fat-free mass (FFM)) and energy expenditure (EE).
When considering metabolic health, the importance of body composition( Reference Ahima and Lazar 18 ) and physical activity level( Reference Blair 19 ) is becoming increasingly apparent. Furthermore, body composition, but not BMI, has been shown to be associated with daily energy intake in obese adults( Reference Blundell, Caudwell and Gibbons 20 ). However, to date, BMI or ideal body weight has been the major criterion for distinguishing obese and non-obese groups in GE studies( Reference Wright, Krinsky and Fleeman 6 – Reference Mathus-Vliegen, Leeuwen and Roolker 8 , Reference Jackson, Leahy and McGowan 10 – Reference Horowitz, Collins and Cook 15 ). To the best of our knowledge, only two studies have reported directly on body composition (FM and/or FFM)( Reference Mathus-Vliegen, Leeuwen and Roolker 8 , Reference Vazquez Roque, Camilleri and Stephens 13 ). Vazquez Roque et al. ( Reference Vazquez Roque, Camilleri and Stephens 13 ) characterised gastric functions in normal-weight, overweight and obese individuals categorised by BMI and reported lean mass. Although no significant differences were found between groups, increased body weight was associated with faster GE. In another cross-sectional study, Mathus-Vliegen et al. ( Reference Mathus-Vliegen, Leeuwen and Roolker 8 ) reported faster solid emptying in taller subjects with a greater FFM and in subjects with more intra-abdominal fat. These findings suggest a possible relationship between body composition and GE, yet further studies are clearly needed to establish this hypothesis further. Despite numerous studies examining the role of GE in obesity, body composition has received very little attention.
Differences in physical activity and EE may also influence GE. Exercise is known to improve leptin sensitivity via reducing FM( Reference Dyck 21 , Reference Steinberg, Smith and Wormald 22 ), which some evidence in animals suggests may interact with gut hormones such as cholecystokinin and vagal afferent fibres to influence gastric motility( Reference Cakir, Kasimay and Devseren 23 ). It is acknowledged that habitual activity, EE and body composition are interrelated. Indeed, a higher activity EE (AEE) level can also arise in obese individuals due to the greater energy cost of activities associated with increased body weight( Reference DeLany, Kelley and Hames 24 ). However, the influence of resting EE or AEE on GE is unknown. Evidence that GE is faster in marathon runners( Reference Carrio, Estorch and Serra-Grima 25 ) compared with inactive individuals arises from a single quarter-century old study by Carrio et al. ( Reference Carrio, Estorch and Serra-Grima 25 ). They identified faster GE in ten marathon runners compared with ten inactive individuals; however, body surface area was the only proxy characteristic of body composition reported and EE was not measured.
Given the growing interest in targeting the gastrointestinal tract for the treatment of obesity and diabetes( Reference Hellström 4 , Reference Horner, Byrne and Cleghorn 26 – Reference Hasler 28 ), it is pertinent that a better understanding of factors influencing GE is established. In addition, given the role of the gastrointestinal tract in satiation and satiety( Reference Meyer-Gerspach, Wolnerhanssen and Beglinger 16 , Reference Horner, Byrne and Cleghorn 26 , Reference Janssen, Vanden Berghe and Verschueren 29 , Reference Steinert, Meyer-Gerspach and Beglinger 30 ), understanding the associations between physical activity and GE may provide potential mechanistic insight into processes contributing to appetite regulation with exercise. The aims of the present study were to examine and compare GE in habitually active and inactive individuals across a continuum of body compositions (including lean and obese), and to determine the associations among habitual exercise, body composition, EE and GE.
Materials and methods
Participants
A total of forty-four males were studied. Inclusion criteria were as follows: male; aged 18–55 years; BMI 18–40 kg/m2; weight stable ( ± 4 kg over last 6 months); no history of gastrointestinal disorder; non-diabetic; no medical conditions; not taking medication known to influence body composition, EE, GE or appetite; willing to consume the study test meal; not a heavy smoker ( < 10/d); either inactive (undertaking at least one structured exercise session per week and not engaged in strenuous work) or active (undertaking four or more structured exercise sessions per week) over the last 6 months. One exercise session was defined as at least 40 min of moderate to high intensity activity( Reference Long, Hart and Morgan 31 ). Based on our previous work( Reference Horner, Byrne and Cleghorn 32 ), a sample size of twenty-two participants per group was identified as sufficient to detect a 10 % difference between groups for three out of the four GE outcome measures (lag time (t lag), half-time (t 1/2) and ascension time (t asc)). This equated to the ability to detect a mean difference of 13 min in GE t 1/2 between groups at 90 % power and a 0·5 % significance level. The present study was conducted according to the guidelines laid down in the Declaration of Helsinki, and all procedures were approved by the Queensland University of Technology Research Ethics Committee. All participants provided written informed consent.
Study design
After a 12 h overnight fast, and having avoided alcohol and strenuous exercise for 24 h, participants attended the laboratory on two separate test days 1 week apart. Participants were instructed to maintain their typical diet before the testing days, in order to be tested in their habitual state. At the first testing session, body composition and RMR were measured. At the second test session, GE was assessed. Between the two testing sessions, as described further below, participants wore an accelerometer to assess physical activity levels.
Anthropometry and body composition
Height was measured without shoes to the nearest 0·5 cm and weight to the nearest 0·01 kg. Body composition (FM and FFM) was measured using air displacement plethysmography (BodPod™; Life Measurement, Inc.).
RMR
RMR was measured by indirect calorimetry using a ventilated hood system (TrueOne 2400 Metabolic Cart; ParvoMedics). Participants lay supine in a thermoneutral environment, with oxygen uptake, CO2 production and the respiratory quotient being measured over 30 min. The resting heart rate was measured continuously (Polar Electro Oy). RMR was calculated using the Weir formula( Reference Weir 33 ), as the average resting EE over 10 min with the lowest CV( Reference Roffey, Byrne and Hills 34 ). The CV for resting EE was less than 5 % for all participants (mean CV: active 3·3 (sd 0·9) %; inactive 3·1 (sd 0·8) %).
Physical activity and energy expenditure
Physical activity was monitored using a triaxial GT3X accelerometer (ActiGraph) over 7 d before the GE test day, a duration estimated to result in 90 % reliability( Reference Goris, Meijer and Kester 35 ). Participants were instructed to wear the device on the waist, in line with the right hip during waking hours and to remove it only during contact with water (e.g. showering). Data were processed using ActiLife software (version 6.4.5; Actigraph). Triaxial vector magnitude (VM3) counts were summed over 60 s epochs, and levels of activity were defined as counts per min according to validated recommendations( Reference Sasaki, John and Freedson 36 ). Data were checked for spurious values (counts per min >15 000). A non-wear period was defined as at least 90 min of consecutive zero counts without interruption( Reference Peeters, van Gellecum and Ryde 37 ). Wear time exceeding 600 min was considered a valid day( Reference Matthews, Hagströmer and Pober 38 ), and a valid dataset considered a combination of at least three weekdays and one weekend day( Reference Mâsse, Fuemmeler and Anderson 39 , Reference Trost, McIver and Pate 40 ). Time spent in moderate and vigorous (combining vigorous and very vigorous) activities was also calculated. Activity count data were converted to AEE using the ‘Freedson VM3 combination (’11)’ option in ActiLife software (version 6.4.5). Total EE (TEE) was subsequently calculated in Microsoft Excel using the following formula:
 $$\begin{eqnarray} TEE = (AEE + REE)\times 1\cdot 11, \end{eqnarray}$$
where AEE is the activity energy expenditure; REE is the resting energy expenditure; and the thermic effect of food is fixed at 10 % of TEE( Reference Duval, Strychar and Cyr 41 ).
Gastric emptying
GE parameters were calculated using the [13C]octanoic acid breath test (13C-OBT)( Reference Ghoos, Maes and Geypens 42 ), using an identical procedure to that described previously( Reference Horner, Byrne and Cleghorn 32 ). In brief, the egg yolk of a standardised pancake breakfast meal (1676 kJ (400 kcal); 15 g (15 %) protein, 17 g (37 %) fat and 48 g (48 %) carbohydrate) was labelled with 100 mg [13C]octanoic acid (Cambridge Isotope Laboratories). Participants consumed the meal with a 250 ml water drink within 10 min. Breath samples were collected in 10 ml glass Exetainer tubes (Labco) before breakfast, immediately after, and subsequently every 15 min for 5 h. Participants remained in sedentary activities (reading or working on a computer) and were supervised in the laboratory throughout the test morning.
13C breath test analysis
13C enrichment of breath samples was measured by isotope ratio MS (Hydra 20-20; Sercon). Data were analysed according to the procedure described by Ghoos et al. ( Reference Ghoos, Maes and Geypens 42 ). To calculate the percentage of the 13C dose recovered, enrichment values were multiplied by the estimated total CO2 production (VCO2) for each individual. Following the procedure outlined by Ghoos et al. ( Reference Ghoos, Maes and Geypens 42 ), resting VCO2 was predicted from body surface area according to the method proposed by Shreeve et al. ( Reference Shreeve, Cerasi and Luft 43 ). Body surface area was calculated according to the method outlined by Haycock et al. ( Reference Haycock, Schwartz and Wisotsky 44 ). To determine the influence of the predicted VCO2 value on results, identical analyses were carried out using a constant value of measured VCO2 calculated during the RMR measurement. The conventional uncorrected time-based parameters (t lag and t 1/2), proposed by Ghoos et al. ( Reference Ghoos, Maes and Geypens 42 ), and the parameters latency time (t lat) and t asc, proposed by Schommartz et al. ( Reference Schommartz, Ziegler and Schadewaldt 45 ), were calculated. The r 2 coefficient between the modelled and raw data was accepted if r 2>0·9.
Statistical analysis
All parameters were tested for normality by the Shapiro–Wilk test. Data are expressed as means and standard deviations for normally distributed values, and as medians and 25th–75th percentiles for non-normally distributed values. Differences between groups were assessed by the t test and Mann–Whitney U test. Independent t tests were used to compare groups split by median values for body composition. Where appropriate, Pearson's or Spearman's correlations were used to determine the relationships between GE and key variables. Associations were further explored using partial correlations after controlling for group. To identify potential predictors of GE, variables of interest were included in multiple linear regression analysis, with GE t 1/2 and t lag as dependent variables. Variance inflation factor was checked for multicollinearity. Statistical analysis was performed using PASW Statistics version 18.0 (SPSS, Inc.) and Graph Pad Prism version 6.0 for Mac (GraphPad Software). Statistical significance was set at P< 0·05.
Results
Participant characteristics
All participants completed all the components of the study (n 22 per group), except for the accelerometry assessment, where there were invalid data for three participants in the inactive group. In the combined cohort, the percentage of FM and BMI ranged from 9 to 42 % and 21 to 36 kg/m2, respectively. BMI classified eight individuals as obese (n 7 inactive), fourteen as overweight (n 9 inactive) and twenty-two as normal weight (n 6 inactive). The descriptive characteristics of active and inactive groups are listed in Table 1. Participants in the active group reported taking part in various types of physical activity including aerobic exercise, resistance training, field sports and combinations of different modes of exercise. As expected, significant differences were found between the two groups for a number of characteristics. Measured RMR values were within 1 % (inactive) and 5 % (active) of the predicted values( Reference Harris and Benedict 46 ).
Table 1 Anthropometric, body composition, physical activity and energy expenditure characteristics of the study participants (Mean values and standard deviations; medians and 25th–75th percentiles; n 22 per group)

BSA, body surface area; FM, fat mass; FFM, fat-free mass; HR, heart rate; bpm, beats per min; AEE, activity energy expenditure; TEE, total energy expenditure.
* Physical activity data of nineteen participants in the inactive group.
Gastric emptying
Comparison of gastric emptying in the active and inactive groups
GE was significantly faster in the active group for all parameters (Table 2). The outcome measures of GE were identical regardless of the VCO2 value used (predicted or directly measured; data not shown).
Table 2 Gastric emptying parameters in the active and inactive groups (Mean values and standard deviations; medians and 25th–75th percentiles; n 22 per group)
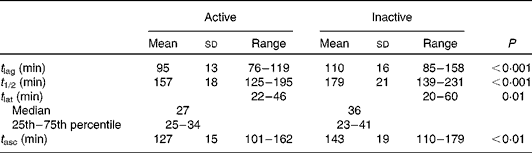
t 1/2, Half-time; t lag, lag time; t asc, ascension time; t lat, latency time.
Gastric emptying half-time in groups split by median body composition and BMI
To compare our findings with prior studies comparing GE in overweight/obese with normal-weight individuals classified by BMI, we compared GE t 1/2 between groups split by median BMI (25 kg/m2) and body composition values (Fig. 1). There were no significant differences between the low- and high-BMI groups (P= 0·17); however, GE was significantly faster in the high-FFM group and the low percentage of FM group (P= 0·01 and P< 0·01, respectively; Fig. 1).

Fig. 1 Gastric emptying half-time (t 1/2) for low/high BMI, fat mass (FM) and fat-free mass (FFM) groups based on median split values of 25 kg/m2 (BMI), 20 % (percentage of FM; %FM) and 67 kg (FFM) in pooled data from the whole cohort. Descriptive characteristics were BMI (low: 23 (sd 1) kg/m2; high: 29 (sd 3) kg/m2), %FM (low: 12 (sd 3); high: 28 (sd 6) %) and FFM (low: 58 (sd 4); high: 73 (sd 5) kg). Values are means (n 22 per group), with their standard deviations represented by vertical bars. ** Mean value was significantly different from that of the high percentage of FM group (P< 0·01). † Mean value was significantly different from that of the low FFM group (P= 0·01).
Cumulative percentage of the dose recovered
There were no significant differences in the cumulative percentage of the dose recovered between the groups, except for a small significant difference when divided by the median percentage of FM (FM >20 %, 43 %; FM < 20 %, 41 %; P< 0·05). Adjusting for respiratory quotient did not influence the outcomes for any comparisons between the active and inactive groups or groups in Fig. 1.
Relationships between variables and determinants of gastric emptying
Simple correlation analysis between variables
When the data from the two groups were pooled (n 44), age was positively correlated with t lag (r 0·32, P< 0·05). Although BMI was not associated with GE, body composition was associated with several parameters. The GE variable t lag was associated with the percentage of FM (r 0·50, P< 0·01), absolute FM (r 0·46, P< 0·01) and absolute FFM (r − 0·32, P< 0·05), while t 1/2 was associated with the percentage of FM (r 0·39, P< 0·01), absolute FM (r 0·35, P< 0·05) and absolute FFM (r − 0·29, P= 0·05).
RMR was not associated with GE. However, AEE was negatively correlated with t asc (r − 0·32, P< 0·05), t lat (r − 0·37, P< 0·05) and t 1/2 (r − 0·46, P< 0·01; Fig. 2). The average time spent in vigorous activity per d was also negatively correlated with t asc (r − 0·35, P< 0·05), t lat (r − 0·50, P< 0·01), t lag (r − 0·53, P< 0·01) and t 1/2 (r − 0·46, P< 0·01). Similar negative correlations were observed between average time spent in moderate activity per d and GE variables (t lag: r − 0·42, P< 0·01; t 1/2: r − 0·41, P< 0·01). These correlations collectively indicated that a higher amount of time spent and energy expended in physical activity were associated with faster GE.

Fig. 2 Scatter plot of the relationship between activity energy expenditure (AEE) and gastric emptying half-time (t 1/2) (r − 0·46, R 2 0·209, P< 0·01) in the active and inactive groups (n 41).
Partial correlations controlling for activity
Partial correlations of relevant variables with GE in the pooled data (n 44) were performed by controlling for group (Table 3). Significant associations between adiposity and GE were then no longer evident, whereas associations between age and GE t lag and between AEE/TEE and GE remained significant (Table 3).
Table 3 Partial correlations of age, body composition, resting metabolism and energy expenditure variables with gastric emptying lag time and gastric emptying half-time after controlling for group (active or inactive; n 44)
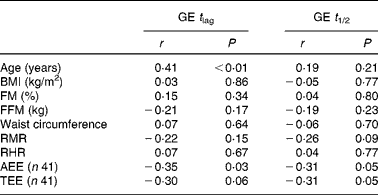
FM, fat mass; FFM, fat-free mass; RHR, resting heart rate; AEE, activity energy expenditure; TEE, total energy expenditure.
Multiple regression analysis
When considering age, percentage of FM, activity and FFM as independent variables, activity status (active or inactive) was the only significant predictor of GE t 1/2 (model adjusted R 2 0·25, β = − 0·51, P< 0·01). In addition, AEE was a significant independent predictor of GE t 1/2 (β = − 0·40, P< 0·01). As there was no evidence of strong multicollinearity between AEE and activity status (variance inflation factor 1·2), these variables were included in the same model. Together, AEE and activity status accounted for the greatest variance of GE t 1/2 (model adjusted R 2 0·34, P< 0·001; activity: β = − 0·45, P< 0·01; AEE: β = − 0·28, P= 0·05).
For GE t lag, activity status and AEE together explained 31 % of the variance (model adjusted R 2 0·31, P< 0·001; activity: β = − 0·37, P= 0·01; AEE: β = − 0·33, P= 0·03). Percentage of FM and FFM were not significant predictors of t lag. However, the inclusion of age increased the model adjusted R 2 value to 0·38 (P< 0·01).
Discussion
Although GE has long been implicated in the pathogenesis of obesity, findings have been inconclusive, perhaps because of the influence of additional factors such as habitual physical activity levels of participants. The findings from the present study provide evidence that GE is faster in habitually active compared with inactive males, that greater time spent in physical activity and AEE is associated with faster GE, and that body composition, but not BMI, is associated with GE. Although two studies that previously investigated GE in active and inactive individuals reported faster GE in active individuals( Reference Carrio, Estorch and Serra-Grima 25 , Reference Shimamoto, Hirata and Hiraike 47 ), neither controlled for EE and body composition. The present study has involved a larger sample size, with a wider range of body compositions and activity modes, and has characterised EE, FM and FFM.
The results suggest that differences in physical activity level and associated differences in body composition (FM and FFM) and AEE between individuals may represent one explanation for the inconsistent outcomes of previous studies examining GE in obesity( Reference Wright, Krinsky and Fleeman 6 – Reference Mathus-Vliegen, Leeuwen and Roolker 8 , Reference Jackson, Leahy and McGowan 10 , Reference Vazquez Roque, Camilleri and Stephens 13 – Reference Horowitz, Collins and Cook 15 , Reference Seimon, Brennan and Russo 48 ). Recently, Seimon et al. ( Reference Seimon, Brennan and Russo 48 ) comprehensively assessed GE and other postprandial responses in normal-weight, overweight and obese males classified by BMI, and reported no differences in the GE of a nutrient drink between the groups. However, body composition and EE were not reported. In the present study, the data from the two groups were pooled and split by median BMI (25 kg/m2) and body composition values, in order to allow comparison with previous studies. GE did not differ significantly between the groups split by BMI, but was faster in males with a lower percentage of FM and higher FFM. Previous limited evidence has shown somewhat similar findings regarding relationships between body composition and GE( Reference Mathus-Vliegen, Leeuwen and Roolker 8 ). In addition, we examined the associations between EE and GE. While there was no association between resting EE and GE, a higher amount of time spent in physical activity and higher AEE were associated with faster GE. These data are compatible with a hypothesis that appetite signals arising from the gastrointestinal tract may be more related to AEE than to RMR( Reference Blundell, Caudwell and Gibbons 49 ). Collectively, the findings demonstrate that a higher AEE, lower percentage of FM and higher FFM (but not BMI or RMR) are associated with faster GE in males.
Whereas a number of previously observed associations, including between adiposity and GE, were no longer evident after controlling for activity status (active or inactive), the associations between AEE, age and GE remained. Furthermore, the multiple regression analyses indicated that differences in body composition or BMI did not explain the faster GE observed in active individuals. Of the variables measured, habitual activity status and AEE accounted for the greatest variance in GE in males. These findings suggest that in the absence of differences in physical activity, GE may not be altered in obese individuals. Interestingly, others have shown that associations between body composition and eating frequency are mediated by physical activity( Reference Duval, Strychar and Cyr 41 ).
The present findings have a number of possible interpretations and implications in relation to appetite control and weight management. Interactions between EE and energy intake have long been of interest in the study of energy balance. Indeed, 60 years ago (in this journal), Edholm et al. ( Reference Edholm, Fletcher and Widdowson 50 ) proposed that differences in food intake originate from differences in EE. Our findings of faster GE in active individuals and in those with higher AEE are counter-intuitive to the argument that faster GE and hence reduced gastric distension contributes to overconsumption and obesity( Reference Wright, Krinsky and Fleeman 6 , Reference Hunt, Cash and Newland 9 ). However, although faster GE may lead to an earlier onset of the next meal through reduced gastric distension, the influence of GE on intestinal factors must also be considered. The rate of GE plays an important role in the delivery of nutrients to the intestine( Reference Janssen, Vanden Berghe and Verschueren 29 ) and hence in the release of intestinal satiation peptides( Reference Steinert, Meyer-Gerspach and Beglinger 30 , Reference Pilichiewicz, Chaikomin and Brennan 51 ) including cholecystokinin( Reference French, Murray and Rumsey 52 ), glucagon-like peptide-1( Reference Schirra, Katschinski and Weidmann 53 ) and peptide YY( Reference Vazquez Roque, Camilleri and Stephens 13 ). Meyer-Gerspach et al. ( Reference Meyer-Gerspach, Wolnerhanssen and Beglinger 16 ) recently demonstrated slower GE rates in obese individuals along with reduced postprandial glucagon-like peptide-1 and peptide YY secretion, reduced ghrelin suppression and reduced satiation compared with normal-weight individuals. It was suggested that the slower delivery of nutrients to the intestine could contribute to the blunted release of gut peptides and hence overconsumption( Reference Meyer-Gerspach, Wolnerhanssen and Beglinger 16 ). Perhaps the faster GE that we observed in active individuals could lead to an earlier activation of intestinal satiety signals in response to food intake, and could mean that appetite is better regulated in response to intestinal satiety signalling between meals. Faster GE could be one contributing mechanism to an improved sensitivity of appetite control( Reference Long, Hart and Morgan 31 ) and ‘gross’ physiological regulatory control of energy intake( Reference King, Tremblay and Blundell 54 ), arising from increased AEE and physical activity. Conversely, in inactive individuals, slower GE could have a role in predisposing to weight gain and a ‘dysregulation’ of appetite with inactivity( Reference Blundell 55 ) through a delayed or reduced release of gut peptides from the intestine that are involved in signalling satiety( Reference Jackson, Leahy and McGowan 10 , Reference Meyer-Gerspach, Wolnerhanssen and Beglinger 16 ), and could mean that other factors such as sensory cues or social values may be more likely to influence food intake.
Although differences in GE between active and sedentary individuals could also be a consequence of different habitual dietary intakes( Reference Harris, Lindeman and Martin 56 ), it is not possible to determine the causal nature of this association from cross-sectional studies and this requires additional longitudinal assessments. A slower GE might also be secondary to weight gain( Reference Maddox, Horowitz and Wishart 14 ) with inactivity. However, the present results suggest that associations between body composition and GE are mediated by physical activity. Other mechanisms previously proposed to contribute to faster GE in active individuals include enhanced parasympathetic tone( Reference Carrio, Estorch and Serra-Grima 25 ) and gastric electroactivity( Reference Shimamoto, Hirata and Hiraike 47 ). In the present study, active males had a significantly lower resting heart rate consistent with higher levels of parasympathetic tone( Reference Lauer 57 ). Hormonal factors may also have a mechanistic role. Fasting ghrelin( Reference Levin, Edholm and Schmidt 58 ), blood glucose( Reference Jones, Russo and Berry 59 ) and insulin sensitivity( Reference Kaji, Nomura and Tamura 60 ) can influence GE and are known to change in response to exercise training( Reference Boulé, Weisnagel and Lakka 61 , Reference Martins, Kulseng and King 62 ). Future characterisation of blood profiles may yield further information on the underlying mechanisms. In summary, while causal inferences cannot be drawn from the present study, the findings allow for an increased understanding of factors associated with GE. Additionally, they provide insight into processes potentially contributing to meal-to-meal appetite control and energy balance with habitual physical activity, and can be used to inform prospective studies examining the efficacy of targeting GE for weight management.
It is important to acknowledge some methodological issues in the present study. The 13C-OBT has many advantages( Reference Ghoos, Maes and Geypens 42 ), and has been shown to be unaffected in various medical conditions( Reference van de Casteele, Luypaerts and Geypens 63 , Reference Keller, Andresen and Wolter 64 ). However, unlike scintigraphy, the 13C-OBT does not permit direct imaging of gastric function, and emptying times are longer than those using scintigraphy. Although it is possible that various factors including VCO2 predictions and respiratory quotient may influence the recovery of 13C, the present analyses suggest that these factors are unlikely to have affected the results. Moreover, reports of both faster and slower GE in obese individuals using both the 13C-OBT( Reference Jackson, Leahy and McGowan 10 , Reference Cardoso-Júnior, Gonzaga Vaz Coelho and Savassi-Rocha 65 ) and scintigraphy( Reference Wright, Krinsky and Fleeman 6 , Reference Maddox, Horowitz and Wishart 14 , Reference Horowitz, Collins and Cook 15 ) have indicated that the method used is unlikely to bias the results for GE. A limitation of accelerometers placed on the hip in detecting upper body exercise may have underestimated activity in active individuals. Nevertheless, the ActiGraph accelerometer has been demonstrated to reasonably correlate with EE measured by doubly labelled water( Reference Plasqui and Westerterp 66 ). Finally, it should also be noted that only males were included so that sex and phase of the menstrual cycle were not confounding factors.
In conclusion, our findings show that GE is faster in habitually active males, and a greater time spent in physical activity and greater AEE are associated with faster GE. These results highlight the importance of considering body composition and physical activity level in studies examining GE (and parameters influenced by GE). Further investigations are needed to explore the possibility that GE contributes to a gross physiological regulation (or dysregulation) of appetite and food intake at different levels of physical activity. The potential therapeutic implications of physical activity for certain patient populations, such as those with gastroparesis, who have been characterised by low EE( Reference Homko, Zamora and Boden 67 ) are also relevant for future work. These findings help improve the understanding of factors that influence variability in GE, and may have relevance to both researchers and clinicians working in gastroenterology, nutrition and obesity.
Acknowledgements
The authors are grateful to Connie Wishart for her laboratory assistance and to all of the participants in the study.
The present study was supported by a Queensland University of Technology Postgraduate Research Award.
The authors' contributions are as follows: K. M. H., N. M. B., G. J. C. and N. A. K. contributed to the design of the study; K. M. H. collected the data, analysed the data and drafted the manuscript; N. M. B., G. J. C. and N. A. K. contributed to the data analysis and critical revision of the manuscript. All authors read and approved the final manuscript.
The authors declare that they have no conflicts of interest.


