


1. Introduction
The 3980 km3 Devon Ice Cap (DIC) in the Canadian Arctic is among the largest of Earth’s ice caps, and forms a significant fraction of all land ice volume that lies beyond the Antarctic and Greenland ice sheets. While DIC’s geographical location has exposed it to a range of climatic conditions (Reference PatersonPaterson and others, 1977; Reference DowdeswellDowdeswell and others, 1997), general circulation models (Reference Church, Gregory and HoughtonChurch and Gregory, 2001) consistently predict continued warming throughout the coming century. Moreover, recent studies (Reference Braun, Hardy and BradleyBraun and others, 2004) have shown that fluctuations in the mass of the world’s smaller ice bodies will constitute the greatest cryospheric component of future sea-level rise, so a knowledge of the present state of balance of DIC is a subject of considerable interest (Reference Burgess and SharpBurgess and Sharp, 2004).
Persistent monitoring of the DIC surface mass balance began in the early 1960s with sparse (~10–2 sites km–2) field surveys of accumulation and other parameters (Reference KoernerKoerner, 1966). More recently, a change in the ice-cap volume has been reported (Reference AbdalatiAbdalati and others, 2004) based on repeat sorties of an airborne laser altimeter, and an estimate of the DIC surface mass balance has been produced (Reference Mair, Burgess and SharpMair and others, 2005) using accumulation data from eight boreholes and a model of ablation. From these surveys, it was concluded that the ice cap lost 0.8 km3 of ice each year between 1995 and 2000, and 1.6±0.7km3 a–1 over the longer period 1963–2000. Another study (Reference Burgess, Sharp, Mair, Dowdeswell and BenhamBurgess and others, 2005) used satellite interferometric synthetic aperture radar (InSAR) and other data to estimate the rate of mass loss due to iceberg calving between 1960 and 1999, and concluded the ice cap was losing 0.57±0.12km3 of ice each year through glacier outflow. Although separate studies, these works put the long-term (30 year) mass balance of DIC at about –2.2±0.7 Gt a–1, a loss sufficient to raise global sea levels by 0.006 mma–1. Here, we use InSAR measurements of ice discharge, in situ records of snow accumulation, and a positive degree-day model of summer ablation, to reach a new, absolute estimate of the DIC mass balance.
2. Data
We use European Remote-sensing Satellite (ERS) synthetic aperture radar (SAR) data recorded during the tandem-repeat phase to produce repeat-pass interferograms from two separate satellite ground tracks. No ERS data were recorded during descending orbits at DIC, so we used data from ascending orbits only (their trajectory is shown in Fig. 1a). The distribution of our SAR dataset allowed us to form interferograms with temporal baselines of 1 or 35 days in spring 1996 (Table 1); data were not available for other time periods. The width of the SAR images was ~100 km, so it was necessary to mosaic data from two adjacent ERS tracks in order to survey the entire DIC.
(a) Ice speed (greyscale in ma–1) of DIC measured in spring 1996 from 1 day repeat-pass InSAR. Dotted white lines mark the boundaries of the major drainage basins (numbered as in Table 2), where mass flux was determined through gates bisecting glacier flows near to their termini. Ice surface elevation contours are shown in black. White triangles mark a northwestern traverse along which field measurements of ice motion were recorded. Also shown are the trajectories of the satellite heading (H) and the satellite look direction (L). (b) Snow accumulation (greyscale in ma–1) derived (see text) from a collection of in situ measurements distributed across the ice-cap centre, and meteorological records at sea level. (c) Runoff (greyscale in ma–1) derived (see text) from a PDD model of ablation and estimated accumulation (b). The modelled equilibrium line is also shown (bold, dotted line). Areas of no data are shown in black.

ERS-1/-2 data used in this study. SD: single difference; DD: double difference

2.1. InSAR DEM
Although a recent airborne survey has provided models of the DIC surface and bedrock elevations (Reference Dowdeswell, Benham, Gorman, Burgess and SharpDowdeswell and others, 2004), their ~1 km horizontal resolution is lower than that required for InSAR processing. Instead, we derived a new, fine spatial resolution digital elevation model (DEM) to facilitate our InSAR estimates of the ice-cap surface deformation, ice-flow direction and mass flux. We formed the DEM using differential interferograms from the two ERS tandem (1 day) pairs (Table 1). Their baselines were constrained (Reference Zebker, Werner, Rosen and HensleyZebker and others, 1994) with ground-control points (GCPs) of known elevation. The spatial resolution of the new InSAR DEM is 40 m, ~250 times finer than that of the airborne survey. To assess its accuracy, we re-sampled the InSAR DEM to the same ground resolution as the airborne DEM, and the root-mean-square (rms) deviation between the two models was 18 m. This was comparable to the precision of the airborne dataset, so we conclude that the two elevation models were indistinguishable.
2.2. Ice surface velocity
We used InSAR to measure the DIC surface displacement in the look direction of the SAR sensor (e.g. Reference Joughin, Kwok and FahnestockJoughin and others, 1996; Reference Shepherd, Wingham, Mansley and CorrShepherd and others, 2001) from data recorded during ascending orbits only (Table 1). In the absence of data from alternate viewing geometries, it was necessary to make assumptions as to the ice-flow direction in order to derive estimates of the ice velocity. As a common practice, we adopted the assumption of surface-parallel ice flow (Reference Kwok and FahnestockKwok and Fahnestock, 1996). By subtracting a model of the interferometer phase due to topography, we obtained the signal due to surface displacement (Reference Goldstein, Engelhardt, Kamb and FrolichGoldstein and others, 1993). To minimize the error due to non-parallel flow, we calculated the direction of maximum slope from a smoothed version of the InSAR DEM, averaged horizontally over a distance equal to ten times the ice thickness. In this way, the effects of short-scale variations in surface topography were eliminated. We determined the DIC ice-flow velocity in April and May 1996 (Table 1; Figs 1a and 2).
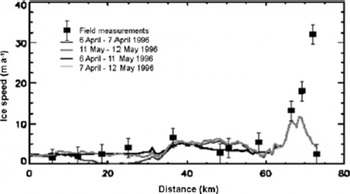
Ice velocity determined along a profile of DIC extending from the summit to the ice-cap margin. The profile bisects the field measurement locations shown in Figure 1a. Filled squares are annual velocity measurements recorded as the motion of stakes on the ice-cap surface between 1999 and 2001. Grey lines are velocity measurements determined from four separate satellite radar interferograms of data recorded in spring 1996. Coherence is lost in radar interferograms formed over 35 day periods at speeds greater than ~5ma–1. There is no significant variation in ice-flow rates during the ~1 month period of the satellite measurements.
Errors in estimating the interferometer baseline, and our potentially inaccurate prescription of the ice-flow direction, will affect the accuracy of ice velocity data. After applying the GCPs, we estimated the error due to baseline uncertainties by considering the interferometer phase in areas of exposed bedrock. The standard deviation of the interferometer phase was 2.7 rad, corresponding to a velocity uncertainty of 3.8ma–1. The residual signal due to uncompensated vertical motion (after applying a slope correction (Reference Joughin, Kwok and FahnestockJoughin and others, 1996)) is difficult to estimate. Comparison of velocity results with and without corrections for vertical velocity led to erroneous short-scale variability, and the mean deviation was 4.7 ma–1. Assuming half of this variability remains after applying the correction, the combined estimate of velocity errors was 4.5 ma–1. Finally, because the InSAR observations are sensitive to the SAR look direction, estimates of ice velocity in areas where the flow direction was within 5˚ of the SAR ground track direction were discarded (about 5% of all data).
The InSAR data record springtime velocity at DIC, and the maximum rate of flow measured was 175 ma–1 at the terminus of a glacier flowing into Croker Bay (73.57˚ N, 82.92˚ W). We compared the satellite observations to a set of field measurements recorded between 1999 and 2001 at 23 stakes located along a northwestern traverse of DIC (see Fig. 1a). Stakes were positioned in April 1999, and resurveyed in April 2000 and April 2001. Their locations were recorded using standard differential global positioning system (GPS) surveying techniques. On average, the difference between the 1999–2001 annual velocity measurements and those derived from InSAR in spring 1996 was only 5%, within the relative precision of the two datasets. However, there were five stakes located in the ablation zone near to Sverdrup Glacier (75.67˚ N, 83.25˚ W) where flow speeds exceed 50ma–1. At these locations, the average difference between annual and springtime velocities was 16%, exceeding the measurement error at all fast-flowing locations (Fig. 2).
3. Mass Balance
Several approaches have been used to determine ice mass balance in glaciology. The approach we consider here is commonly referred to as the mass-budget method (e.g. Reference Rignot, Gogineni, Krabill and EkholmRignot and others, 1997). It compares mass accumulation in the interior with runoff and ice discharge across its boundary. The difference between these typically large values determines whether the ice body is losing or gaining mass.
3.1. Ice discharge
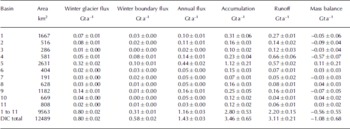
We calculated the ice discharge of DIC through flux gates close to the termini of all outlet glaciers (e.g. Reference Rott, Stuefer, Siegel, Skvarca and EckstallerRott and others, 1998) from the InSAR ice velocity mosaic and a model of the ice-cap thickness. Errors in this estimation were introduced by uncertainties in ice thickness, estimated to be accurate to within 10 m, and, to a lesser degree, by uncertainties in ice velocity, estimated to be 4.5 ma–1. The majority of ice discharge from DIC was through 11 fast-flowing glacier systems, and we determined the mass flux across gates near to the termini of each of these outlets (Table 2). The greatest outflows were at two unnamed glaciers (basin 5) to the southeast of DIC, and their total mass transport was 0.32±0.02 Gt a–1, 73% of the glacier flux from basin 5. In spring 1996, the total rate of ice discharge from DIC glaciers was 0.80±0.02 Gt a–1 (Table 2).
Drainage basins, boundary flow, accumulation, runoff and ice mass balance of DIC. Drainage basins 1–11, as defined in Figure 1, comprise 77% of the ice-cap area. Mass balance is calculated as the summation of accumulation (+), annual boundary flow (–) and runoff (–)
Phase noise and incoherence in the InSAR dataset prevented us from marking the absolute terminus of each outlet glacier, and because of this there was a measure of ice mass transport in slow-moving sectors of the ice sheet proximal to each gate. We marked a boundary just inland (a few km) of the ice-cap margin and adjacent to glacier flux gates to compute the ice export from adjacent, slow-moving sectors. Together, this boundary and the glacier flux gates (hereafter the DIC boundary) enclose 12 489 km2 of the main DIC, and form the limit of our mass-balance calculations. The mechanism of mass loss beyond the DIC boundary does not affect our calculation; we simply omit those regions and present the mass balance of the main ice cap. Our velocity data also exclude the 1980 km2 western arm, east of 84˚Wand south of 75˚ N, so our survey omits ~15% of the ice covered area.
Old ground-based measurements of glacier velocity at DIC (Reference Cress and WynessCress and Wyness, 1961) show strong seasonal variations, and we observe a similar difference between the InSAR and field measurements in this study, which survey different time periods. Our estimates (see section 3.3) of summer melting at DIC show that surface waters, which are often presumed to affect glacier speed (e.g. Reference Zwally, Abdalati, Herring, Larson, Saba and SteffenZwally and others, 2002), are present between June and August. In 1996, melting was first detected on 9 June at sea level, so we conclude that our InSAR estimates of ice motion (recorded before 25 May) are representative of the winter velocity minima. To estimate the rate of annual ice discharge, we determined an empirical relationship between the InSAR spring velocities and the mean annual rate of ice flow, based on in situ observations of annual speeds and a hypothesis of summertime acceleration. This adjustment is applied to the fast-flowing outlets only. We suppose that the annual velocity distribution is bimodal, with enhanced flow for the duration of each summer at a rate that equals a constant multiple of the winter value. In this simple model (Equation (1)), the mean annual ice velocity  varies according to the winter velocity (v
w) and the melt season duration (d) via the summertime enhancement factor (f ) which we determined empirically to be 1.6±0.4. This value is comparable to the ratio of summertime and springtime velocities (1.8) recorded at Sverdrup Glacier in 1961 (Reference Cress and WynessCress and Wyness, 1961). Using Special Sensor Microwave/Imager data (unpublished), we estimate that between 1998 and 2002 the summer melting season on DIC was, on average, 40± 16 days long. With these parameters, our model predicts that mean annual glacier velocities at DIC are, on average, 6.5±3.1% greater than winter values.
varies according to the winter velocity (v
w) and the melt season duration (d) via the summertime enhancement factor (f ) which we determined empirically to be 1.6±0.4. This value is comparable to the ratio of summertime and springtime velocities (1.8) recorded at Sverdrup Glacier in 1961 (Reference Cress and WynessCress and Wyness, 1961). Using Special Sensor Microwave/Imager data (unpublished), we estimate that between 1998 and 2002 the summer melting season on DIC was, on average, 40± 16 days long. With these parameters, our model predicts that mean annual glacier velocities at DIC are, on average, 6.5±3.1% greater than winter values.

Using the wintertime ice outflow across the slow-moving sectors of the DIC boundary (Table 1) and our model of the seasonal velocity variations (Equation (1)) to predict the annual fast-flowing glacier outflow, we estimate the average annual DIC outflow is 1.43±0.03 Gt a–1. This value is ~4% larger than the combined winter outflow. More detailed summertime velocity data are required to clarify the exact nature of the seasonal fluctuation we have recorded here.
3.2. Snow accumulation
Field measurements (Reference KoernerKoerner, 1966) recorded during the 1960s show that the average winter snow depth across a 5127 km2 sector of DIC was equivalent to 23 cm of water (cmw.e.), and that summer accumulation added a further ~10% to this value (Reference KoernerKoerner, 1970). Since then, winter snow depth at an annually sampled northwestern traverse has barely fluctuated, with a 40 year mean value of 11±2 cmw.e. (Reference Haeberli, Hoelzle, Suter and FrauenfelderHaeberli and others, 1998) and similar rates (11±3 cmw.e.) for the periods 1962, 1963, 1965 and 1988–2002, during which spatially extensive measurements exist. We adopt the spatially extensive accumulation data (Reference KoernerKoerner, 1966) and characterize their temporal variability from that of the 40 year dataset (Reference Haeberli, Hoelzle, Suter and FrauenfelderHaeberli and others, 1998). These data, however, span only the central region (about 50%) of DIC, and provide no coverage of the ice-cap perimeter. To augment these data, we derived estimates of spring snow depth from the ten meteorological stations surrounding DIC that meet World Meteorological Organization (WMO) standards for climatology (Environment Canada, http://www.climate.weatheroffice.ec.gc.ca/climateData/canada_e.html), and interpolated the combined dataset onto a regular grid (Fig. 1b). The resulting accumulation model agrees well with estimates derived from eight ice cores drilled on the central ice cap (Reference Mair, Burgess and SharpMair and others, 2005), and the rms difference in the annual accumulation rate determined from the independent datasets was 52 mmw.e. a–1. From our combined dataset, we estimate that the average annual accumulation rate within the DIC boundary was 3.46±0.65 Gt a–1 (Table 2).
3.3. Water runoff
We simulated runoff in 1996 (the year of our velocity data) from DIC using a positive degree-day (PDD) model (Reference ReehReeh, 1991). To drive this model, we used sea-level temperature data from the International Arctic Buoy Program (IABP) database (Reference Rigor, Colony and MartinRigor and others, 2000) at nine locations surrounding DIC, and in situ temperatures recorded at an automatic weather station (AWS) sited near to the ice-cap summit (1900m elevation) (Reference KoernerKoerner, 2005). We determined an atmospheric lapse rate of –4.575˚Ckm–1 from these records, and modelled the number of PDDs across the ice cap from the IABP dataset and our DEM of the surface elevation. For the Greenland ice sheet, melting factors are generally assumed to be 3mmw.e.PDD–1 for snow and 8mmw.e.PDD–1 for ice (Reference BraithwaiteBraithwaite, 1995). Although higher PDD factors (up to 14mmw.e.PDD–1) have been estimated (Reference Mair, Burgess and SharpMair and others, 2005) for individual sectors of DIC, when compared to other empirically derived estimates, these appear excessive, and our analysis of the IABP database suggests that they may be affected by an underestimate of the degree of melting in this region. For instance, sea-level temperatures to the southeast of DIC are consistently 2˚C warmer than those to the northwest, leading to summer melting seasons that are, on average, 32 days longer in Baffin Bay (109±8 days) than those north of Sverdrup Glacier (77±7 days). In the absence of more detailed in situ measurements, we make no attempt to derive empirical degree-day factors here, and we adopt standard values of Reference BraithwaiteBraithwaite (1995) for ice- and snowmelting. However, while the melting factors of Reference Mair, Burgess and SharpMair and others (2005) are 25–40% higher than those we adopt here, the annual degree-day total at Sverdrup is 30% lower than that at Baffin Bay, so it seems likely that the two models will concur within the bounds of experimental error. Using the PDD values of Reference BraithwaiteBraithwaite (1995), we estimate (see Fig. 1c) that runoff from the DIC surface in 1996 was 3.11±0.21 Gt a–1.
3.4. Net mass balance
The net mass balance of the main DIC is the difference between the accumulation and the sum of annual boundary flow and the total runoff from the ice-cap surface. Based on our estimates of these quantities, we are able to conclude that at present DIC is losing mass at a rate of 1.08± 0.66 Gt a–1 (Table 2). A more detailed inspection, however, reveals a marked geographical trend. Many basins (e.g. basins 2–7) in the southeastern sector of DIC are losing mass, whereas those to the northwest (basins 10–11) are gaining mass. This result is in qualitative agreement with the conclusions of a recent study of the surface mass balance (Reference Mair, Burgess and SharpMair and others, 2005), since both reveal mass gains in the northwest, although there is a substantial difference in the overall mass trend. A direct comparison can only be made between the sum of surface mass balance and glacier discharge, that is a combination of the Reference Burgess, Sharp, Mair, Dowdeswell and BenhamBurgess and others (2005) and Reference Mair, Burgess and SharpMair and others (2005) trends. Together, those studies suggest DIC has lost 2.17±0.71 Gt a–1. While this value agrees with our estimate within error bounds, the central values are a factor of two apart.
4. Discussions and Conclusions
A new velocity map derived from InSAR data shows that DIC is drained through a network of 11 major glacier systems. Whilst the fastest rate of flow is along a narrow outlet at the southwest of the ice cap, the greatest mass transport drains through three broad southeastern glaciers that converge near Philpots Island (74.9˚ N, 80.0˚ W). These glaciers, and others of DIC, flow at rates greatly exceeding those due to gravitational creep deformation – typically <2ma–1 – and are presumably enhanced by some other mechanism that provides spatial variations in glacier traction. Field measurements suggest that there is a near-twofold increase in ice-flow speeds during summer months, a change that we hypothesize is related to seasonal variations in glacier lubrication. Accounting for this increase, the annual ice discharge is, on average, 7% greater than during the winter quiescent period.
We find that the main DIC is presently losing mass at a rate of 1.08±0.66 Gt a–1, equivalent to a global sea-level contribution of +0.003mma–1 or 31% of the mean annual accumulation rate. This value is half that of an estimate based on the results of two past studies (Reference Burgess, Sharp, Mair, Dowdeswell and BenhamBurgess and others, 2005; Reference Mair, Burgess and SharpMair and others, 2005) which considered partial components of the mass budget, albeit within allowed error bounds. Since the study areas considered were not dissimilar, it appears that the departure is related to experimental methods. We suggest that the most likely source of difference lies in the assessment of surface mass balance. Although our estimates of snow accumulation and water runoff consider both altitudinal and geographical trends associated with climatic gradients, the results of earlier studies (Reference Mair, Burgess and SharpMair and others, 2005) are of insufficient detail to make a useful or meaningful comparison. Nonetheless, there is good evidence (Reference KoernerKoerner, 1966) to suggest that katabatic winds redistribute snowfall in an asymmetric manner, and that rates of melting in the southeastern sector are governed by temperature gradients (Reference Rigor, Colony and MartinRigor and others, 2000) and not locally high ablation factors. Of course, in the absence of more detailed in situ measurements, it is equally possible that this and earlier estimates of the DIC mass balance concur.
Because the field data (Reference KoernerKoerner, 1966; Reference Haeberli, Hoelzle, Suter and FrauenfelderHaeberli and others, 1998) show that there has been no significant variation in snow accumulation over the past 40 years, and because the velocity data (Reference Cress and WynessCress and Wyness, 1961) show a seasonal variation, it seems reasonable to suppose that any future increase in the DIC temperature will exacerbate today’s rate of attrition. It would not only lead to increased rates of ablation, but it may also accelerate glacier ice discharge (e.g. Reference Zwally, Abdalati, Herring, Larson, Saba and SteffenZwally and others, 2002). While it is possible that the growth of the northwestern DIC reflects a delayed ice-dynamic response to the cooler conditions (Reference FisherFisher and others, 1998) that prevailed during the Little Ice Age, it seems certain that the remainder of the ice cap is already out of balance with contemporary accumulation rates. The data do, therefore, support the notion that projected trends in climate warming during the 21st century provide clear mechanisms for rapid fluctuations in the grounded ice mass of the Arctic region.
Acknowledgements
This research was supported by the UK Natural Environment Research Council Centre for Polar Observation and Modelling. We thank the European Space Agency Vectra consortium for provision of ERS data, and I. Joughin for helpful comments on the manuscript.



