


1. Introduction
Wind waves are generated by winds blowing over the air–water interface. A great number of studies have been published investigating the effects of wind waves on momentum, heat and mass transfers between the ocean and the atmosphere, which strongly affect the local and global weather and climate. In particular, the mass transfer across the air–water interface is an important issue for climate change studies because it is related to the air–sea CO $_2$ transfer (Wanninkhof et al. Reference Wanninkhof, Asher, Ho, Sweeney and McGillis2009). The study of the growth of wind waves also has a long history. The pioneering works on the theoretical aspect of the wind-wave growth were by Phillips (Reference Phillips1957) and Miles (Reference Miles1957), and the understanding has been updated by a large number of analytical, experimental and numerical studies, including recent studies, e.g. Grare et al. (Reference Grare, Peirson, Branger, Walker, Giovanangeli and Makin2013), Paquier, Moisy & Rabaud (Reference Paquier, Moisy and Rabaud2015, Reference Paquier, Moisy and Rabaud2016), Zavadsky & Shemer (Reference Zavadsky and Shemer2017), Perrard et al. (Reference Perrard, Lozano-Durán, Rabaud, Benzaquen and Moisy2019), Buckley, Veron & Yousefi (Reference Buckley, Veron and Yousefi2020) and Wu & Deike (Reference Wu and Deike2021). Sullivan & McWilliams (Reference Sullivan and McWilliams2010) and Wu & Deike (Reference Wu and Deike2021) reviewed and introduced the literature. While most published studies have considered wind waves on uncontaminated sea water or fresh water with constant surface tension, some studies have discussed the effects of surfactants on the wind-wave structure and have shown that wind waves are suppressed by the surfactants in water (Scott Reference Scott1972; Mitsuyasu & Honda Reference Mitsuyasu and Honda1986). However, the detailed mechanism of the wind-wave suppression has not been confirmed. The mechanism of wind-wave suppression due to surfactants has been hypothesised based on the Marangoni effect. More specifically, the interface deformation is suppressed by the surface tension gradient on the interface, which is referred to as the Marangoni stress (e.g. Scott Reference Scott1972). Non-uniform surfactant concentration on the free surface causes non-uniform surface tension distribution because the surface tension decreases as the surfactant concentration increases. However, this hypothesis is not proven since the Marangoni stress cannot be measured directly.
Furthermore, even in the case where surfactants are distributed uniformly on the free surface, the effect of uniform reduction of surface tension on the growth of wind waves remains unclear. Kawai (Reference Kawai1979) discussed the cause of increase of the critical wind speed for soap water, considering the effect of uniform surface tension reduction. Kawai concluded analytically that the critical wind speed does not change significantly when the surface tension is reduced to half the value of water. Tsai & Lin (Reference Tsai and Lin2004) suggested that uniform surface tension reduction increases the wind-wave growth rate based on linear stability analysis. However, this result can be applied only to the initial wave growth at very early stages. Zonta, Soldati & Onorato (Reference Zonta, Soldati and Onorato2015) investigated the growth of gravity–capillary waves driven by the shear at the air–water interface using three-dimensional numerical simulation, and showed that the initial wave growth is faster for a larger Weber number (smaller surface tension). However, they did not clarify the pure surface tension effect because they changed both Froude and Weber numbers. Recently, Wu & Deike (Reference Wu and Deike2021) investigated numerically the fundamental mechanism of the growth of gravity–capillary waves with a laminar wind profile, changing the Bond and Reynolds numbers. However, they considered wind waves whose amplitude was smaller than the viscous sublayer thickness. Therefore, their two-dimensional simulation results cannot be applied directly to three-dimensional air–water flows involving turbulent eddies.
In addition, the dependence of uniform surface tension reduction on the mass transfer across the air–water interface is a subject of interest. Previous studies showed that the mass transfer is dominated by turbulence beneath the air–water interface (Komori, Nagaosa & Murakami Reference Komori, Nagaosa and Murakami1993a; Komori et al. Reference Komori, Kurose, Iwano, Ukai and Suzuki2010). Veron & Melville (Reference Veron and Melville2001) showed that the effect of scalar transfer is affected by Langmuir circulations, which are streamwise vortices developing below a wind-sheared air–water wavy interface. In contrast, Takagaki et al. (Reference Takagaki, Kurose, Tsujimoto, Komori and Takahashi2015) performed direct numerical simulations (DNS) and concluded that the scalar transfer across a wind-driven air–water interface is mainly controlled by turbulent eddies, and the effect of the Langmuir circulations is relatively small. Recently, Tejada-Martínez et al. (Reference Tejada-Martínez, Hafsi, Akan, Juha and Veron2020) performed DNS and large-eddy simulations and reported that turbulence on the water side is triggered by the Langmuir forcing, whereas the intensity of the turbulence and the scalar transfer induced by the turbulence are driven by the wind shear. If the uniform surface tension changes the wave growth and the turbulence beneath the interface, then the mass transfer across the interface could be significantly affected by the surface tension.
This study aims to clarify the effects of uniform surface tension reduction on wind-wave growth and scalar transfer across the interface under a comparatively low wind speed condition of several metres per second, where intensive wave breaking does not occur. DNS of air–water two-phase flow are performed to investigate the effects of the surface tension reduction on the mechanism of the wave growth and air–water scalar transfer. In addition, the surface tension effects obtained by the DNS are discussed in Appendix A by comparing with the wave height measurements for aqueous solutions with different surface tensions in a small wind-wave tank.
2. Direct numerical simulations
2.1. Computational method
The governing equations for air and water flows are the continuity and Navier–Stokes equations for incompressible flows:
 $$\begin{gather} \frac{\partial U_i}{\partial x_i} = 0 , \end{gather}$$
 $$\begin{gather}\frac{\partial U_i}{\partial t} + U_j\,\frac{\partial U_i}{\partial x_j} ={-} \frac{1}{\rho}\,\frac{\partial p}{\partial x_i} + \nu\,\frac{\partial^2 U_i}{\partial x_j\,\partial x_j} - g \delta_{i3} , \end{gather}$$
where  $U_i$ is the velocity component in the $i$th direction, $p$ is the pressure, $\rho$ is the density, $\nu$ is the kinematic viscosity, and $g$ is the gravitational acceleration. Different values of $\rho$ and $\nu$ were used for air and water flows: $\rho =\rho _a$ and $\nu =\nu _a$ for the air flow, and $\rho =\rho _w$ and $\nu =\nu _w$ for the water flow. The air–water interface was tracked by the height function $\eta (x_1,x_2)$, which represents the horizontal distribution of the vertical interface position. The transport equation of $\eta$ is given by
 \begin{equation} \frac{\partial \eta}{\partial t} + U_1\,\frac{\partial \eta}{\partial x_1} + U_2\,\frac{\partial \eta}{\partial x_2} = U_3 . \end{equation}
The dynamical balances at the interface in the normal and tangential directions are given by
 $$\begin{gather} p_{w} - \tau_{nw} + p_{s} = p_{a} - \tau_{na}, \end{gather}$$
 $$\begin{gather}\tau_{tw} = \tau_{ta}, \end{gather}$$
where the subscripts  $a$ and $w$ represent the quantities in air and water, respectively. Here, $\tau _n$ and $\tau _t$ are the normal and tangential components of the viscous stress tensor on the interface, respectively; $p_s$ is the pressure gap due to the surface tension $\sigma$ and is given by $p_s=\sigma \kappa$, where $\kappa$ is the interface curvature. The definition of the curvature $\kappa$ is summarised in Appendix B. The transport equation of the non-dimensional passive scalar $C$ is given by
 \begin{equation} \frac{\partial C}{\partial t} + U_j\,\frac{\partial C}{\partial x_j} = D\,\frac{\partial^2 C}{\partial x_j\,\partial x_j}, \end{equation}
where  $D$ is the diffusion coefficient of the scalar.
The governing equations were solved using an arbitrary Lagrangian–Eulerian (ALE) method with boundary-fitted moving grids (Komori et al. Reference Komori, Nagaosa, Murakami, Chiba, Ishii and Kuwahara1993b, Reference Komori, Kurose, Iwano, Ukai and Suzuki2010). The grid points were allowed to move in the vertical direction following interface deformation, while they were fixed in the horizontal direction. The grid points on the interface moved along with the vertical interface motion, and the vertical positions of the other grid points on the air and water sides were updated at each time step, adapting to the interface height change. The governing equations described on the Cartesian coordinate were transformed to the equations on the generalized coordinate and solved in separated domains for air and water flows; i.e. the density and viscosity for each flow were constant at each grid point. The detailed formulation of the ALE method used here is described in Komori et al. (Reference Komori, Nagaosa, Murakami, Chiba, Ishii and Kuwahara1993b). The fifth-order upstream and fourth-order central finite difference schemes were adopted for the calculation of the advection and viscous terms, respectively. The velocity and pressure fields were coupled using the marker and cell (MAC) method. The time integration of each equation was calculated by the Euler implicit method. The reliability of the DNS code was confirmed using a comparison with laboratory experiment data (Komori et al. Reference Komori, Nagaosa, Murakami, Chiba, Ishii and Kuwahara1993b, Reference Komori, Kurose, Iwano, Ukai and Suzuki2010; Kurose et al. Reference Kurose, Takagaki, Kimura and Komori2016).
As the interface shape is represented by the height function  $\eta (x_1,x_2)$, the present DNS cannot consider the wave breaking with air entrainment or discontinuity of the surface slope. Occurrence of wave breaking can cause a numerical instability for (2.3). Deike and his colleagues (Deike, Popinet & Melville Reference Deike, Popinet and Melville2015; Deike, Melville & Popinet Reference Deike, Melville and Popinet2016; Mostert & Deike Reference Mostert and Deike2020; Wu & Deike Reference Wu and Deike2021) performed DNS of two-phase flows with water waves using the volume of fluid (VOF) method with adaptive mesh refinement. Wave breaking can be captured by the VOF method explicitly. Here, we use the ALE method with boundary-fitted moving grids because breaking waves are not targeted. It should also be noted that the DNS of boundary-fitted approach in previous studies (Yang & Shen Reference Yang and Shen2011; Zonta et al. Reference Zonta, Soldati and Onorato2015) used spectral methods for the spatial discretisation in the horizontal directions. The differentiations by finite difference schemes are less accurate than those by spectral methods for large wavenumbers, and the difference between the spectral and finite difference methods can be evaluated by the effective wavenumber $k_{eff}$ (e.g. Ferziger, Perić & Street Reference Ferziger, Perić and Street2020). For the case of the finite difference schemes used in the present DNS, we confirmed that the difference between the effective wavenumber $k_{eff}$ and the exact wavenumber $k$ is less than 5 % for $k \le 0.47 k_{max}$, where $k_{max}$ is the maximum wavenumber and $k_{max} \approx 6.28\times 10^3$ m $^{-1}$ for the present DNS. Therefore, the error in the present finite difference schemes is negligibly small for $k\lesssim 3.0\times 10^3$ m $^{-1}$.
2.2. Computational condition
Figure 1 shows a schematic diagram of the computational domain. The domain size was set to  $L_1=16\delta$, $L_2=3.84\delta$ and $L_3=3\delta$ in the streamwise ( $x_1$), spanwise ( $x_2$) and vertical ( $x_3$) directions, respectively, where $\delta$ was set to $1.25 \times 10^{-2}$ m. The initial interface was located $2\delta$ above the bottom, and this height was set to $x_3=0$. The number of grid points was set to 400 in the streamwise direction, 96 in the spanwise direction, and 180 in the vertical direction (60 points on the air side and 120 points on the water side). The uniform grid spacing was used in streamwise and spanwise directions; i.e. the streamwise position of the $m_1$th grid point is $x_g(m_1)=m_1 \Delta x_1$, and the spanwise position of the $m_2$th grid point is $y_g(m_2)=m_2 \Delta x_2$. The horizontal grid spacing is $\Delta x_1 = \Delta x_2 = 5.0 \times 10^{-4}$ m. In the vertical direction, the non-uniform grid spacing was adopted to set fine grids near the interface. As explained in the previous subsection, the vertical grid positions change depending on the interface height $\eta$; i.e. the vertical position of the $m_3$th grid point is given by $z_g(m_1,m_2,m_3)=-2\delta +\{\eta (x_g(m_1),y_g(m_2))+2\delta \}\,\zeta (M_w-m_3,M_w)$ for $m_3=0, \ldots, M_w$ (the water side and the interface), and $z_g(m_1,m_2,m_3)=\delta -\{\delta -\eta (x_g(m_1)$, $y_g(m_2))\}\,\zeta (m_3-M_w,M_a)$ for $m_3=M_w+1, \ldots, M_w+M_a$ (the air side), where $\zeta (m,M)=\tanh \{ \alpha (1 - m/M) \} /{\tanh \alpha }$, and $\alpha$ is the scaling constant ( $\alpha =2.8$). Here, $M_w$ and $M_a$ are the numbers of vertical grid points in the water and air sides, respectively. When the interface is flat, i.e. $\eta (x_1,x_2)=0$, the vertical position of the $m_3$th grid point is given by $z_{g0}(m_3)=-2\delta \{1-\zeta (M_w-m_3,M_w)\}$ for $m_3=0, \ldots, M_w$, and $z_{g0}(m_3)=\delta \{1-\zeta (m_3-M_w,M_a)\}$ for $m_3=M_w+1, \ldots, M_w+M_a$. The minimum vertical grid spacings were $9.0\times 10^{-6}$ and $8.8\times 10^{-6}$ m in the air and water sides, respectively. These were sufficiently small to resolve the viscous sublayer thickness $\delta ' \approx 5\nu /u_*$, which was $3.2\times 10^{-4}$ and $6.0\times 10^{-4}$ m for the air and water sides, respectively. The periodic boundary condition was applied to the velocity and pressure in the streamwise and spanwise directions, while the Neumann condition was applied in the vertical direction. A wall-bounded turbulent air flow had been developed for a flat and rigid surface until the velocity profile becomes a statistically steady state. The developed flow field was then used for the initial condition in the air side. The friction velocity on the air side was $u_{*a}\approx 0.24$ m s $^{-1}$. The corresponding free-stream wind speed was $U_\infty \approx 5.2$ m s $^{-1}$ based on the empirical relationship of Iwano et al. (Reference Iwano, Takagaki, Kurose and Komori2013). The water side was initially in static condition, and the initial displacement of the interface was set to zero. A constant pressure gradient was applied to the air side in the streamwise direction for the driving force. The time integration was calculated for 7 seconds. The air and water densities were set to $\rho _a=1.2\,{\rm kg}\,{\rm m}^{-3}$ and $\rho _w=1.0\times 10^{3}\,{\rm kg}\,{\rm m}^{-3}$, respectively, and the kinematic viscosities in the air and water sides were set to $\nu _a=1.5\times 10^{-5}\,{\rm m}^2\,{\rm s}^{-1}$ and $\nu _w=1.0\times 10^{-6}\,{\rm m}^2\,{\rm s}^{-1}$, respectively. The gravitational acceleration was set to $g=9.8\,{\rm m}\,{\rm s}^{-2}$. This study considers three cases of surface tension $\sigma$: (1) the case where the surface tension is equal to that of water ( $\sigma =1.0\sigma _w$), (2) the case where the surface tension is half that of water ( $\sigma =0.5\sigma _w$), and (3) the case where the surface tension is initially $\sigma =1.0\sigma _w$ and suddenly reduced to $\sigma =0.5\sigma _w$ at $t=4.0$ s. The surface tension of water was set to $\sigma _w=7.2\times 10^{-2}\,{\rm N}\,{\rm m}^{-1}$. We have confirmed the grid resolution dependence of the DNS results (Appendix C).

Figure 1. Schematic diagram of the computational domain and grids.
The friction Reynolds number is defined for each side of air and water using the friction velocity and the boundary layer thickness ( $\delta _a$ and $\delta _w$ for the air and water sides, respectively). The friction Reynolds number on the air side, $Re_{\tau,a} = u_{*a} \delta _a/\nu _a$, is approximately 200, and it is sufficiently large to observe the logarithmic region. The friction Reynolds number on the water side, $Re_{\tau,w} = u_{*w} \delta _w/\nu _w$, is dependent on the time as the boundary layer develops along with the time. The DNS results show that for $t=4.0$–7.0 s, $Re_{\tau,w}$ ranges from 165 to 193.
The scalar  $C$ represents the non-dimensional concentration of the imaginary absorbed gas. The scalar transport was calculated only in the water side because the concentration is uniform ( $C=1$) in the air side. The initial scalar concentration in the water side was set to 0, and the scalar concentration on the interface was fixed to $C=1$ uniformly. The scalar transport calculation was started at $t=4.0$ s, when wind waves were well developed. The Schmidt number, defined as ${Sc} \equiv \nu _w/D$, was set to ${Sc}=1$ in the water side. Note that real gases usually have much larger ${Sc}$; e.g. ${Sc} \approx 600$ for CO $_2$. The scalar transfer coefficient $k_L$ (which is defined in § 3.2 and also referred to as the transfer velocity) for such large ${Sc}$ can be estimated from that for ${Sc}=1$ using the relationship $k_L \propto {Sc}^{-1/2}$ (Jähne, Münnich & Siegenthaler Reference Jähne, Münnich and Siegenthaler1979).
3. Results and discussion
3.1. Effect on wave growth
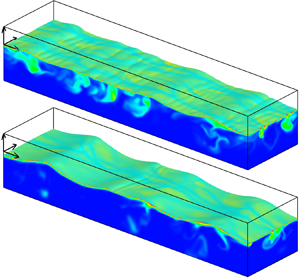
Figure 2 shows the shape of the air–water interface at  $t=6.0$ s for the water case (i.e. $\sigma =1.0\sigma _w$) and the reduced surface tension case (i.e. $\sigma =0.5\sigma _w$). The wind and the propagating waves move in the $x_1$ direction. For the case $\sigma =1.0\sigma _w$, the wind waves form ripple waves on the downwind side of the wave crest. For the case $\sigma =0.5\sigma _w$, the ripple waves are less significant than those for $\sigma =1.0\sigma _w$, and the wave crests are slightly sharper. The above observation can be also confirmed by the streamwise distribution of instantaneous $\eta$ at the middle position of the spanwise width ( $x_2=2.4\times 10^{-2}$ m) in figure 2(c). For $\sigma =0.5\sigma _w$, the distribution of $\eta$ in $0.1\lesssim x_1 \lesssim 0.2$ m does not show clear ripple waves, while that for $\sigma =1.0\sigma _w$ shows ripple-like interface fluctuations in the downwind side of the wave crest.

Figure 2. Three-dimensional view of the air–water interface obtained by DNS for the cases (a)  $\sigma =1.0\sigma _w$ and (b) $\sigma =0.5\sigma _w$, at $t=6.0$ s. (c) Streamwise distribution of interface displacement $\eta$ at $x_2=2.4\times 10^{-2}$ m and $t=6.0$ s.
To quantify the effect of surface tension on the wave height, we have calculated the significant wave height  $H_s$ and the significant wavelength $L_s$ (e.g. Toba Reference Toba1972; Holthuijsen Reference Holthuijsen2007). The significant waves are defined as the waves whose heights are the largest one-thirds among all individual waves, and the individual waves are identified using the zero-up crossing method (Pierson Reference Pierson1954; Takagaki et al. Reference Takagaki, Suzuki, Takahata and Kumamaru2020). Here, $H_s$ and $L_s$ are the average wave height and wavelength of the significant waves, respectively. Figure 3 shows the temporal variations of $H_s$ and $L_s$. Note that, as shown in figure 3(b), the significant waves do not capture wind waves at the initial period ( $t \lesssim 1.0$ s) because the interface initially oscillates due to the initial impact of imposing the wall-bounded turbulent air flow driven by the pressure gradient. However, in the period $t= 1.0$–2.0 s, the wavelength is close to the minimum for both cases, and the wavelength for $\sigma =0.5\sigma _w$ is slightly shorter than that for $\sigma =1.0\sigma _w$. During and after this period, the significant wind waves are well captured, and their wavelengths for both $\sigma$ cases remain less than or comparable to 0.07 m until $t=7.0$ s. This means that the wind waves simulated in this study are classified as gravity–capillary waves ( $0.004 \lesssim L_s \lesssim 0.07$ m) according to the classification in Lin et al. (Reference Lin, Moeng, Tsai, Sullivan and Belcher2008). Figure 3(a) shows that after the significant waves capture wind waves, waves for $\sigma =0.5\sigma _w$ start growing earlier than $\sigma =1.0\sigma _w$, and the wave height for $\sigma =0.5\sigma _w$ is remarkably higher than that for $\sigma =1.0\sigma _w$ after $t=3.0$ s. This result means that the waves are not suppressed by the uniform surface tension reduction in contrast to the effect of surfactants. We have also confirmed the effect of uniform surface tension reduction on the wave height by conducting laboratory experiments using a small wind-wave tank (see Appendix A).

Figure 3. Temporal variations of (a) significant wave height  $H_s$, and (b) significant wavelength $L_s$, for the cases $\sigma =1.0\sigma _w$ and $\sigma =0.5\sigma _w$, and a sudden change from $\sigma =1.0\sigma _w$ to $\sigma =0.5\sigma _w$ at $t = 4.0$ s. Dashed lines show the wavelength amplified by the weakly nonlinear Kelvin–Helmholtz instability $L_{KH}$.
One could argue that the difference in wave height between the cases  $\sigma =1.0\sigma _w$ and $\sigma =0.5\sigma _w$ in figure 3(a) is caused by hysteresis due to the difference in the initial wave development when the wind shear is loaded on the flat free surface. In order to clarify the dominance of hysteresis, we have performed the additional simulation with the surface tension suddenly changed to $\sigma =0.5\sigma _w$ from the wind waves at $t=4.0$ s developed using $\sigma =1.0\sigma _w$. The results are shown by blue lines in figure 3. When the surface tension was changed to $\sigma =0.5\sigma _w$, the significant wave height $H_s$ becomes higher than in the case $\sigma =1.0\sigma _w$, and becomes close to the case with the surface tension $\sigma =0.5\sigma _w$ from the initial time ( $t=0$). This indicates that the hysteresis is not critical, whereas the wave growth speed is increased due to the surface tension reduction.
The surface tension dependence of the significant wavelength in the period  $t= 1.0$–2.0 s is similar to the analytical result of the Kelvin–Helmholtz (K–H) instability, based on which the initial wavelength is given by $L_m \equiv 2{\rm \pi} \sqrt {\gamma /g}$ (where $\gamma = \sigma /\rho _w$), which is the wavelength for minimum phase velocity. However, based on the theoretical analyses (Jeffreys Reference Jeffreys1925; Miles Reference Miles1957, Reference Miles1959), the classical K–H instability is not considered as the major mechanism that causes the initial wind-wave formation on an air–water interface. Jeffreys (Reference Jeffreys1925) and Miles (Reference Miles1957, Reference Miles1993) proposed theoretical models for the formation of initial waves under turbulent winds. Their models estimate that the wave energy grows exponentially, and the initial wavelength formed at the minimum wind speed is approximately 0.06–0.08 m, where the effect of the surface tension is considered to be small. Miles’ model is well accepted because the estimate agrees with observation data. However, this model cannot be applied to the present DNS results for the period $t= 1.0$–2.0 s. Miles (Reference Miles1957, Reference Miles1993) considered the critical layer, which has the same mean wind speed as the wave speed, in the logarithmic layer of a wall-bounded turbulent flow, whereas in the present DNS results, the height for the wind speed equivalent to the wave speed is in the viscous sublayer. Miles (Reference Miles1959) generalized the K–H model to take into account the logarithmic layer of a wall-bounded turbulent flow, and concluded that the K–H instability is unlikely for air–water interfaces at commonly observed wind speeds. Apart from the initial wave formation, Bontozoglou & Hanratty (Reference Bontozoglou and Hanratty1990) examined the weakly nonlinear K–H instability (Miles Reference Miles1986) to characterize the instability of finite-amplitude waves close to resonance, and showed that the K–H instability becomes strongly subcritical for the waves with wavelength shorter than the resonant wavelength given by $L_{KH} \equiv 2{\rm \pi} \sqrt {2\gamma /g}$. They postulate that for air–water flows, gravity–capillary waves can be generated by winds and grow by the subcritical K–H instability so that those become sufficiently high to trigger a finite-amplitude bifurcation, doubling the wavelength (Chen & Saffman Reference Chen and Saffman1979, Reference Chen and Saffman1980). The resonant wavelengths $L_{KH}$ for $\sigma =1.0\sigma _w$ and $\sigma =0.5\sigma _w$ are 0.024 m and 0.017 m, respectively. In the present DNS results for both surface tension cases, the significant wavelength $L_s$ in the period $t= 1.0$–2.0 s almost corresponds to the wavelength $L_{KH}$. Therefore, we can conjecture that the waves in this period are amplified due to the subcritical K–H instability for finite-amplitude waves close to resonance.
The one-dimensional wave height spectrum  $S_{\eta \eta }(k_1)$ in the streamwise direction has been calculated to understand the temporal change of $H_s$ and $L_s$. The one-dimensional wave height spectrum is defined as $S_{\eta \eta }(k_1) \equiv ({1}/{L_2})\int _0^{L_2} \hat {\eta }(k_1,x_2)\,\hat {\eta }^*(k_1,x_2) \, {\rm d}\kern0.7pt x_2$, where $\hat {\eta }(k_1,x_2)$ is obtained by the Fourier transform in the streamwise direction, and $k_1$ is the streamwise wavenumber. An asterisk denotes the complex conjugate. Figure 4(a) shows the temporal change of the wave height spectrum for $\sigma =1.0\sigma _w$. Note that the spectrum is temporally averaged for the past 0.5 s with respect to the indicated time instant. In the early growth period (up to $t=2.5$ s), as predicted by Bontozoglou & Hanratty (Reference Bontozoglou and Hanratty1990), waves with wavenumbers close to and larger than $k_{KH} \equiv \sqrt {g/2\gamma } = 2{\rm \pi} /L_{KH}$ grow predominantly. This is because the spectra for wavenumbers near $k_{KH}$ and $2k_{KH}$ are amplified due to the subcritical K–H instability for the waves close to the second harmonic resonance at an early stage of wave growth (Bontozoglou & Hanratty Reference Bontozoglou and Hanratty1990). After $t=2.5$ s, the peak moves to a lower wavenumber as the wind waves grow, and the spectrum tail broadens on the high wavenumber side. The change of the peak location to lower wavenumbers corresponds to the increase in the significant wavelength in figure 3(b). The decrease of the peak wavenumber is commonly observed for wind waves (e.g. Imasato Reference Imasato1976), and these would be due to the nonlinear wave–wave interactions. The broadening of the spectrum tail on the high wavenumber side is due to a resonant nonlinear wave–wave interaction between the fundamental gravity wave and higher harmonics of order $N$, which forms ripple-like capillary waves (Chen & Saffman Reference Chen and Saffman1979; Fedorov, Melville & Rozenberg Reference Fedorov, Melville and Rozenberg1998; Caulliez Reference Caulliez2013). The resonant condition can be satisfied approximately when the phase velocity of the capillary waves matches that of the fundamental wave. The wavenumber $k_c$ of the capillary waves that resonate with the significant waves with wavenumber $k_s$ is given by $k_c = k_m^2/k_s$, where $k_m=\sqrt {g/\gamma }=2{\rm \pi} /L_m$, when the nonlinearity is negligible. The arrows in figure 4(a) indicate the wavenumber $k_s=2{\rm \pi} /\overline {L_s}$ for the time-averaged significant wavelength $\overline {L_s}$ for $4.0 < t \le 7.0$ s and the wavenumber $k_c$ of the resonant capillary waves. The spectra at $t=5.0$ and 7.0 s show a gentle slope for $k_m < k < k_c$ and decrease steeply for $k > k_c$. This confirms that the harmonic resonance causes the broadened spectrum. Figure 4(b) shows similar temporal change of the spectrum for $\sigma =0.5\sigma _w$: even though $k_{KH}$ for $\sigma =0.5\sigma _w$ is larger than that for $\sigma =1.0\sigma _w$ by a factor $\sqrt {2}$, waves with wavenumbers near $k_{KH}$ grow predominantly in the early growth period (up to $t = 2.0$ s), and then the spectrum broadens on low and high wavenumber sides.

Figure 4. Wave height spectra. Temporal evolutions of the spectra for (a)  $\sigma =1.0\sigma _w$ and (b) $\sigma =0.5\sigma _w$ averaged for 0.5 s before the indicated time instant. (c) Comparison of spectra for $\sigma =1.0\sigma _w$ and $\sigma =0.5\sigma _w$ averaged for the period $4.0< t\le 7.0$ s. Dashed lines are the wavenumbers $k_{KH}=2{\rm \pi} /L_{KH}$ and $k_m=2{\rm \pi} /L_m$. The arrows indicate the wavenumber of the mean significant wave $k_s=2{\rm \pi} /\overline {L_s}$, and the resonant capillary wavenumber $k_c=k_m^2/k_s$, where $\overline {L_s}$ is the time-averaged $L_s$ for the period 4.0–7.0 s. The wavenumbers for $\sigma =1.0\sigma _w$ and $\sigma =0.5\sigma _w$ are indicated in black and red, respectively.
Figure 4(c) compares the wave height spectra for the two cases of surface tension. The spectra are temporally averaged over the period  $4.0 < t \le 7.0\,{\rm s}$. On the low-wavenumber side, the peak for $\sigma =0.5\sigma _w$ is larger than that for $\sigma =1.0\sigma _w$, corresponding to the larger significant wave height. On the high-wavenumber side, the wavenumber $k_c$ of the resonant capillary waves increases due to the surface tension reduction because $k_m$ is inversely proportional to the square root of the surface tension. The bump on the spectrum also moves to the higher wavenumber following the increase of $k_c$. This indicates that the wavelength of the resonant capillary waves becomes shorter. It is also observed that the amplitude at $k_c$ for $\sigma =0.5\sigma _w$ is approximately two orders of magnitude smaller than that for $\sigma =1.0\sigma _w$. This means that ripple-like capillary waves are suppressed due to the surface tension reduction.
To understand the effect of surface tension reduction on the wind-wave growth mechanism, the potential energies due to gravity  $E_g$ and surface tension $E_s$ were calculated using the equations
 $$\begin{gather} E_g = \frac{\rho_w g}{2 L_1 L_2} \int_0^{L_1}\int_0^{L_2} \eta^2 \, {\rm d}\kern0.7pt x_1\, {\rm d}\kern0.7pt x_2, \end{gather}$$
 $$\begin{gather}E_s = \frac{\sigma}{2 L_1 L_2} \int_0^{L_1}\int_0^{L_2} \left\{ \left(\frac{\partial \eta}{\partial x_1}\right)^2 + \left(\frac{\partial \eta}{\partial x_2}\right)^2 \right\} \, {\rm d}\kern0.7pt x_1\, {\rm d}\kern0.7pt x_2. \end{gather}$$
 Figure 5 shows the temporal variations of  $E_g$ and $E_s$. The potential energies $E_g$ and $E_s$ are comparable in the early growth period $1.5 < t< 2.5\, {\rm s}$ for $\sigma =1.0\sigma _w$ and $1.0 < t< 2.0\,{\rm s}$ for $\sigma =0.5\sigma _w$. According to the small-amplitude linear wave theory, $E_g=E_s$ implies that the wavelength is equal to $L_m$. Figures 4(a,b) also show that waves with wavenumbers near $k_{KH} \sim {{O}}(k_m)$ grow predominantly in the early growth period. This is also consistent with the fact that the significant wavelength in the early growth period is close to $L_{KH} = \sqrt {2} L_m$, as shown in figure 3(b). In the early growth period, the potential energy increases exponentially, and the energy growth rate for $\sigma =0.5\sigma _w$ is larger than that for $\sigma =1.0\sigma _w$. These results are qualitatively consistent with the results from the linear stability analysis of Tsai & Lin (Reference Tsai and Lin2004). Lin et al. (Reference Lin, Moeng, Tsai, Sullivan and Belcher2008) reported that, based on their DNS for air–water two-phase flows, initial linear wave growth is followed by exponential wave growth. In the present DNS results, only the later exponential growth is captured. After the early growth period, $E_g$ increases, whereas $E_s$ remains almost constant. The difference in the temporal variation between $E_g$ and $E_s$ corresponds to the broadening of the wave height spectra on both low- and high-wavenumber sides, as shown in figures 4(a,b). The surface potential energy $E_s$ shows larger values for the larger surface tension as expected from the definition of $E_s$. In contrast, the potential energy $E_g$ becomes larger for the smaller surface tension. The increase of $E_g$ due to surface tension reduction is more significant than the decrease of $E_s$. This also means that $E_g$ increases faster for the smaller surface tension. It should be noted that Zavadsky & Shemer (Reference Zavadsky and Shemer2017) reported the temporal development of the wave height measured by applying nearly impulsive wind forcing. Their results show similar fast initial wave growth followed by the relatively slow wave growth. One would find that the growth of $H_s$ becomes even gentler for $t>5.0$ s than for $t=4.0$–5.0 s, while $E_g$ for $\sigma =0.5\sigma _w$ increases almost linearly with time for $t>4.0$ s. Zavadsky & Shemer (Reference Zavadsky and Shemer2017) reported that the quasi-steady equilibrium state appears when the waves are long enough to be purely gravity waves, and this stage is considered as ‘the principal stage’ of Phillips (Reference Phillips1957). Therefore, the gentler growth for $\sigma =0.5\sigma _w$ at $t>5.0$ s could be relevant to this stage because the waves for $\sigma =0.5\sigma _w$ are closer to pure gravity waves than the waves for $\sigma =1.0\sigma _w$. However, clear transition to quasi-steady equilibrium state is not observed in the present DNS results.

Figure 5. Temporal variations of potential energies due to gravity and surface tension,  $E_g$ and $E_s$, for the cases $\sigma =1.0\sigma _w$ and $\sigma =0.5\sigma _w$.
To clarify the mechanism of faster increase of the potential energy  $E_g$ after the early growth period for the case of smaller surface tension in figure 5, we focus on the energy input from air to water and the energy dissipation in the water side. The energy fluxes due to the normal and tangential stress at the interface, $Q_{na}$ and $Q_{ta}$, respectively, are given by
 $$\begin{gather} Q_{na} = \frac{1}{L_1 L_2} \int_\varGamma u_n ( \tau_{na} - p_a - \rho_a g\eta ) \, {\rm d}S, \end{gather}$$
 $$\begin{gather}Q_{ta} = \frac{1}{L_1 L_2} \int_\varGamma ( u_{t1}\tau_{t1} + u_{t2}\tau_{t2} ) \, {\rm d}S , \end{gather}$$
where  $u_n$ is the normal component of the interface velocity, and $u_{t1}$ and $u_{t2}$ are the tangential components of the interface velocity. Here, $\tau _{t1}$ and $\tau _{t2}$ are the tangential components of viscous stress in the directions of $u_{t1}$ and $u_{t2}$, $\varGamma$ represents the interface area, and ${\rm d}S$ is the infinitesimal area on $\varGamma$. Also, $Q_{na}$ and $Q_{ta}$ represent the energy fluxes per unit horizontal area, and can be considered as the energy fluxes attributed to the form and friction drags, respectively. It should be noted that in (3.3), we included the term $u_n \tau _{na}$, but its contribution was negligibly small. We have defined the energy dissipation rate in the water side per unit horizontal area, $\epsilon _w$, as
 \begin{equation} \epsilon_{w} = \frac{1}{L_1 L_2} \int_{V_w} \epsilon \, {\rm d}V ,\end{equation}
where the local energy dissipation rate  $\epsilon$ is given by
 \begin{equation} \epsilon = 2 \rho_w \nu_w {\mathsf{s}}_{ij}{\mathsf{s}}_{ij}, \end{equation}
in which  ${\mathsf{s}}_{ij}$ is the $(i,j)$ component of the strain-rate tensor, defined as ${\mathsf{s}}_{ij} \equiv ({\partial U_i}/{\partial x_j} + {\partial U_j}/{\partial x_i})/2$. In (3.5), $V_w$ represents the volume in the water side.
Figure 6 shows the temporal variations of the energy fluxes from the air side to the water side,  $Q_{na}$ and $Q_{ta}$, as well as the energy dissipation rate on the water side, $\epsilon _w$. The dissipation rate $\epsilon _w$ is shown as negative. A simple centred moving average for the period 0.2 s is applied. For $\sigma =0.5\sigma _w$, $Q_{na}$ is larger than that for $\sigma =1.0\sigma _w$ except the period $2.4\lesssim t \lesssim 2.9\,{\rm s}$, and $Q_{ta}$ for $\sigma =0.5\sigma _w$ becomes smaller than that for $\sigma =1.0\sigma _w$ after $t \approx 1.9$ s. Both $Q_{na}$ and $Q_{ta}$ supply the kinetic energy to the water side, but $Q_{ta}$ accelerates mainly the mean surface velocity and forms a shear layer under the interface. Whereas, $Q_{na}$ contributes to the wave growth rather than $Q_{ta}$ because the energy flux to gravity–capillary waves is attributed to the form drag (Melville & Fedorov Reference Melville and Fedorov2015). Thus the larger values of $Q_{na}$ for $\sigma =0.5\sigma _w$ mean more energy input to the waves than in the case $\sigma =1.0\sigma _w$. It should also be noted that the energy dissipation could also have a significant effect on the wave growth because steady gravity–capillary waves can be obtained when the energy flux due to the form drag is balanced by the viscous energy dissipation (Melville & Fedorov Reference Melville and Fedorov2015). Figure 6 indicates that $\epsilon _w$ is not negligibly small compared to $Q_{na}$.

Figure 6. Temporal variations of the energy fluxes due to the normal and tangential stresses,  $Q_{na}$ and $Q_{ta}$, and the energy dissipation rate $\epsilon _w$ in the water side as negative values. A simple centred moving average for the period 0.2 s is applied.
Therefore, we have examined the relationship between the energy fluxes and the rapid growth of  $E_g$: the time derivative of $E_g$ (i.e. ${{\rm d} E_g}/{{\rm d} t}$) has been compared with the energy input to waves and wave energy dissipation. Note that the energy dissipation rate $\epsilon _w$ also contains the dissipation due to mean shear, which does not contribute to the wave energy dissipation. Hence we consider the energy dissipation due to fluctuation of the strain rate, i.e. $\epsilon _w' \equiv \epsilon _w - \epsilon _{w,m}$, where $\epsilon _{w,m}$ is the energy dissipation rate due to the mean shear. We evaluated $\epsilon _{w,m}$ on the boundary-fitted coordinate as
 \begin{equation} \epsilon_{w,m} \equiv 2 \rho_w \nu_w \int_{{-}2\delta}^0 {\langle {\mathsf{s}}_{ij} \rangle_{z_{g0}}\,\langle {\mathsf{s}}_{ij} \rangle_{z_{g0}}} \, {\rm d} z_{g0} , \end{equation}
where  $\langle {\mathsf{s}}_{ij} \rangle _{z_{g0}}$ is the horizontally averaged strain rate tensor for the same $z_{g0}$, i.e. the average over the surface $\varGamma _{z_{g0}}$, which initially locates at $x_3=z_{g0}$ and moves along with the boundary-fitted coordinate. Here, we used the approximation ${\partial z_g}/{\partial z_{g0}} \approx 1$ to calculate $\epsilon _{w,m}$: we assumed that the volume change at each grid is negligibly small. We have confirmed that the error of computing $\epsilon _{w}$ due to the approximation is negligibly small (less than 4 %). The time derivative ${{\rm d} E_g}/{{\rm d} t}$ has been calculated by fitting a linear function to the time series of $E_g$ for every 0.5 s. Since we focused on the rapid growth of $E_g$, the change rate ${{\rm d} E_g}/{{\rm d} t}$ was calculated for $4.0 \le t < 7.0$ s and $3.0 \le t < 7.0$ s for $\sigma =1.0\sigma _w$ and $\sigma =0.5\sigma _w$, respectively. When the potential energy $E_g$ increases, the kinetic energy associated with the gravity waves also increases, and the balance between energy input and dissipation should contribute to the increase of the total wave energy. However, it is difficult to extract the kinetic energy due to the wave motion from the total kinetic energy including the turbulent kinetic energy. Here, we assume that the kinetic energy of the waves is equivalent to the potential energy as it is the case of monochromatic waves. The change rate of the total energy of gravity waves is then given by $2({{\rm d} E_g}/{{\rm d} t})$. In figure 7, the change rate $2({{\rm d} E_g}/{{\rm d} t})$ for every 0.5 s is compared with the time-averaged $Q_{na}$ and $Q_{na}-\epsilon _w'$ for every 0.5 s in the corresponding period. The dashed line indicates the $2({{\rm d} E_g}/{{\rm d} t})$ values equivalent to $Q_{na}$ or $Q_{na}-\epsilon _w'$. In figure 7(a), the markers are located below the dashed line for both $\sigma =1.0\sigma _w$ and $\sigma =0.5\sigma _w$, meaning that the energy flux $Q_{na}$ is larger than $2({{\rm d} E_g}/{{\rm d} t})$. In figure 7(b), the markers are also located below the dashed line, but closer to it. This means that the correlation of $2({{\rm d} E_g}/{{\rm d} t})$ with $Q_{na}-\epsilon _w'$ is better than that with $Q_{na}$. Thus the rapid growth of $E_g$ is attributed to the energy flux due to normal stress $Q_{na}$ minus the energy dissipation fluctuation $\epsilon _w'$. The wave growth is often quantified by using the wave growth rate (Plant Reference Plant1982; Donelan et al. Reference Donelan, Babanin, Young and Banner2006; Melville & Fedorov Reference Melville and Fedorov2015), which is given by the change rate of the wave energy. The comparison of the wave growth rate obtained from the DNS results with the previous measurements is described in Appendix D.

Figure 7. Wave energy change rate  $2({{\rm d} E_g}/{{\rm d} t})$ against (a) $Q_{na}$, and (b) $Q_{na}-\epsilon _w'$. Here, $Q_{na}$ and $Q_{na}-\epsilon _w'$ are temporally averaged for every 0.5 s after $t=4.0$ s for $\sigma =1.0\sigma _w$, and $t=3.0$ s for $\sigma =0.5\sigma _w$. We obtain ${{\rm d} E_g}/{{\rm d} t}$ by the linear fitting to $E_g$ for every 0.5 s in the corresponding period.
The reason for the larger  $Q_{na}$ for $\sigma =0.5\sigma _w$ is indeed not surprising because $Q_{na}$ is the energy flux attributed to the form drag, and it is reasonable to assume that the form drag becomes larger along with wave growth. The form drag $D_p$ is given by
 \begin{equation} D_p = \frac{1}{L_1 L_2} \int_\varGamma (p_a + \rho_a g\eta)n_1 \, {\rm d}S , \end{equation}
where  $n_1$ is the streamwise component of the normal vector to the interface. Melville & Fedorov (Reference Melville and Fedorov2015) evaluated the energy flux due to the normal stress by $Q_{na} \approx \mathcal {C} D_p$, where $\mathcal {C}$ is the wave velocity. We have confirmed that $Q_{na}$ and $\mathcal {C} D_p$ are well correlated also in our results. Here, the obtained form drag $D_p$ is compared with the significant wave height $H_s$ and the wave slope $H_s/L_s$ in figure 8. Similar to figure 7, the time-averaged values for every 0.5 s are plotted for $4.0 \le t < 7.0$ s and $3.0 \le t < 7.0$ s for $\sigma =1.0\sigma _w$ and $\sigma =0.5\sigma _w$, respectively. In figure 8(a), the form drag $D_p$ for the same wave height $H_s$ is larger for the smaller surface tension case. The difference in $D_p$ between the cases $\sigma =1.0\sigma _w$ and $\sigma =0.5\sigma _w$ is robust because $D_p$ calculated for the case of sudden change from $\sigma =1.0\sigma _w$ to $\sigma =0.5\sigma _w$ at $t = 4.0$ s also becomes larger than $D_p$ for the case where the surface tension remained $\sigma =1.0\sigma _w$. Figure 8(b) shows that the form drag $D_p$ is rather correlated with the wave slope $H_s/L_s$ because $D_p$ for the three cases of surface tension well collapse. This means that the significant waves become steeper due to the surface tension reduction, and that causes the increases of the form drag $D_p$. Therefore, the increase of $Q_{na}$ due to the surface tension reduction can be explained by the increase of the wave slope $H_s/L_s$.

Figure 8. Form drag  $D_p$ against (a) significant wave height $H_s$, and (b) wave slope $H_s/L_s$. Here, $D_p$, $H_s$ and $H_s/L_s$ are temporally averaged for every 0.5 s after $t=4.0$ s for $\sigma =1.0\sigma _w$, and $t=3.0$ s for $\sigma =0.5\sigma _w$.
To investigate the relationship between the energy fluxes and the surface tension, we have evaluated the energy fluxes for the gravity and capillary waves separately. Here, the energy fluxes due to the normal stress at gravity and capillary wave scales ( $Q_{na,g}$ and $Q_{na,c}$, respectively) are defined as
 $$\begin{gather} Q_{na,g} = \int_{0}^{k_{cut}} S_{Qna}(k) \, {\rm d}k, \end{gather}$$
 $$\begin{gather}Q_{na,c} = \int_{k_{cut}}^{k_{max}} S_{Qna}(k) \, {\rm d}k, \end{gather}$$
where  $k$ is the magnitude of the two-dimensional horizontal wavenumber vector ${\boldsymbol k}=(k_1,k_2)$, $k_{max}$ is the maximum wavenumber, and $S_{Qna}(k)$ is the Fourier spectrum of the energy flux due to the normal stress at the interface. This $S_{Qna}(k)$ can be given by
 \begin{equation} S_{Qna}(k) = \frac{1}{\Delta k} \sum_{k-\Delta k/2 \le |\boldsymbol k| < k+\Delta k/2} \mathrm{Re}\left[ - \widehat{(p_a + \rho_a g\eta)}\,\widehat{\frac{\partial \eta}{\partial t}}^* \right], \end{equation}
where  $\hat {A}(k_1,k_2)$ indicates the Fourier coefficient of a given horizontal distribution $A(x_1,x_2)$, and $\mathrm {Re}[{\cdot }]$ indicates the real part of the complex number. We can interpret $Q_{na,g}$ and $Q_{na,c}$ as sharp-cut low- and high-pass filtered values of local energy flux $- (p_a + \rho _a g\eta )({\partial \eta }/{\partial t})$ for the cut-off wavenumber $k_{cut}$. We set $k_{cut}$ to $k_m$ for $\sigma =1.0\sigma _w$. We have confirmed that the above energy fluxes satisfy $Q_{na} = Q_{na,g} + Q_{na,c}$. Similarly, the energy dissipation at gravity and capillary wave scales, $\epsilon _{w,g}$ and $\epsilon _{w,c}$, respectively, are defined as
 $$\begin{gather} \epsilon_{w,g} = \int_{0}^{k_{cut}} \int_{{-}2\delta}^0 S_{\epsilon w}(k,z_{g0}) \, {\rm d}z_{g0} \, {\rm d}k, \end{gather}$$
 $$\begin{gather}\epsilon_{w,c} = \int_{k_{cut}}^{k_{max}} \int_{{-}2\delta}^0 S_{\epsilon w}(k,z_{g0}) \, {\rm d}z_{g0} \, {\rm d}k, \end{gather}$$
where  $S_{\epsilon w}(k,z_{g0})$ is the Fourier spectrum of the energy dissipation rate as a function of initial vertical position $z_{g0}$. Here, $S_{\epsilon w}(k,z_{g0})$ can be given by
 \begin{align} S_{\epsilon w}(k,z_{g0}(m_3)) = \frac{2 \rho_w \nu_w}{\Delta k} \sum_{k-\Delta k/2 \le |\boldsymbol k| < k+\Delta k/2} \mathrm{Re}\left[ \widehat{{\mathsf{s}}_{ij}}({\boldsymbol k},z_{g0}(m_3))\, \widehat{{\mathsf{s}}_{ij}}^*({\boldsymbol k},z_{g0}(m_3)) \right] ,\end{align}
where  $\widehat {{\mathsf{s}}_{ij}}({\boldsymbol k},z_{g0}(m_3))$ is obtained by the Fourier transform in the $x_1$ and $x_2$ directions for ${\mathsf{s}}_{ij}(x_g(m_1),y_g(m_2),z_g(m_1,m_2,m_3))$ for each $m_3$. We used the approximation ${\partial z_g}/{\partial z_{g0}} \approx 1$ again to define $\epsilon _{w,g}$ and $\epsilon _{w,c}$ as (3.12) and (3.13), respectively. We have confirmed that sum of these energy dissipation rates is approximately equal to $\epsilon _{w}'$; i.e. $\epsilon _{w,g} + \epsilon _{w,c} \approx \epsilon _{w}'$.
Figure 9 shows the energy flux due to normal stress and the energy dissipation rate at gravity and capillary wave scales. After  $t=2.5$ s, $Q_{na,g}$ is larger than $Q_{na,c}$, indicating that the energy flux due to the normal stress at the gravity wave scales has dominant influence on the total energy flux $Q_{na}$. This is consistent with our intuition that the contribution of the form drag is dominated by the significant gravity waves. Concerning the dissipation rate, $\epsilon _{w,c}$ is far larger than $\epsilon _{w,g}$. Therefore, the energy dissipation at the capillary wave scales is dominant for $\epsilon _{w}'$. The energy dissipation for capillary wave scales $\epsilon _{w,c}$ for $\sigma =1.0\sigma _w$ is significantly larger than that for $\sigma =0.5\sigma _w$. It is also observed in figure 9(b) that $\epsilon _{w,c}$ is larger than $Q_{na,c}$. This means that the energy dissipation in the water side exceeds the energy input from the air side at the capillary wave scales, and there must be energy transfer from the gravity wave scales to the capillary wave scales. The difference between $\epsilon _{w,c}$ and $Q_{na,c}$ is smaller for the smaller surface tension case. This indicates that the energy transfer from the gravity wave scales decreases due to the surface tension reduction. There are several mechanisms that can result in the inter-scale energy transfer: the four-wave resonant interaction, harmonic resonance of nonlinear waves, and turbulent energy transfer. Unfortunately, it is difficult to specify the dominant mechanism because of the difficulty of evaluating the energy transfer. However, comparison of $Q_{ta}$ (in figure 6) and $\epsilon _{w,c}$ suggests that change in the resonant condition due to the surface tension reduction results in the decrease of the energy transfer from the gravity wave scales because $\epsilon _{w,c}$ (i.e. the energy transfer from the gravity wave scales) is larger than $Q_{ta}$, which produces shear-induced turbulence in the water side, for $\sigma =1.0\sigma _w$.

Figure 9. Energy flux due to normal stress and energy dissipation rate at (a) gravity wave scales and (b) capillary wave scales. A simple centred moving average for the period 0.2 s is applied.
To fully understand the wave growth mechanism, quantitative evaluation of wave–wave interaction is crucial. However, it is difficult to evaluate the energy flux between waves directly from our simulation data. The present results of the energy fluxes at gravity and capillary wave scales indirectly prove the energy transfer between these scales and the effect of the surface tension reduction on the energy transfer. These results indicate that the significant gravity waves receive kinetic energy from the air side with contributions of form drag, i.e.  $Q_{na}$, and the energy is partially transferred to capillary waves and dissipated by the viscosity of water. When the surface tension decreases, the energy transfer to the capillary waves decreases, and the significant waves retain more energy, resulting in the faster growth of the wave height. The faster wave growth can further cause the increase in the wave slope, and therefore the increase of the energy received from the air side with contributions of form drag.
3.2. Effect on scalar transfer
The effect of the surface tension reduction on the scalar transfer across the air–water interface has been investigated by solving the scalar transport equation (2.6) for  $t \ge 4.0$ s. The scalar transfer was evaluated by the scalar transfer coefficient in the water side $k_L$, defined as
 \begin{equation} F = k_L (C_i-C_b). \end{equation}
Here,  $C_i$ is the scalar concentration on the interface ( $C_i = 1$), $C_b$ is the bulk scalar concentration on the water side ( $C_b = 0$), and $F$ is the horizontally averaged scalar flux defined as
 \begin{equation} F = \frac{1}{L_1 L_2} \int_\varGamma D\,\frac{\partial C}{\partial x_n} \, {\rm d}S, \end{equation}
where  $x_n$ is the normal distance from the interface. Figure 10 shows the scalar transfer coefficient $k_L$ for $\sigma =1.0\sigma _w$ and $0.5\sigma _w$. Immediately after the start of the scalar transport calculation at $t=4.0$ s, $k_L$ shows large values because a large concentration gradient near the air–water interface is formed in this transient period. However, for $t>4.5$ s, the scalar concentration boundary layer is sufficiently developed to achieve the local equilibrium of scalar transfer near the interface, and $k_L$ for $\sigma =0.5\sigma _w$ is smaller than that for $\sigma =1.0\sigma _w$. That is, the scalar transfer decreases as the surface tension decreases. The difference is approximately 6.5 % for $5.0 \le t \le 7.0$ s. One could postulate that the decrease of $k_L$ is due to the difference in the surface area of the air–water interface. Figure 11 shows the temporal variation of the surface area expansion ratio, defined as the ratio of the surface area of the interface to the horizontal area. The change in the expansion ratio is less than or approximately equal to 2 %, and the difference of the expansion ratio is even smaller; i.e. the difference of the expansion ratio is too small to explain the difference of $k_L$. These results indicate that the difference in the surface area of the interface does not explain the 6.5 % decrease in $k_L$ due to the surface tension reduction.

Figure 10. Temporal variations of scalar transfer coefficient  $k_L$ on the water side.

Figure 11. Temporal variations of surface area expansion ratio.
The transfer of gases such as CO $_2$ across a wind-driven wavy air–water interface is strongly affected by the turbulence under the interface (Komori et al. Reference Komori, Nagaosa and Murakami1993a). Figures 12(a,b) show the local scalar flux $F_{local} \equiv D ({\partial C}/{\partial x_n})$ on the interface. The colour contours on the side walls show the scalar concentration in the water side. For the case $\sigma =1.0\sigma _w$ in figure 12(a), there are streamwise streaky structures of the local scalar flux on the interface, which are formed due to the turbulent flow structure in the water side (Komori et al. Reference Komori, Kurose, Iwano, Ukai and Suzuki2010; Takagaki et al. Reference Takagaki, Kurose, Tsujimoto, Komori and Takahashi2015; Tejada-Martínez et al. Reference Tejada-Martínez, Hafsi, Akan, Juha and Veron2020). The similar streaky structures of the local scalar flux are also observed for the case $\sigma =0.5\sigma _w$ in figure 12(b), suggesting that the turbulence significantly affects the scalar transfer even when the surface tension is reduced.

Figure 12. (a,b) Colour contours of the local scalar flux  $F_{local}$ on the interface at $t=6.0$ s. (c,d) Isosurfaces of the second invariant of velocity gradient tensor ( $Q=0.002$ s $^{-2}$) in the water side, viewed from the water side (bottom side up), at $t=6.0$ s. Here, (a,c) $\sigma =1.0\sigma _w$, and (b,d) $\sigma =0.5\sigma _w$. The colour contours on the side walls show the scalar concentration $C$.
$C$.
To evaluate the scalar transfer below the moving interface, we calculate the downward scalar flux on the continuous surface  $\varGamma _{z_{g0}}$, introduced in § 3.1. The surface $\varGamma _{z_{g0}}$ can also be considered as the surface for a fixed vertical index $m_3$, and the surface $\varGamma _{z_{g0}}$ for $z_{g0}=0$ corresponds to the air–water interface $\varGamma$. The scalar budget is evaluated for the volume below the surface $\varGamma _{z_{g0}}$. The scalar budget equation can be described for each level of $z_{g0}$ as
 \begin{equation} \frac{{\rm d} \chi(z_{g0})}{{\rm d} t} = F_{diff}(z_{g0}) + F_{turb}(z_{g0}), \end{equation}
where  $\chi (z_{g0})$ is the total scalar per unit horizontal area integrated for the volume below the surface $\varGamma _{z_{g0}}$, and $F_{diff}(z_{g0})$ and $F_{turb}(z_{g0})$ are the downward molecular diffusion and turbulent scalar fluxes across the surface $\varGamma _{z_{g0}}$, respectively. Here, $\chi (z_{g0})$, $F_{diff}(z_{g0})$ and $F_{turb}(z_{g0})$ are defined as
 $$\begin{gather} \chi(z_{g0}) = \frac{1}{L_1L_2}\int_0^{L_1}\int_0^{L_2} \left\{ \int_{{-}2\delta}^{z(x_1,x_2,z_{g0})} C \, {\rm d}\kern0.7pt x_3 \right\} {\rm d}\kern0.7pt x_1 \, {\rm d}\kern0.7pt x_2, \end{gather}$$
 $$\begin{gather}F_{diff}(z_{g0}) = \frac{1}{L_1L_2}\int_{\varGamma_{z_{g0}}} D\,\frac{\partial C}{\partial x_j}\,n_j \, {\rm d}S_{z_{g0}}, \end{gather}$$
 $$\begin{gather}F_{turb}(z_{g0}) ={-} \left\langle cw_3 \right\rangle_{z_{g0}} , \end{gather}$$
where  $z(x_1,x_2,z_{g0})$ is the vertical position of the surface $\varGamma _{z_{g0}}$, $n_j$ is the $j$th component of the unit normal vector to $\varGamma _{z_{g0}}$, ${\rm d}S_{z_{g0}}$ is the infinitesimal area on $\varGamma _{z_{g0}}$, $c$ is the scalar concentration fluctuation ( $c \equiv C - \langle C \rangle _{z_{g0}}$), $w_3$ is the vertical fluid velocity relative to the velocity of the boundary-fitted coordinate ( $w_3 \equiv U_3 - U_1 ({\partial z_g}/{\partial x_1}) - U_2 ({\partial z_g}/{\partial x_2}) - V_3$, where $V_3 = {\partial z_g}/{\partial t}$ is the vertical velocity of the boundary-fitted coordinate), and the brackets $\langle {\cdot } \rangle _{z_{g0}}$ denote the horizontal average over the surface $\varGamma _{z_{g0}}$, i.e. $\langle A \rangle _{z_{g0}} = ({1}/{L_1L_2})\int _0^{L_1}\int _0^{L_2} A(x_1,x_2,z(x_1,x_2,z_{g0})) \, {\rm d}\kern0.7pt x_1\, {\rm d}\kern0.7pt x_2$ for a given function $A$. The derivation of the scalar budget equation (3.17) is described in Appendix E.
Figure 13 shows the vertical profiles of the downward molecular diffusion and turbulent scalar flux,  $F_{diff}$ and $F_{turb}$, respectively, and the time change of $\chi$. The temporal average is taken for the period $5.0 \le t \le 7.0\, {\rm s}$, while the scalar budget equation (3.17) is described for instantaneous scalar distribution. For both cases $\sigma =1.0\sigma _w$ and $\sigma =0.5\sigma _w$, $F_{diff}$ is dominant for the scalar transfer only near the air–water interface. The profile of $F_{turb}$ shows a peak at $z_{g0} \approx -2.2 \times 10^{-3}$ m, and $F_{turb}$ is dominant below this vertical location. The peak value of $F_{turb}$ for $\sigma =0.5\sigma _w$ is approximately 4.7 % smaller than that for $\sigma =1.0\sigma _w$. The magnitude and the difference of the peak values are consistent with the difference in ${{\rm d}\chi }/{{\rm d}t}$ near the surface and the difference in $k_L$ in figure 10. These results indicate that the decrease in $k_L$ due to surface tension reduction is caused by the decrease in the turbulent scalar transfer.

Figure 13. Vertical profiles of downward molecular diffusion and turbulent scalar fluxes,  $F_{diff}$ and $F_{turb}$, respectively, and the time change of stored scalar $\chi$ below $z_{g0}$. The temporal average was taken for the period $5.0\le t \le 7.0\,{\rm s}$. The horizontal average was taken on the boundary-fitted coordinate.
In figure 6, it is observed that  $Q_{ta}$ for $\sigma =0.5\sigma _w$ is smaller than that for $\sigma =1.0\sigma _w$. This means that the energy input for the shear-induced turbulence weakens due to the surface tension reduction. To confirm the turbulence structures in the water side, the turbulent vortices have been visualised by using the second invariant of the velocity gradient tensor, $Q \equiv (\omega _{ij}\omega _{ij} - {\mathsf{s}}_{ij}{\mathsf{s}}_{ij})/2$, where $\omega _{ij}$ is the vorticity tensor defined as $\omega _{ij} \equiv ({\partial U_j}/{\partial x_i} - {\partial U_i}/{\partial x_j})/2$, and ${\mathsf{s}}_{ij}$ is the strain-rate tensor defined above. Figures 12(c,d) show isosurfaces of $Q=0.002$ s $^{-2}$, viewed from the water side (bottom side up). Strong turbulent vortices are distributed near the interface for both surface tension cases: spanwise vortices are observed in the vicinity of the interface, and streamwise vortices are observed below the wave troughs. The structure similar to the spanwise vorticity was reported by Hung & Tsai (Reference Hung and Tsai2009). They computed the evolution of two-dimensional gravity–capillary waves and observed that vortices shed from wave troughs distribute in the vicinity of the interface. The streaky structure of the scalar flux on the interface is attributed to trains of the streamwise vortices. It is also observed that the streamwise vortices for $\sigma =0.5\sigma _w$ are less than those for $\sigma =1.0\sigma _w$.
To compare the turbulent fluctuations, we have calculated the root mean square (r.m.s.) values of the streamwise and spanwise vorticities, because it is difficult to separate the effects of wave motion and turbulent flow on the velocity fluctuation. Figure 14 shows the r.m.s. values of streamwise and spanwise vorticity fluctuations,  $\omega _{1,{rms}}$ and $\omega _{2,{rms}}$, respectively. Large values of $\omega _{1,{rms}}$ and $\omega _{2,{rms}}$ are observed in the vicinity of the interface, and these large values correspond to the spanwise vortices in figures 12(c,d). At the vertical position of $z_{g0} \approx -2.2 \times 10^{-3}$ m, where the peak of $F_{turb}$ is located, the streamwise vorticity fluctuation $\omega _{1,{rms}}$ exceeds the spanwise vorticity fluctuation $\omega _{2,{rms}}$. Thus the streamwise vortices play major roles for the turbulent scalar transfer quantified by $F_{turb}$. We can also find that the streamwise vorticity fluctuation is weaker for the case $\sigma =0.5\sigma _w$. This also indicates that the decrease in the turbulent scalar transfer is due to the decrease in the turbulent fluctuation. The shear in the water side is produced by the energy flux $Q_{ta}$, as explained above. Thus the smaller $Q_{ta}$ can result in the weaker shear-induced turbulence. The decrease of $Q_{ta}$ is attributed to the decrease of the friction drag. Note that the friction and form drags satisfy the relationship $D_f + D_p = \rho _a u_{*a}^2 \approx {\rm const.}$, where $D_f$ and $D_p$ are the friction and form drags, respectively, with $D_p$ given by (3.8), and $D_f$ given by
 \begin{equation} D_f = \frac{1}{L_1 L_2} \int_\varGamma \tau_{ta}t_1 \, {\rm d}S , \end{equation}
where  $t_1$ is the streamwise component of the tangential vector to the interface. Figure 15 shows the friction and form drags, $D_f$ and $D_p$. For $t \ge 4.0$ s, the form drag $D_p$ increases with time, and $D_p$ for the case of smaller surface tension is larger than that for the larger surface tension. As discussed in the previous subsection, the increase in $D_p$ is attributed to the increase in the wave slope $H_s/L_s$ associated with the wave growth. In contrast, the friction drag $D_f$ decreases with time, and $D_f$ for the smaller surface tension case is smaller than that for the larger surface tension. This suggests that the shear-induced water turbulence, which promotes the scalar transfer across the interface, can be suppressed by the decrease in $D_f$ due to the surface tension reduction.

Figure 14. Vertical profiles of root mean square (r.m.s.) values for streamwise and spanwise vorticity fluctuations,  $\omega _{1,{rms}}$ and $\omega _{2,{rms}}$, respectively. The temporal average was taken for the period $5.0 \le t \le 7.0\,{\rm s}$.

Figure 15. Temporal variations of friction and form drags,  $D_{f}$ and $D_{p}$. A simple centred moving average for the period 0.2 s is applied.
These results indicate that when the surface tension is reduced, the wind wave becomes higher and the surface area becomes slightly larger. However, the scalar transfer across the air–water interface decreases because the turbulence under the interface is suppressed due to the decrease in the friction drag.
4. Conclusions
Effects of uniform surface tension reduction on the wind-wave growth and the scalar transfer across the air–water interface have been investigated for finite-amplitude and non-breaking gravity–capillary waves using direct numerical simulations (DNS) of wind-driven air–water two-phase turbulent flows. The incompressible Navier–Stokes equations for both air and water sides have been solved simultaneously using an arbitrary Lagrangian–Eulerian (ALE) method with boundary-fitted moving grids. Finite difference schemes were adopted for the computation of spatial derivatives. The periodic boundary condition was applied in the lateral directions, and the slip condition is applied to the top and bottom boundaries. Initially, the lower water side was static and the free surface was flat, while a wall-bounded turbulent air flow developed for a flat and rigid surface was imposed in the upper air side. The wind speed was comparatively low (approximately 5 m s $^{-1}$) so that no intensive wave breaking occurs. The DNS were performed for the time integration period of 7 seconds to examine growth of gravity–capillary waves with wavelength less than approximately 0.07 m.
Growth of wind waves was simulated for two values of the surface tension: the value for water and half of that. The results show that the significant waves for the smaller surface tension grow faster, and their wave height becomes higher than that for the larger surface tension. Although wind waves were not well captured during the first 1 second in the present DNS results owing to the initial impact of imposing the wall-bounded turbulent air flow on the air–water interface, the initial wave development is not critical for faster wave growth for the case of smaller surface tension. This is supported by the result that the wave growth speed is increased when the surface tension is suddenly reduced from the wind waves at  $t = 4.0$ s developed with the large surface tension. The effect of surface tension reduction on the wave height has also been confirmed by the wave height measurements in a small wind-wave tank (Appendix A).
The growth of wind waves has been also analysed by the wave height spectra. For both surface tension cases, the spectra grow around the wavenumber for the weakly nonlinear Kelvin–Helmholtz instability for finite amplitude waves in the early growth period. After that, the spectra broaden for both low wavenumbers (gravity waves) and high wavenumbers (capillary waves), having a peak on the low-wavenumber side. The broadening of the wave height spectra is consistent with the harmonic resonance, which forms ripple-like capillary waves. The spectrum also shows that when the surface tension is reduced, a bump at the resonant capillary wave scale moves to higher wavenumber and becomes smaller, indicating that the resonant capillary waves become shorter and weaker.
The numerical convergence of the DNS results is discussed in Appendix C. At the present grid resolution, the temporal variations of the significant wave height and wavelength and the wave height spectrum are weakly dependent on the resolution. However, the resolution dependence is smaller than the difference due to the surface tension reduction. Therefore, the DNS results under the present computational condition are enough to discuss the effects of surface tension reduction.
The temporal variations of wave energy show that the potential energies due to gravity and surface tension are comparable during the early growth period. After this period, the potential energy due to gravity increases rapidly, whereas that due to surface tension remains almost constant. The surface tension reduction results in the increase in the potential energy due to gravity and the decrease in that due to surface tension. The results also show that the growth of the potential energy due to gravity is faster for the smaller surface tension.
The energy flux from air to water has also been investigated to understand the faster growth. The energy flux due to the normal stress, which contributes to wave growth, becomes larger due to the surface tension reduction. The surface tension reduction also causes the decrease in the energy dissipation in the water side. The relationship between the energy flux and the temporal wave-energy change shows that the rapid increase of the wave energy is attributed to the balance between energy flux from the air flow and energy dissipation in the water. The energy flux and energy dissipation filtered for gravity and capillary wave scales show that the energy flux from the air flow is received mostly at the gravity wave scales, and the energy dissipation in the water occurs mostly at the capillary wave scales. This indicates that there is an energy transfer mechanism from the gravity wave scales to the capillary wave scales. The energy dissipation for the capillary wave scales becomes smaller due to the surface tension reduction. This means that the energy transfer from the gravity wave scales to the capillary wave scales decreases due to the surface tension reduction. The analysed results also show that the energy flux due to the tangential stress, i.e. the energy source of shear-induced turbulence, is smaller than the energy dissipation. This suggests that the wave energy due to the normal stress at the gravity wave scales is partially transferred to smaller scales by resonant wave interactions and dissipated at the capillary wave scales. In conclusion, the significant gravity waves receive kinetic energy from the air side with contributions of form drag, and the energy is partially transferred to the capillary waves and dissipated by the viscosity of water. When the surface tension decreases, the energy transfer to the capillary wave scales decreases, and the significant waves retain more energy, resulting in the faster growth of the wave height. The scalar transfer across the air–water interface has been discussed further based on the DNS results.
The scalar transfer coefficient (scalar transfer velocity) for the gas absorption decreases due to the surface tension reduction. The decrease in scalar transfer coefficient cannot be explained by the difference of the interface surface area expansion because the influence of the surface tension reduction on the surface area is negligibly small. Since the turbulent scalar flux and the vorticity fluctuation in the water side becomes smaller due to the surface tension reduction, the decrease in the transfer coefficient is caused by the suppression of turbulence under the interface, particularly turbulence associated with streamwise vortices. The suppression of turbulence can be attributed to the decrease of the friction drag, which drives the shear layer beneath the interface.
Acknowledgements
The authors would like to thank A. Kimura, K. Takane and R. Hayashi for their help in conducting the experiments. The numerical simulations presented in this paper were carried out on the Earth Simulator supercomputer system at the Japan Agency for Marine-Earth Science and Technology.
Funding
This work was supported by JSPS KAKENHI grant no. JP19K21937. S.K. would like to acknowledge the partial support from JST COI grant no. JPMJCE1316.
Declaration of interests
The authors report no conflict of interest.
Appendix A. Comparison with wind-wave tank experiments
Laboratory experiments have been conducted to examine the DNS results, in which the wave height becomes higher due to the uniform surface tension reduction. Figure 16 shows a schematic diagram of the experimental apparatus. The experiments were conducted using a small recirculation wind-wave tank (length 1.05 m, width 0.20 m and depth 0.05 m) located in a wind tunnel (Nagata, Sakai & Komori Reference Nagata, Sakai and Komori2007) (length 5.0 m, width 0.30 m and height 0.30 m). A straightened air flow was introduced over the wind-wave tank. The water surface was open to the air flow only at the central test section (length 0.90 m and width 0.09 m) of the tank. The surface water flow induced by the wind shear recirculated through the covered side sections so that a counter-flow was avoided in the lower part of the central test section. A wave absorber was fixed at the end of the test section to prevent the reflection of wind waves and counter-flow. The water-level fluctuation was measured using a capacitance-type displacement meter (Iwatsu Electric Co. Ltd, ST-3572) capable of non-contact measurement. The probe (Iwatsu Electric Co. Ltd, ST-0717A) was set at fetch length  $x=0.70$ m and elevation 0.0020 m or 0.0030 m above the static water level. The sampling time and frequency were 300 s and 1000 Hz, respectively. The measurements were conducted for five cases of the free-stream wind speed $U_\infty$ between 1 and 6 m s $^{-1}$. In order to quantify the wave height, significant waves were identified using the zero-up crossing method.

Figure 16. Schematic diagram of the experimental set-up: a small wind-wave tank placed in a wind tunnel, and the water-level fluctuation measurement system.
Liquids used in the experiments were filtered tap water and two aqueous solutions of ethanol and glycerine. Table 1 shows the surface tension  $\sigma$ and the viscosity $\mu$ of each solution. The surface tension of the 30 wt% ethanol solution was approximately half that of the filtered tap water. However, the viscosity of the aqueous ethanol solution was approximately twice that of the filtered tap water. Thus the concentration of the aqueous glycerine solution was adjusted to approximately 30 wt% so that the viscosity was close to the aqueous ethanol solution while the surface tension remained close to the filtered tap water.
Table 1. Measured values of surface tension  $\sigma$ and dynamic viscosity $\mu$.

Figure 17 shows the measurements of the significant wave height  $H_s$ with the free-stream wind speed $U_{\infty }$, for the filtered tap water and two aqueous solutions of ethanol and glycerine. When the wind speed $U_{\infty }$ is higher than 5 m s $^{-1}$, the significant wave height of the aqueous ethanol solution is larger than that of the aqueous glycerine solution. The difference in the significant wave height is due to the difference in surface tension and not to the difference in viscosity because the significant wave height for the aqueous glycerine solution is almost the same as that of the filtered tap water with the half viscosity at $U_{\infty } > 5$ m s $^{-1}$. Paquier et al. (Reference Paquier, Moisy and Rabaud2015, Reference Paquier, Moisy and Rabaud2016) investigated the effect of viscosity on the wind waves experimentally, and reported the presence of the ‘wrinkle regime’ under large viscosity or weak wind conditions, and the transitions to the regular wave regime under small viscosity or strong wind speed conditions. For $\nu \approx 1.0$– $2.0\times 10^{-6}\,{\rm m}^2\,{\rm s}^{-1}$, the winkle regime should be observed for approximately $u_{*a} \lesssim 0.19$–0.21 m s $^{-1}$ or $U_{\infty } \lesssim 3.6$–4.0 m s $^{-1}$. Thus the difference in the effect of surface tension reduction between low and high wind speed could be due to the difference in the wave regimes. Note that apparently, from the visualisation in figure 2, the wind waves obtained by the DNS are in the regular wave regime.

Figure 17. Significant wave height  $H_s$ against free-stream wind speed $U_\infty$.
The experimental condition for the filtered tap water for  $U_{\infty } \approx 5$ m s $^{-1}$ approximately corresponds to the DNS condition $\sigma = 1.0\sigma _w$, where the viscosity was set to $\nu = \nu _w$ and the free-stream wind speed was $U_{\infty } \approx 5.2$ m s $^{-1}$. Here, we have performed the DNS for additional cases for the aqueous ethanol and glycerine solutions. For the case of the aqueous ethanol solution, the surface tension and the kinematic viscosity were set to $\sigma = 0.5\sigma _w$ and $\nu = 2.0\nu _w$, respectively, and for the aqueous glycerine solution, $\sigma = 1.0\sigma _w$ and $\nu = 2.0\nu _w$, respectively. Other computational conditions were the same as those in § 2.2. Figure 18 shows the temporal variations of the significant wave height $H_s$, for the cases of the filtered tap water ( $\sigma = 1.0\sigma _w$, $\nu = 1.0\nu _w$), the aqueous ethanol solution ( $\sigma = 0.5\sigma _w$, $\nu = 2.0\nu _w$), and the aqueous glycerine solution ( $\sigma = 1.0\sigma _w$, $\nu = 2.0\nu _w$). To compare the DNS results with the laboratory measurements, we estimate the wave growth time $t$ in the DNS that corresponds to the fetch $x = 0.7$ m in the wind wave tank. According to the fetch law (e.g. Wilson Reference Wilson1965), the fetch is formulated as the function of a wave velocity $\mathcal {C}_s$, which is defined as $\mathcal {C}_s \equiv \sqrt {gL_s/2{\rm \pi} + 2{\rm \pi} \gamma /L_s}$ for deep-water gravity–capillary waves with wavelength $L_s$. This suggests that the significant wave velocity $\mathcal {C}_s$ or wavelength $L_s$ is a suitable parameter for comparison between the DNS results and laboratory measurements. At the fetch $x=0.7$ m, the measured values of the wave velocity and the wavelength are $\mathcal {C}_s=0.29$ m s $^{-1}$ and $L_s=0.033$ m, respectively. In figure 3(b), the significant wavelength obtained by the DNS is close to the measured value for $3\, {\rm s}\lesssim t \lesssim 4\,{\rm s}$. We have also confirmed that the significant wave velocity averaged over the period $3\le t \le 4\, {\rm s}$ is $\mathcal {C}_{s} = 0.279$ m s $^{-1}$, close to the laboratory measurement. For the half surface tension case, $\mathcal {C}_s$ can be smaller than the filtered tap water case but its effect on $\mathcal {C}_s$ is smaller than 6 % for the measured wavelength. In the growth stage $3\,{\rm s} \lesssim t \lesssim 4\,{\rm s}$, the DNS in figure 18 well support the experimental results that the homogeneous surface tension reduction enhances the wave height even when the viscosity is doubled, and the viscosity effect on the wave growth is smaller than the surface tension effect. It is also observed that the wave heights in the DNS results are higher than the measured values. This could be due to the difference in the friction velocity, which was not measured in the experiments. Thus we do not compare the DNS results with the laboratory measurements quantitatively. It would be also interesting to note the viscosity effects of surface tension reduction on wind-wave growth. However, we omit detailed discussion about the sensitivity to the viscosity because it is beyond the scope of this paper.

Figure 18. Temporal variations of significant wave height  $H_s$ obtained by DNS for the filtered tap water ( $\sigma = 1.0\sigma _w$, $\nu = 1.0\nu _w$), the aqueous ethanol solution ( $\sigma = 0.5\sigma _w$, $\nu = 2.0\nu _w$), and the aqueous glycerine solution ( $\sigma = 1.0\sigma _w$, $\nu = 2.0\nu _w$).
Appendix B. Interface curvature
The interface curvature  $\kappa$ is defined as the divergence of the normal vector on the interface, $\kappa = - \boldsymbol {\nabla }_\varGamma \boldsymbol {\cdot } {\boldsymbol n}$, where $\boldsymbol n$ is the unit normal vector to the interface, and $\boldsymbol {\nabla }_\varGamma$ denotes the divergence operator in the interface. To compute the curvature $\kappa$, we consider the generalised coordinates $(\xi _1,\xi _2,\xi _3)$ instead of the Cartesian coordinates $(x_1,x_2,x_3)$. In the generalised coordinates, the interface $\varGamma$ is defined as the surface where $\xi _3$ equals a constant value $\xi _{\varGamma }$, and the curvature $\kappa$ is given by the derivative of $\boldsymbol n$ in the $\xi _1$ and $\xi _2$ directions:
 \begin{equation} \kappa ={-}\left[ \frac{{\boldsymbol a}_2\times{\boldsymbol n}}{|{\boldsymbol a}_1\times{\boldsymbol a}_2|}\,\frac{\partial {\boldsymbol n}}{\partial \xi_1} + \frac{{\boldsymbol n}\times{\boldsymbol a}_1}{|{\boldsymbol a}_1\times{\boldsymbol a}_2|}\,\frac{\partial {\boldsymbol n}}{\partial \xi_2}\right], \end{equation}
where  ${\boldsymbol a}_i \equiv ({\partial x_j}/{\partial \xi _i})\,{\boldsymbol e}_j$, and ${\boldsymbol e}_j$ is the basis vector of the Cartesian coordinate. The normal vector is given by ${\boldsymbol n}=({{\boldsymbol a}_1\times {\boldsymbol a}_2})/{|{\boldsymbol a}_1\times {\boldsymbol a}_2|}$. The relationship ${\boldsymbol n}\boldsymbol {\cdot }{\boldsymbol a}_1={\boldsymbol n}\boldsymbol {\cdot }{\boldsymbol a}_2=0$ yields
 \begin{equation} \kappa = \frac{{\mathsf{h}}_{11}{\mathsf{g}}_{22} + {\mathsf{h}}_{22}{\mathsf{g}}_{11} - 2{\mathsf{h}}_{12}{\mathsf{g}}_{12}}{{\mathsf{g}}_{11}{\mathsf{g}}_{22}-{\mathsf{g}}_{12}{\mathsf{g}}_{12}}, \end{equation}
where  ${\mathsf{h}}_{ij}\equiv {\boldsymbol n}\boldsymbol {\cdot }{\partial {\boldsymbol a}_j}/{\partial \xi _i}$ and ${\mathsf{g}}_{ij}\equiv {\boldsymbol a}_i\boldsymbol {\cdot }{\boldsymbol a}_j$.
Appendix C. Numerical convergence
The numerical convergence of the DNS results has been examined by changing the streamwise resolution. The DNS results obtained for  $M_1=400$, where $M_1$ is the number of grid points, were compared with the additional DNS results for $M_1=200$, 300 and 532. The grid spacing was scaled for the fixed domain size. Figure 19 shows the vertical profiles of the mean streamwise air velocity $U_1$ and the r.m.s. value of the streamwise air velocity fluctuations $u'$ of the initial wall-bounded turbulent flows obtained for different resolutions. The vertical axes are normalised by $u_{*a}$, i.e. $U_1^+ = U_1/u_{*a}$ and $u'^+ = u'/u_{*a}$. The horizontal axis is the vertical position in the viscous unit $z^+ = z u_{*a}/\nu _a$. As shown in figure 19, for both $U_1^+$ and $u'^+$, the profiles for different resolutions are well converged.

Figure 19. Vertical profile of (a) mean streamwise air velocity  $U_1^+$, and (b) streamwise air velocity fluctuation $u'^+$, of the initial wall-bounded turbulent flows obtained with different resolutions.
Figure 20 shows the temporal variations of significant wave height and wavelength,  $H_s$ and $L_s$, respectively, for different resolutions. The growth of $H_s$ for $M_1=200$ is slower than the growth for higher resolution, particularly for $t<3$ s, but the wave growths for the other resolutions are well converged. For $M_1\ge 300$, the difference in $H_s$ between the different resolutions increases gradually with time. The small difference between the different resolution cases for $M_1\ge 300$ is smaller than the difference due to the surface tension reduction. The convergence is similarly confirmed for temporal variation of $L_s$.

Figure 20. Temporal variations of (a) significant wave height  $H_s$, and (b) significant wavelength $L_s$, obtained for $\sigma =1.0\sigma _w$ with different resolutions.
Figure 21 shows the time-averaged wave height spectra for the cases  $\sigma =1.0\sigma _w$ and $\sigma =0.5\sigma _w$ obtained for different resolutions. As expected from the temporal variations of the significant wave height and wavelength, the wave spectra for low wavenumbers ( $k_1< k_m$) are well converged. For high wavenumbers ( $k_1>k_m$), the wave spectra are almost converged. We can still see weak dependence on the resolution, but the resolution dependence is sufficiently smaller than the difference due to the surface tension reduction. Thus the present DNS are sufficiently converged over all the scales to discuss the surface tension effect.

Figure 21. Wave height spectra averaged for the period  $4.0< t\le 7.0$ s, obtained for $\sigma =1.0\sigma _w$ and $\sigma =0.5\sigma _w$ with different resolutions. Vertical dotted lines in black and red are the wavenumbers $k_m$ for $\sigma =1.0\sigma _w$ and $\sigma =0.5\sigma _w$, respectively.
Appendix D. Wave growth rate
The wave growth was often evaluated by using the wave growth rate (Donelan et al. Reference Donelan, Babanin, Young and Banner2006). Here, the wave growth rate in our DNS is compared with the measurements in the literature (Plant Reference Plant1982). We use the wave growth rate  $\beta$ defined as
 \begin{equation} \beta \equiv \frac{1}{E}\,\frac{{\rm d}E}{{\rm d}t}, \end{equation}
where  $E$ is the total wave energy. As described in § 3.1, it is difficult to extract the kinetic energy of the wave motion from the total kinetic energy including the turbulent kinetic energy. Here, we assume again that the kinetic energy of the wave motion is equivalent to the potential energy, and the wave growth rate is obtained from $\beta ={{\rm d}\log (E_g+E_s)}/{{\rm d}t}$. Figure 22 shows $\beta$ calculated by fitting a linear function to $\log (E_g+E_s)$ for every 0.5 s. The grey symbols are the measurements summarised in figure 2 of Plant (Reference Plant1982). The solid and dashed lines are the relations obtained by Plant (Reference Plant1982) and given by
 \begin{equation} \beta = \frac{(0.04\pm0.02)u_{*a}^2\omega \cos \theta}{{\mathcal{C}}^2}, \end{equation}
where  $u_{*a}$ is the friction velocity on the air side, $\omega =2{\rm \pi} f$ is the radian wave frequency, $\theta$ is the angle between wind and wave directions, and $\mathcal {C}$ is the phase speed. As shown in figure 22(a), the relationship between $\beta /f$ and $u_{*a}/{\mathcal {C}}$ agrees with the measurements. Note that $\rho _a u_{*a}^2$ is the sum of form and friction drags, $D_p$ and $D_f$, respectively, while $u_{*a}$ in (D2) is relevant to the contribution of the form drag $D_p$ (Melville & Fedorov Reference Melville and Fedorov2015). Since the energy flux due to the normal stress satisfies $Q_{na}\approx {\mathcal {C}}D_p$, the wave growth rate $\beta /f$ should be compared with $Q_{na}/\rho _a{\mathcal {C}}^3$. In figure 22(b), the wave growth rate obtained from our DNS results is plotted against $Q_{na}/\rho _a{\mathcal {C}}^3$, and the correlation with $Q_{na}/\rho _a{\mathcal {C}}^3$ is better than that with $(u_{*a}/{\mathcal {C}})^2$.

Figure 22. Wave growth rate  $\beta$ normalised by the wave frequency $f$ against (a) $(u_{*{\rm a}}/{\mathcal {C}})^2$, and (b) $Q_{na}/\rho _a{\mathcal {C}}^3$. Here, $u_{*a}^2$ and $Q_{na}$ are temporally averaged for every 0.5 s after $t=4.0$ s for $\sigma =1.0\sigma _w$ (black open squares), and $t=3.0$ s for $\sigma =0.5\sigma _w$ (red open circles). We obtain $\beta$ by linear fitting to $\log (E_g+E_s)$ for every 0.5 s in the corresponding period. The other symbols are the measurements summarised in figure 2 of Plant (Reference Plant1982). The solid and dashed lines represent (D2).
Appendix E. Scalar budget equation
To evaluate the scalar transfer below the moving interface, we consider the continuous surface  $\varGamma _{z_{g0}}$. Therefore, we consider the coordinate transform from Cartesian coordinates $(x_1,x_2,x_3)$ to the boundary-fitted coordinates $(\varXi _1,\varXi _2,\varXi _3)$. The computational grids are fixed on $(\varXi _1,\varXi _2,\varXi _3)$, and $(\varXi _1,\varXi _2,\varXi _3)$ is equivalent to $(x_1,x_2,x_3)$ at $t=0$. In the boundary-fitted coordinate, the surface $\varGamma _{z_{g0}}$ is represented by $\varXi _3=z_{g0}$. The scalar transport equation in the boundary-fitted coordinate can be described as
 \begin{equation}
\frac{\partial C|\boldsymbol{\mathsf{J}}|}{\partial t} + \frac{\partial
C(U_j-V_j){\mathsf{K}}_{jk}}{\partial \varXi_k} =
\frac{\partial}{\partial \varXi_k} \left( D\,\frac{\partial
C}{\partial x_j}\,{\mathsf{K}}_{jk} \right) ,
\end{equation}
\begin{equation}
\frac{\partial C|\boldsymbol{\mathsf{J}}|}{\partial t} + \frac{\partial
C(U_j-V_j){\mathsf{K}}_{jk}}{\partial \varXi_k} =
\frac{\partial}{\partial \varXi_k} \left( D\,\frac{\partial
C}{\partial x_j}\,{\mathsf{K}}_{jk} \right) ,
\end{equation}
where  $\boldsymbol{\mathsf{J}}$ is the Jacobian matrix $\boldsymbol{\mathsf{J}}={\partial (x_1,x_2,x_3)}/{\partial (\varXi _1,\varXi _2,\varXi _3)}$, $|\boldsymbol{\mathsf{J}}|$ is the determinant of $\boldsymbol{\mathsf{J}}$, ${\mathsf{K}}_{ij}$ is the $(i,j)$ component of the adjugate matrix of $\boldsymbol{\mathsf{J}}$, and $V_i$ is the $i$th component of the velocity of grid points on the boundary-fitted coordinate. Since the boundary-fitted coordinate deforms only in the $x_3$ direction, the components of the Jacobian matrix are ${\mathsf{J}}_{11}={\mathsf{J}}_{22}=1$, ${\mathsf{J}}_{13}={\partial z_g}/{\partial x_1}$, ${\mathsf{J}}_{23}={\partial z_g}/{\partial x_2}$, ${\mathsf{J}}_{33}={\partial z_g}/{\partial z_{g0}}$ and ${\mathsf{J}}_{12}={\mathsf{J}}_{21}={\mathsf{J}}_{31}={\mathsf{J}}_{32}=0$. Thus the determinant becomes $|\boldsymbol{\mathsf{J}}|=|{\mathsf{J}}_{33}|$, and ${\mathsf{K}}_{ij}$ is given by ${\mathsf{K}}_{11}={\mathsf{K}}_{22}={\mathsf{J}}_{33}$, ${\mathsf{K}}_{13}=-{\mathsf{J}}_{13}$, ${\mathsf{K}}_{23}=-{\mathsf{J}}_{23}$, ${\mathsf{K}}_{33}=1$ and ${\mathsf{K}}_{12}={\mathsf{K}}_{21}={\mathsf{K}}_{31}={\mathsf{K}}_{32}=0$. The components of the velocity of the boundary-fitted coordinate are $V_1=V_2=0$ and $V_3={\partial z_g}/{\partial t}$. Applying the integral over the volume $0 \le \varXi _1 \le L_1$, $0 \le \varXi _2 \le L_2$ and $-2\delta \le \varXi _3 \le z_{g0}$ in the boundary-fitted coordinate, and using the Gauss divergence theorem for the advection and diffusion terms, we obtain
 \begin{equation} \frac{{\rm d} \chi(z_{g0})}{{\rm d} t} = \left\langle D\,\frac{\partial C}{\partial x_j}\,{\mathsf{K}}_{j3} \right\rangle_{z_{g0}} - \left\langle C(U_j-V_j){\mathsf{K}}_{j3} \right\rangle_{z_{g0}} , \end{equation}
where  $\chi (z_{g0})$ is given by (3.18). In the boundary-fitted coordinate, $\chi (z_{g0})$ and the bracket $\langle {\cdot }\rangle _{z_{g0}}$ are described as $\chi (z_{g0}) = ({1}/{L_1L_2})\int _0^{L_1}\int _0^{L_2}\int _{-2\delta }^{z_{g0}} C\,|\boldsymbol{\mathsf{J}}| \, {\rm d}\varXi _1 \, {\rm d}\varXi _2 \, {\rm d}\varXi _3$ and $\langle A \rangle _{z_{g0}} = ({1}/{L_1L_2})\int _0^{L_1}\int _0^{L_2} A(\varXi _3=z_{g0}) \, {\rm d}\varXi _1\, {\rm d}\varXi _2$ for a given function $A$, respectively. By using the scalar concentration fluctuation $c = C-\langle C \rangle _{z_{g0}}$ and the vertical fluid velocity relative to the velocity of boundary-fitted coordinate $w_3$, the full budget equation is yielded as
 \begin{equation} \frac{{\rm d} \chi(z_{g0})}{{\rm d} t} = F_{diff} - \left\langle cw_3 \right\rangle_{z_{g0}} - \langle C \rangle_{z_{g0}}\,\langle w_3 \rangle_{z_{g0}} , \end{equation}
where  $F_{diff}$ is given by (3.19). Note that the third term vanishes because $\langle w_3 \rangle _{z_{g0}}$ vanishes.


 Open access