

1. Introduction
In 2017, World Trade Organization (WTO) Members launched several Joint Statement Initiatives on a plurilateral basis, which enable the WTO’s negotiating function and allow the organisation to revive and adapt its rulebook to meet current global challenges, despite criticism from some Members.Footnote 1 Plurilateral negotiations focus on e-commerce, investment facilitation for development, micro-, small-, and medium-sized enterprises (WTO, 2017), and domestic regulation for trade in services (WTO, n.d.). Of particular interest is the Investment Facilitation for Development Agreement (IFDA; WTO, 2024), finalized in 2023, which involves two-thirds of WTO Members, many of them being low- and middle-income countries (Berger et al., Reference Berger, Gsell and Olekseyu2019).
In the area of investment facilitation, WTO Members enter uncharted territory. The WTO’s rulebook has previously touched on investment mainly through the Agreement on Trade-Related Investment Measures (TRIMs) and the General Agreement on Trade in Services (GATS). As with trade facilitation, the IFDA involves a shift away from establishing rigid rules, embedded in over 2,600 international investment agreements in force (UNCTAD, 2024). Instead, the IFDA focuses on improving regulatory processes, defining good practices for attracting and retaining Foreign Direct Investment (FDI), and fostering cooperation between governments and investors, particularly in developing countries (Hoekman, Reference Hoekman, Berger and Sauvant2021). Key factors for attracting FDI include the predictability, transparency, and ease of regulatory environments (Kusek and Silva, Reference Kusek and Silva2017). Proponents argue that binding commitments to investment facilitation will enhance cooperation and promote investment flows, with the ultimate goal of contributing to development (Hees and Cavalcante, Reference Hees and Cavalcante2017). However, several key questions about investment facilitation remain. The concept is often defined by what it excludes, such as investment protection, liberalization, and investor–state dispute settlement (ISDS). But what are the core elements of investment facilitation? The IFDA offers a partial blueprint, but does not encompass all possible measures. So what elements does a comprehensive conception of investment facilitation entail? And what do we know about their adoption across countries? While various reforms are undertaken at national, bilateral, and regional levels (Calamita, Reference Calamita2020), data on the actual adoption of investment facilitation measures across countries have been lacking.
This paper introduces the updated Investment Facilitation Index (IFI), a comprehensive dataset measuring the adoption of investment facilitation measures across 142 economies for 2021.Footnote 2 Building on a previous version of the index (Berger et al., Reference Berger, Dadkhahand and Olekseyuk2021), the conceptually revised IFI includes 101 measures in six policy areas, exceeding the scope of the IFDA and covering economies from diverse income levels and regions. Apart from the clear contribution of the IFI for research on the scope, substance, and impact of international investment facilitation disciplines, the index serves as a valuable tool for investors, investment promotion agencies, and governments to navigate and compare the investment regimes of a variety of countries. It helps to identify reform gaps, tailor technical assistance, and assess the economic impacts and implementation costs of agreements with investment facilitation provisions.
2. Methodology
2.1 Conceptualizing Investment Facilitation
Investment facilitation measures span the whole investment life cycle, from the pre-establishment phase, which focuses on streamlining entry procedures, to the post-establishment phase, which emphasizes retaining and expanding investments through mechanisms such as dispute prevention and fostering linkages between foreign and local companies. Notably, the proposals submitted during the negotiations on the IFDA lack a clear definition of investment facilitation, and international organizations also vary in their conceptualization often distinguishing between investment promotion, facilitation, and retention. In practice, however, the lines between these concepts are blurred and investment measures can address different policy goals (Polanco, Reference Polanco, Berger and Chi2025). While following the signatories of the IFDA in excluding market access, investment protection, and ISDS, we define investment facilitation broadly as a set of measures that create a favourable investment environment, emphasizing procedural improvements, transparency, predictability, and cooperation. Moreover, investment facilitation aims to enhance coordination between stakeholders, including governments, investors, local firms, and societal actors (Berger and Gsell, Reference Berger and Gsell2019).
The updated IFI builds on the WTO’s IFDA framework, but at the same time goes beyond it by drawing on other sources, such as international non-binding conventions and guidelines, in order to develop a broad conceptualization of investment facilitation. Unlike the clear focus of trade facilitation on border procedures (WTO, 2013), investment facilitation encompasses broader measures and frameworks behind the border, aiming to promote, facilitate, and retain investment (Novik and de Crombrugghe, Reference Novik and de Crombrugghe2018). Comparing the IFI to the Trade Facilitation Index (OECD, 2018) reveals overlaps – such as measures on transparency, focal points, and procedural streamlining – but while the Trade Facilitation Index focuses on border procedures, investment facilitation involves a wider range of regulations and agencies (Berger et al., Reference Berger, Bolmer and Olekseyuk2022a). Moreover, the IFI does not provide information on the substance of laws and regulations pertaining to investment, such as the UNCTAD Investment Laws Navigator, but focuses on institutional and procedural issues of countries’ investment governance.
The IFI also differs from existing indices such as the FDI Restrictiveness Index (OECD Data, n.d.), which focuses not on facilitation but on measuring restrictiveness of FDI based on foreign equity rules, screening procedures,Footnote 3 and operational restrictions (Golub, Reference Golub2003; Kalinova et al., Reference Kalinova, Palerm and Thomsen2010). Another example is the Services Trade Restrictiveness Index (STRI; Grosso et al., Reference Grosso, Gonzales, Miroudot, Nordås, Rouzet and Ueno2015; OECD, n.d.), which assesses behind-the-border regulations affecting trade in services. The discontinued World Bank’s Doing Business index (World Bank, 2020) measured business regulations, but differed from the IFI by assuming less regulation is better. In contrast, the IFI focuses on enhancing transparency, predictability, and cooperation, which requires not less, but often better, regulatory processes.
2.2 Construction of the Index
Our conceptualization of investment facilitation is based on the six initial text proposals submitted by WTO Members before or shortly after the 11th Ministerial Conference in 2017, which led to the Joint Ministerial Statement on Investment Facilitation for Development (WTO, 2017a).Footnote 4 The concept was further updated, following the WTO negotiations starting in 2020,Footnote 5 incorporating elements like responsible business conduct and anti-corruption measures. The updated index is composed of six distinct policy areas: (1) regulatory transparency and predictability, (2) electronic governance, (3) focal point and review, (4) application process, (5) cooperation, and (6) responsible business conduct and anti-corruption. It tracks the adoption of 101 investment facilitation measures, grouped into these policy areas considering their common underlying concepts.
As illustrated by Berger et al. (Reference Berger, Dadkhah, Gitt, Olekseyuk and Schwab2024), while 61% of included measures align with the IFDA, the index also covers areas beyond the WTO agreement, such as additional e-governance provisions (e.g., online registrations, electronic signature, electronic certificates) or expanded functions for focal points (e.g., dispute resolution and prevention, tracking solutions for investment complaints, corrective recommendations). Unlike the IFDA, which excluded provisions on the movement of business persons, the IFI includes seven measures related to online visa applications, entry requirements, visa processing times, and fees. Additionally, the index incorporates measures for cooperation, including alignment of procedures with neighbouring countries, inter-agency coordination, and investor–government dialogues. Besides host-country measures, the IFI also includes home-country measures (e.g., providing insurance and guarantees, or exchange of information on investment opportunities) following China’s proposal for outward investment facilitation (Sauvant and Hamdani, Reference Sauvant and Hamdani2015; Knoerich et al., Reference Knoerich, Stephenson and Taylor-Strauss2022).
2.3 Coding Scheme
To document the domestic adoption of the 101 investment facilitation measures in the IFI for 142 economies in 2021, a manual in-depth analysis was conducted. Data are drawn from publicly available sources, such as government or investment promotion websites, and official publications such as investment acts and guides.Footnote 6 To ensure comparability across countries, we normalize the data using a simple, transparent scoring strategy. As noted by Nordås (Reference Nordås2010a; Reference Nordås2010b), scoring is critical for preserving variation. Given the diverse nature of the data, we apply a multiple binary strategy with 0 for not adopted, 1 for partially adopted, and 2 for fully adopted. This minimizes information loss in case of continuous data (OECD, 2009) and captures both regulatory frameworks and stages of adoption of investment facilitation measures.
Challenges arise when applying binaries to continuous data, necessitating a threshold strategy for complex policies. For numerical measures, scores are based on percentile ranks (e.g., below 30th percentile, between 30th and 70th, and above 70th). Of the 101 IFI measures, 68% follow a 0–2 scale, 26% use a 0–1–2 scale, and 7% rely on thresholds, with most threshold measures applied to the application process policy area.
2.4 Weighting Scheme
The next challenge is aggregating individual measures into the overall IFI by assigning weights to policy areas (OECD et al., 2008; Grosso et al., Reference Grosso, Gonzales, Miroudot, Nordås, Rouzet and Ueno2015). Instead of relying on arbitrary equal weighting, we used expert judgement to capture the relative importance of each policy area in a realistic and meaningful way. Consulting a large and diverse group of experts helps mitigate the subjectivity inherent in this approach. Thus, the IFI weighting scheme relies on the input of 94 experts from international organizations, academia, private sector, and governments, who allocated 100 points across the six policy areas based on their importance for attracting and retaining FDI. These were then averaged and converted into weights, with each measure within a policy area contributing equally.Footnote 7 Under this scheme, regulatory transparency and predictability plus electronic governance account for over 40% of the index’s weight (23% and 19%, respectively), reflecting their central role in investment facilitation.Footnote 8
3. Adoption of Investment Facilitation Measures across Economies
The IFI provides detailed data for 142 WTO Members, including over 90% of the IFDA signatories. It also includes key Members not participating in the IFDA (e.g., India and the USA). Based on the 2024 World Bank classification, the IFI covers 54 high-income, 72 upper- and lower-middle-income, and 16 low-income countries, accounting for 98.2% of global inward FDI stock and 97.6% of FDI flows in 2019 (UNCTAD, 2023).
Figure 1 illustrates the wide variation in the adoption of investment facilitation measures across the 142 economies (grey bars). IFI scores range from 0.22 for the Central African Republic to 1.76 for the Republic of Korea, and the median score is 1.04. On average, economies have adopted 49% of the 101 IFI measures, though there is significant variation: high-income countries have adopted over 62%, while low-income countries have adopted only 29%.Footnote 9 Thus, the adoption level of these measures is strongly linked to the country’s level of economic development. The distribution of IFI scores by income level confirms that low-income countries have the lowest average (0.55) and median (0.59) scores, while high-income countries have the highest (1.26 average, 1.29 median). Middle-income countries fall in between, with averages of 0.77 (lower-middle) and 0.98 (upper-middle). However, some low-income countries, like Uganda (1.12), outperform the median upper-middle-income country (Argentina, 0.99) and even some lower-scoring high-income countries such as Guyana (0.40), Barbados (0.61), or Panama (0.75).
IFI score per economy and reform gaps relative to the IFDA.

The reform gap relative to the IFDA, shown by the coloured bars in Figure 1, reflects the flipside of current adoption levels. The largest gaps are seen in low-income countries with lower adoption rates (e.g., Djibouti, Central African Republic, Chad, Liberia, Benin, Haiti, Eswatini), while high-income countries with higher adoption levels (e.g., United Kingdom, Netherlands, Republic of Korea, Japan, USA) exhibit the smallest gaps. The reform gap is divided into three categories based on the IFDA text: red bars represent gaps in binding ‘shall’ provisions, orange bars cover conditional binding commitments like ‘shall, to the extent practicable’, and yellow bars indicate gaps in non-binding provisions, such as ‘should’ or ‘may.’ Our assessment shows that even high-income countries have room to enhance their investment facilitation frameworks by adopting more provisions, both within and beyond the IFDA, to reach the maximum IFI score of 2.
The distribution of IFI scores by World Bank regions offers further insights. The lowest median scores are in Sub-Saharan Africa (SSA) and Latin America and the Caribbean, with 0.67 and 0.75, respectively. The Middle East and North Africa (MENA) region scores a median of 0.99, while South Asia reaches 1.09 and East Asia and the Pacific scores a median of 1.13. European and Central Asian countries perform better with a median of 1.31, while North America stands out with an average and median of 1.64, driven by the high scores of Canada and the USA. Sub-regional disparities are also significant. For example, in the Asia-Pacific region, the average IFI score of 1.12 is driven up by 7 high-income countries (e.g., Australia with 1.52, Japan with 1.65, Republic of Korea with 1.76) out of 22 sampled. Even within the EU, with its single market and high economic integration, there is notable variation, from Malta (0.83) to the Netherlands (1.64). The 27 EU countries face adoption gaps in areas such as focal point and review (seven measures unadopted by at least 22 countries), and the application process (7 measures unadopted by at least 19 countries).
4. Overview of the Policy Areas and Underlying Measures
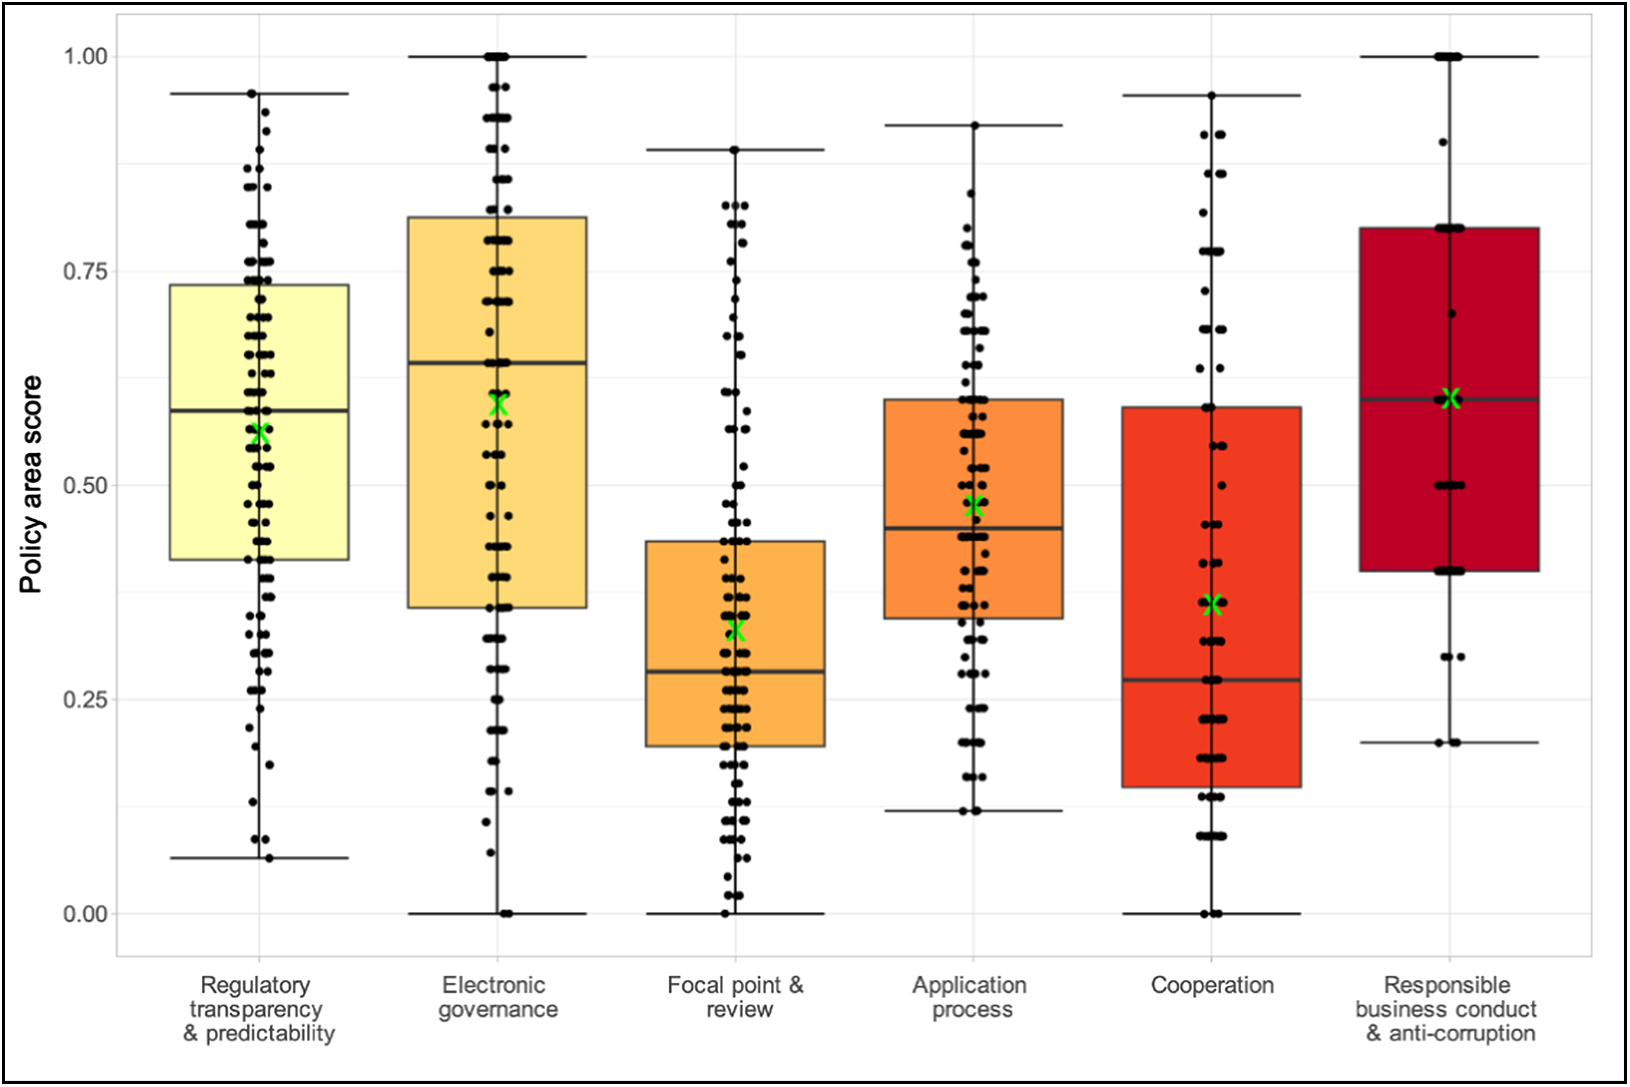
Analysing the adoption of investment facilitation measures by policy area, we find that three areas – responsible business conduct and anti-corruption, electronic governance, and regulatory transparency and predictability – have relatively high adoption levels, with economies achieving on average 60%, 59%, and 56% of the possible maximum score, respectively (Figure 2). In contrast, the other three areas show lower averages: 48% for the application process, 36% for cooperation, and 33% for focal point and review. The largest gaps are in focal point and review and cooperation where 103 and 93 economies, respectively, score below 40% of the possible maximum. In the following, we provide a detailed overview of the six policy areas, highlighting their compounding measures and country-level adoption.
Distribution of IFI scores by policy area.
Regulatory transparency and predictability represents the most important policy area according to our expert survey, carrying a weight of 23%. It incorporates 23 individual measures, with economies achieving between 7% (Central African Republic) and 93% (Korea and the USA) of the possible maximum score of 0.46 in this area.
Investment facilitation emphasizes enhancing transparency and stakeholder involvement. Regulatory transparency can be achieved through measures such as online publication of all investment-related information, establishing special enquiry points to assist investors, and providing advance notice of proposed changes to laws, regulations, and fees. Regarding involvement of interested parties, the concept envisages an opportunity to comment on drafts of investment regulations and acts before implementation. Our findings reveal that over 96% of included economies provide online access to applicable legislation, regulations, and procedures, and more than 92% offer this information in one of the WTO’s official languages. Additionally, 95% of economies maintain an enquiry point (often via investment promotion websites), and 92% publish information on competent authorities. However, fewer economies disclose the purpose and rationale of laws (57%), publish application processing timeframes (46%), or make judicial decisions on investment matters available (8%).
Electronic governance covers 14 measures related to the use of information and communications technology (ICT) and single-window mechanisms. Based on the expert survey, this policy area is the second most important in the IFI, with a weight of 18.7% and a maximum possible score of 0.37. While Djibouti and Central African Republic have not adopted any measures in this area, 11 economies have achieved the maximum score: USA, Chinese Taipei, Finland, India, Israel, Luxembourg, Mauritius, Mexico, Oman, Sri Lanka, and Thailand.
Our results suggest that over 96% of economies in the sample have a national investment website for information purposes, but only 74% provide a minimal set of relevant details, such as on licensing requirements, fees, screening, and approval. Other positive findings include that competent authorities in 94% of economies use email or electronic tools to communicate with investors, 86% recognize electronic signature as legally valid and over 73% accept authenticated copies of documents. However, ICT-based single-window or one-stop shop measures are less common. Specifically, 44% of economies have a single entry point for submitting investment-related applications, but only 27% offer a fully operational single-window service with electronic processing. Furthermore, 60% provide phone or online contacts for complaints related to mandatory registrations through the single window, 58% allow receipt of business registration certificates online, and just 38% ensure regular updates on the single window portal. While simultaneous submission of mandatory registrations (e.g., business registry, tax ID, social security) is possible in 36% of economies, only 28% offer this service through an online platform. Finally, only 36% of economies allow all fees for mandatory registrations to be paid through the single window.
The policy area focal point and review includes 23 measures related to alternative dispute resolution, appeal procedures, cooperation, and information-sharing, as well as ombudsperson-type mechanisms. This area has an expert weight of 18% and a possible maximum score of 0.36. Analysed economies achieve between zero (Chad) and 89% (Republic of Korea) of the possible maximum score. Our data demonstrate that measures related to judicial review and appeal are widely adopted among economies. Of the analysed economies, 95% provide independent or higher-level administrative and/or judicial appeal procedures, 90% allow investors to support or defend their position in judicial reviews, while the decision of such reviews is based on submitted evidence and arguments in 89% of covered economies. Additionally, nearly 72% have set timeframes for providing appeal or review decisions, and 70% ensure sufficient time to study a contested decision and prepare an appeal. In contrast, dispute-prevention mechanisms are available only in 8% of economies. Similarly, most WTO Members lack a fully functioning focal point or ombudsperson-type mechanism to support investors. Only 28% of the economies have a focal point to guide investors on legislation, agencies, and processes, 24% allow a focal point to coordinate and handle complaints, and 30% enable online feedback channels to the focal point. Around 22% of analysed economies have focal points that assist investors in obtaining information from governmental agencies and respond to enquiries of different stakeholders. The least adopted focal point functions include suggesting corrective recommendations on illegal or unfair administrative measures (6%), holding regular meetings with foreign-invested companies and government officials to mitigate conflicts and facilitate their resolution (4%), operating a single window (4%), and enforcing solutions for investment complaints (3%).
The application process policy area deals with formalities (documents, automation, and procedures) as well as fees and charges. It includes 25 measures and has an expert weight of 17.6%. Economies in our sample achieve between 12% (Central African Republic, Guyana, and Niger) and 92% (Republic of Korea) of the possible maximum of 0.35.
None of the analysed economies provides a time period of more than 20 days between the publication of new or amended fees and their entry into force, making this the least adopted measure in the entire dataset. Only five countries – Albania, Austria, Denmark, Mexico, and Myanmar – adopt the ‘silent yes’ approach, where an application is considered approved if no response is received within a specified timeframe. Other measures in this area show better results: 88% of economies do not charge for answering enquiries or providing forms, 51% provide information on all fees and charges, 43% limit fees to the cost of rendered services, and 38% conduct periodic fee reviews, though only 25% adapt fees to changing circumstances. Furthermore, 80% inform applicants about their decision, and 73% accept applications year-round, but just 25% allow applicants to submit additional information to complete their application, and only 20% permit resubmission of previously rejected applications.
Another set of frequently adopted measures focuses on facilitating the entry and sojourn of investment personnel. Data suggest that 91% of economies publish their requirements for temporary entry of business visitors and 88% issue visas with multiple entries. On average, it takes 10 days, requires eight documents, and costs $97 to obtain a business visa. Moreover, 51% of covered WTO Members accept and process visa applications electronically, and 48% allow for visa renewal or extension.
The next policy area is cooperation, encompassing 11 measures related to cooperation among investment-related authorities at national and international levels. According to the expert survey, this area contributes 10.5% to the overall IFI score. While the EU countries score quite similarly (between 0.14 and 0.19, except for Malta and Belgium with 0.12), other countries achieve between zero (Djibouti, Sierra Leone, and Solomon Islands) and 95% (United Kingdom) of the possible maximum of 0.21.
In our sample, 91% of economies cooperate with neighbouring and third countries through multilateral or regional agreements containing investment promotion and facilitation provisions. Examples include the ASEAN Comprehensive Investment Agreement (ACIA), the USA–Mexico–Canada Agreement (USMCA), the Comprehensive and Progressive Agreement for Trans-Pacific Partnership (CPTPP), or the Regional Comprehensive Economic Partnership (RCEP). Over 70% of economies regularly organize business–government networking events with partner countries, and 58% support cooperation of investment agencies. However, only 13% have a specific inter-agency coordination body, 19% exchange information about domestic investors or investment opportunities with other countries, and 21% establish best practice sharing programmes. Unfortunately, only 20% of economies provide a comprehensive domestic supplier database that is online in one of the WTO languages and searchable by sector, product, location, and other criteria, along with local production capacity and corporate social responsibility.
The last policy area, responsible business conduct and anti-corruption, includes five measures based on fundamental international conventions and has an expert weight of 12.2%. This area shows the highest average adoption level at 60% with economies ranging from 20% (Brunei, Chinese Taipei, and Tanzania) to 100% (22 economies in our sample) of potential maximum score of 0.24.
According to our results, 11% of analysed economies have ratified at least three and another 87% at least seven of the eight fundamental International Labour Organization conventions on freedom of association, forced labour, discrimination, and child labour. Brunei and the USA are the only countries with no more than two ratified conventions. Moreover, 98% of economies adopt measures in accordance with the United Nations Convention against Corruption, while only 31% have measures to combat bribery of foreign public officials in international transactions. Around 58% of considered WTO Members adopt double taxation measures similar to the OECD multilateral convention to implement tax treaty related measures to prevent base erosion and profit shifting, and only 21% have a specific national action plan to implement the UN guiding principles on business and human rights.
5. Robustness of the Methodological Approach
We undertake a factor, principal component, and uncertainty analysis to address two key questions about our composite index: (i) does the correlation of measures support the allocation of individual measures into policy areas; and (ii) does our specific set of weights create a specific (potentially biased) picture of economies’ performance that changes considerably with alternative weights?
5.1 Factor Analysis
Individual measures were grouped into policy areas based on their common scopes. To test whether these groupings capture underlying factors, we conduct a factor analysis (Cattell, Reference Cattell1966). The results suggest that the 101 measures are driven by five underlying factors, which could be framed as: (i) institutional quality (ii) electronic governance, (iii) focal point and review, (iv) application process, and (v) exchange between authorities and investors. Out of these five factors, three (ii–iv) are clearly linked to the initial policy areas of electronic governance, focal point and review, and application process. Measures of regulatory transparency and predictability and cooperation are associated with one factor broadly interpreted as institutional quality (i), showing that the measures of these two policy areas exhibit relatively strong covariance in the data and thus appear to be driven by a common factor. Measures grouped under responsible business conduct and anti-corruption have not enough measures to be identified as a distinct factor, and instead also partly load onto the institutional quality factor. The fifth factor captures individual measures from all groupings and can be best described as the openness of communication and exchange between authorities and investors across all policy areas.
The factor analysis generally supports the intuitive groupings into the six IFI policy areas. Despite the joint latent factor for the three policy areas, it remains useful to separate regulatory transparency and predictability, cooperation, and responsible business conduct and anti-corruption. An index constructed from the five factors identified in the factor analysis shows a correlation of 0.95 with the IFI, indicating that whether measures are grouped by data-driven or intuitive methods does not affect the final IFI ranking.
5.2 Correlations of Policy Areas and Principal Components
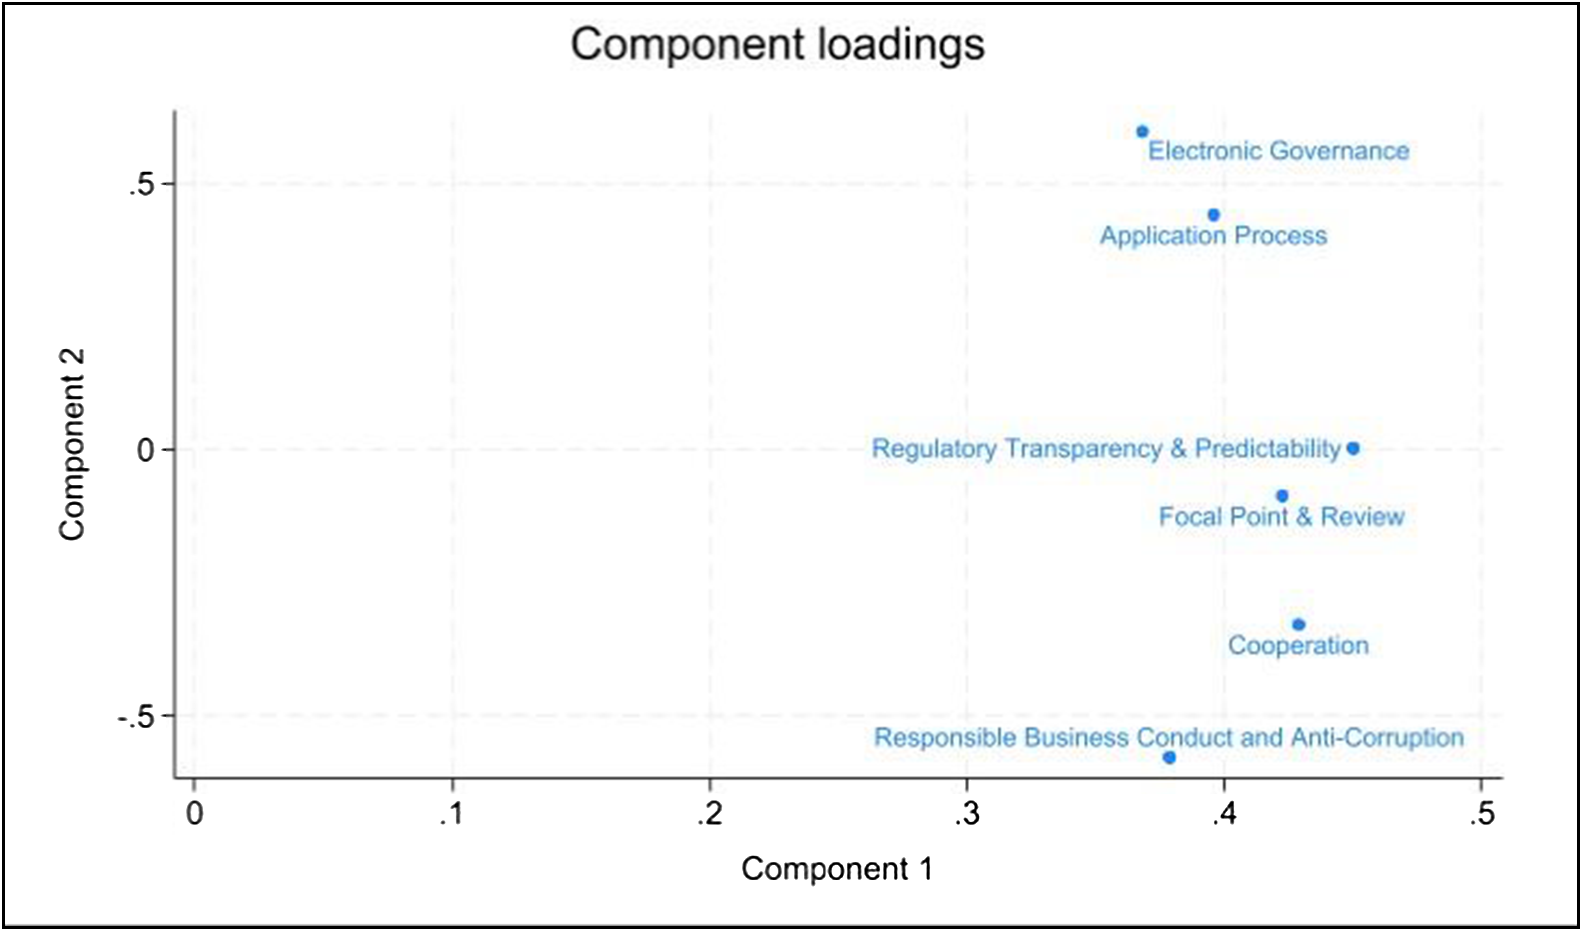
Despite the diversity of IFI policy areas, the data are well-suited for a composite index of the policy areas since their scores are relatively strongly correlated. While most correlations between the policy areas exceed 0.5, the average interim correlation is 0.62, and Cronbach’s Alpha amounts to 0.91. A Principal Component Analysis (Greenacre et al., Reference Greenacre, Groenen, Hastie, d’Enza, Markos and Tuzhilina2022) shows how much of the overall variation of the individual policy area scores can be explained by their common variation. It reveals that the first component (the greatest common variation of the six policy areas) explains 68% of their overall variation. Together with the second principal component, 82% is explained. Figure 3 shows that all policy areas load quite similarly on the first component, showing that all policy area scores exhibit substantial common variation. For the second component, it is a bit more differentiated: while two policy areas do not load on that component at all, two others do positively and two negatively. These results support using a composite index to capture the concept of investment facilitation. However, the correlations between the policy areas are not perfect, implying that distinguishing between different policy areas still provides additional insights.
Loading plot for the first two components of the Principal Component Analysis.
5.3 Uncertainty Analysis
To assess the robustness of the overall IFI scores regarding the chosen weighting scheme, we conduct an uncertainty analysis (Saisana et al., Reference Saisana, Saltelli and Tarantola2005). It examines how uncertainty in the selection of input factors (i.e., policy area weights) affects the values of a composite index. We evaluate  $s \in \left\{ {1,\,\, \ldots ,\,\,S} \right\}$ Monte Carlo simulations with different assumptions for weights. For each simulation
  $s$, weights are sampled independently from each other using a quasi-random scheme (Sobol, Reference Sobol’1967), based on a discrete uniform distribution from our expert survey responses. This process is repeated 14,366 times, which is the total number S of conducted Monte Carlo simulations.Footnote 10 After sampling, these weights are normalized to a unit sum and employed to evaluate the propagated uncertainty using two output variables illustrated by equations (1) and (2):
 \begin{equation}{Y_c} = \mathop \sum \limits_{q = 1}^Q P{A_{q,c}}{w_q}\end{equation}
 The first output variable,  ${Y_c}$, represents the total score of a given economy
  $c \in \left\{ {1,\,\, \ldots ,\,\,M} \right\}$. It is calculated as a sum over the product of each policy area score
  $P{A_{q,c}}$ and the respective weight
  ${w_q}$, where
 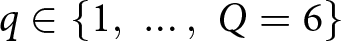 $q \in \left\{ {1,\,\, \ldots ,\,\,Q = 6} \right\}$ indicates the respective policy area.
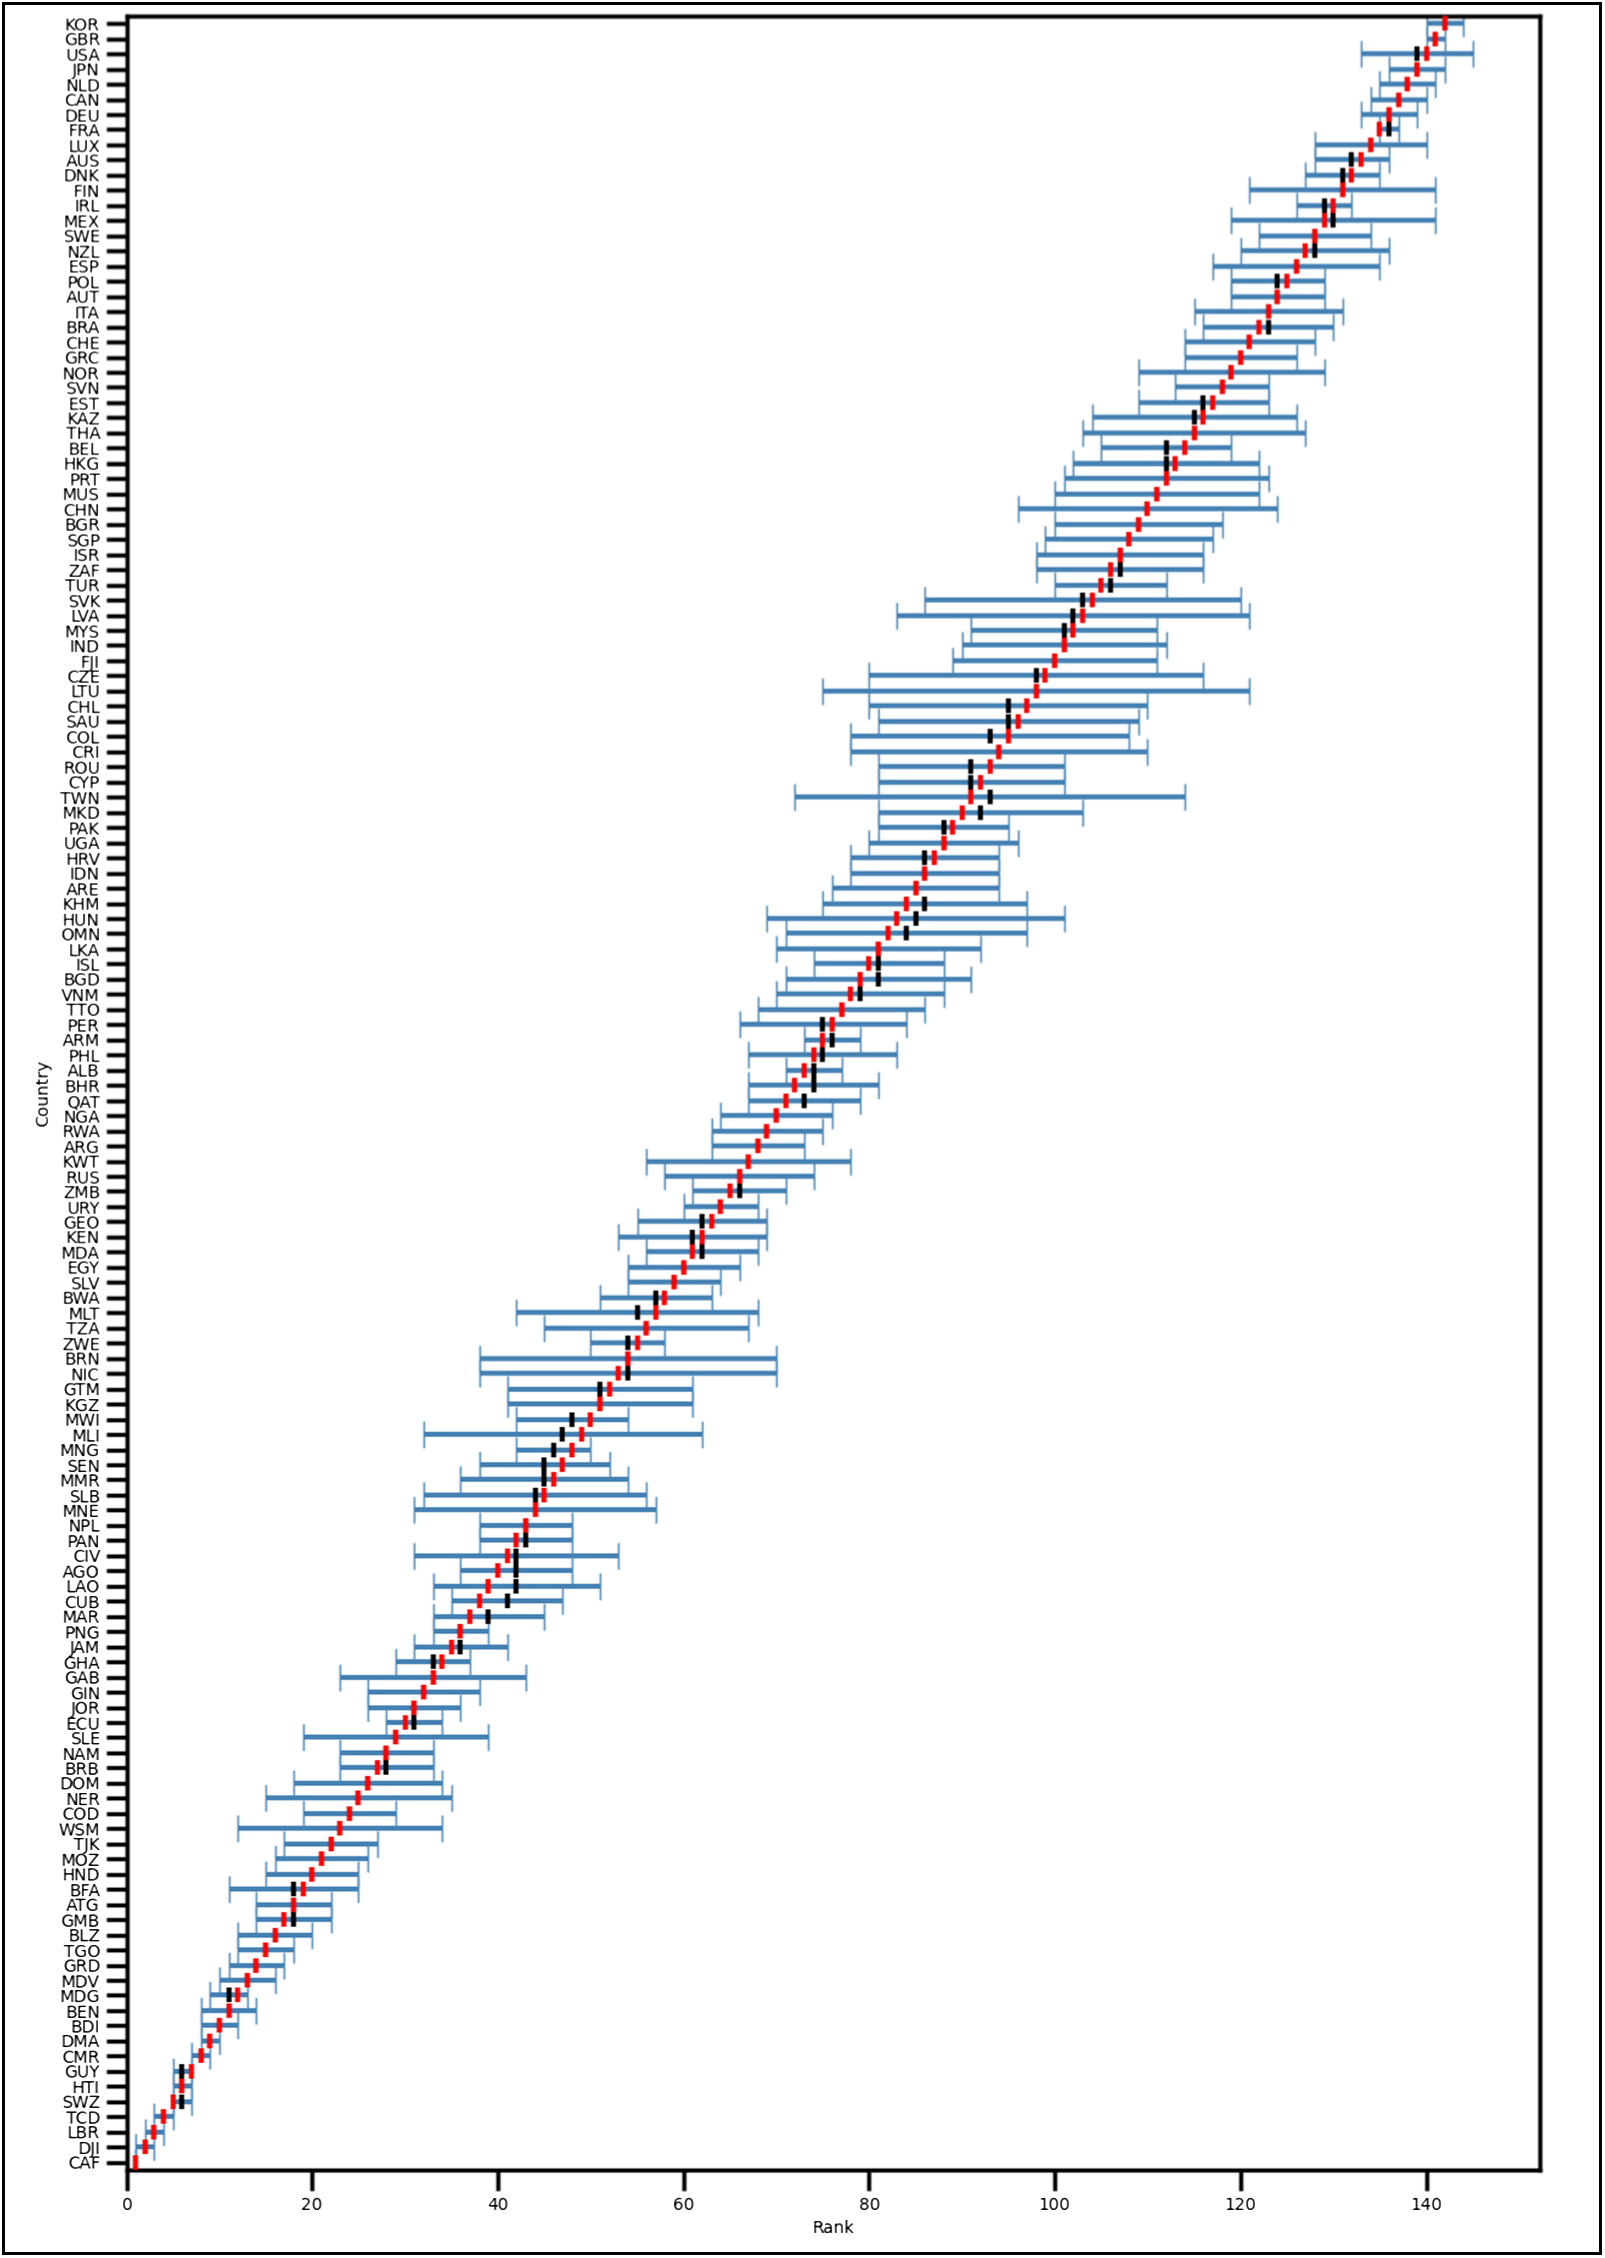
Figure 3 summarizes the results of all 14,366 simulated scores by displaying for each economy the distribution of resulting ranks, ${\text{ }}rank\left( {{Y_{c,s}}} \right)$, with the fifth and 95th percentiles as bounds. Black bars indicate the median rank of each economy, while the red bars indicate the rank based on the original IFI score using expert weights,
  $ran{k_{ref}}\left( {{Y_c}} \right)$. For all economies, the original IFI ranking is very close or even equal to the median from the simulations. This implies that the original expert weighting provides an unbiased picture of the economies’ investment facilitation frameworks. The largest difference between the original rank and simulated median is 3 for Cuba and Lao PDR. The broadest range between the fifth and 95th percentiles is found for Lithuania and Taiwan, which indicates that those economies’ IFI scores are most sensitive to the choice of weights.
The second output variable defines the average shift in economies’ ranks as a function of  ${Y_c}$:
 \begin{equation}\overline {{R_s}} = \frac{1}{M}\mathop \sum \nolimits_{c = 1}^M \left| {ran{k_{ref}}\left( {{Y_c}} \right) - rank\left( {{Y_{c,s}}} \right)} \right|\end{equation}
 The statistic  $\overline {{R_s}} $ is calculated as an average over M=142 economies of the absolute difference between economies’ reference rank based on the original IFI,
  $ran{k_{ref}}\left( {{Y_c}} \right)$, and the ranking obtained during a simulation
 ${\text{ }}s$,
  $rank\left( {{Y_{c,s}}} \right)$. This provides an average rank shift across economies for every simulation, allowing us to describe the empirical probability density function resulting from all 14,366 values. The median average rank shift
  $\overline {{R_s}} $ across all simulations is 3.37, meaning that 50% of the simulations show an average rank shift of 3.37 or less.
Overall, we conclude that our initial choice of weights provides a robust picture of economies’ IFI performance. Figure 4 indicates that economies with very high or low scores are least sensitive to the selection of policy area weights, as their scores are quite high or low across all areas. The highest sensitivity is found for economies that perform well in some areas but poorly in others, leading to greater rank shifts when weights vary.
Distribution of simulated ranks per economy.
6. Conclusions
This paper presents a comprehensive assessment of the adoption level of investment facilitation measures for 142 WTO Members. It is based on an original dataset – comprising 101 investment facilitation measures clustered in six policy areas – the adoption of which is examined by a detailed mapping of domestic investment regimes, incorporating a weighting scheme based on a survey of 94 experts in international organizations, academia, private sector, and governments. While the IFI relies on the specific grouping of policy areas and the informed weighting scheme, neither the index nor its cross-country variation is critically dependent on them. Instead, it is robust to alternative grouping and aggregation methods.
The IFI data reveal high variation in the adoption of investment facilitation measures across economies, with scores ranging from 0.22 (Central African Republic) to 1.76 (Republic of Korea). Lower adoption levels are typically found in low and lower-middle-income countries, particularly in Sub-Saharan Africa, Latin American and the Caribbean. In contrast, upper-middle or high-income countries, especially Asia-Pacific, Europe, and North America, have adopted many of the measures. However, exceptions exist as some low-income countries have higher levels of adoption than some high-income countries, while significant variation is observed within geographical regions.
The IFI is highly relevant for current policy discussions on investment facilitation. At the domestic level, the index can serve as a benchmarking tool to assess how well individual measures are adopted compared to a comprehensive set of possible reforms. It helps to identify areas for improvement and necessary regulatory changes. At the international level, investment facilitation is increasingly included in trade and investment agreements, such as ACIA, RCEP, CPTPP, and USMCA. Brazil and the EU also negotiate bilateral investment facilitation agreements, but the key reference is the IFDA adopted by two-thirds of the WTO membership. For effective implementation, policy reforms should be based on empirically grounded assessments of benefits and challenges. The IFI provides the basis for such assessments and future research, but also the pure data analysis suggests some important policy insights.
First, some researchers argue that investment facilitation reforms can be undertaken unilaterally without binding international commitments (Calamita, Reference Calamita2020). Our data show that this is true mainly for high-income and upper-middle-income countries, especially in Asia-Pacific, Europe, and North America. For many low- and middle-income countries, particularly in Africa, low adoption levels and high reform gaps with respect to the IFDA suggest that unilateral reforms alone may not significantly improve their investment facilitation frameworks. In these cases, implementing the IFDA, backed by technical assistance and capacity-building, can lead to more effective reforms than purely unilateral initiatives.
Second, the IFI highlights that reform pressure from the IFDA will be higher for economies with currently low adoption levels. However, reform pressure alone is insufficient to overcome existing hurdles. Many low- and middle-income countries require technical assistance and capacity development support to implement investment facilitation measures (Berger et al., Reference Berger, Kagan and Sauvant2022b). Enhanced cooperation between the WTO and other international organizations is also envisaged for the IFDA implementation. Hereby, the IFI can assist in identifying reform gaps and prioritizing assistance needs.
Third, the high variation in domestic adoption levels and the unique nature of investment facilitation measures pose challenges for implementing the IFDA. The political economy of investment facilitation suggests that most developing (host) countries benefit primarily from their own policy reforms rather than from those of others. The principle of reciprocity (e.g., often linked to market access exchanges) is less relevant in the context of investment facilitation. Furthermore, high-income and upper-middle-income countries have already adopted a large number of provisions, making the marginal effect of the IFDA on attraction of FDI rather small. Consequently, these countries, as home economies for foreign investors, mainly benefit from reforms in low- and middle-income countries that could facilitate their outward FDI.
In view of the ongoing discussions and negotiations on investment facilitation, there is a need to ramp up empirical research, which can be informed by the IFI data. The level of adoption of investment facilitation measures allows the identification and quantification of changes in investment regimes across economies, as illustrated for the IFDA. The IFI also enables estimations of cost reductions from potential reforms, serving as inputs to evaluate economic effects in the computable general equilibrium models. Moreover, simulating different scenarios of potential agreements may help to identify the most beneficial frameworks for all the partners and spillovers for outsiders (Balistreri and Olekseyuk, Reference Balistreri, Olekseyuk, Berger and Chi2025). Lastly, the IFI highlights adoption gaps, providing a basis for planned IFDA-related needs assessments at country level, which are essential for targeted technical assistance and capacity development support.
Supplementary material
The supplementary material for this article can be found at https://doi.org/10.1017/S1474745625101262
Data availability statement
We have uploaded the data to the WTR dataverse. Please also note that the Investment Facilitation Index is hosted on Zenodo. Please see the reference: Berger, A., A. Dadkhah, F. Gitt, and Z. Olekseyuk (2023) ‘The Updated Investment Facilitation Index [Dataset]’, Zenodo, https://doi.org/10.5281/zenodo.7755521
Acknowledgements
For their useful comments on the previous versions of the paper and on improvement of the IFI, we would like to thank Marc Bacchetta, Eddy Bekkers, Clara Brandi, Bernhard Hoekman, Juan Marchetti, Frederik Stender, Armin von Schiller and Heather Lynne Taylor-Strauss. The authors are grateful to the colleagues at the WTO Secretariat for support and collaboration in the update and extension of the IFI. Also, the authors appreciate all the comments and suggestions of the participants of the Experts Meeting on Investment Facilitation as well as of the respondents of a survey that enabled the creation of expert weights of investment facilitation measures.


 Open access