

Secularization is a constitutive feature of Western modernity (Keddie, Reference Keddie1997). In contemporary liberal democracies, the separation of church and state has become a foundational feature of the political order. Today, most Western countries have established one form or another of institutional arrangements ensuring the autonomy of the political sphere from religious influences. In parallel, the number of individuals identifying as non-religious or secular has sharply risen in recent years across Western publics (Baker and Smith, Reference Baker and Smith2009; Norris and Inglehart, Reference Norris and Inglehart2011; Hout and Fischer, Reference Hout and Fischer2014). Political questions over secularism have concurrently gained traction in Europe and North America, mostly as a consequence of the growing—and quite heated—debate about the integration and accommodation of minority groups into mainstream society (Bader, Reference Bader2007; Kinder and Kam, Reference Kinder and Kam2010; Kettell, Reference Kettell2019).
This political momentum has reinvigorated scholarly interest in secularism over the past decades. Cross-country studies show that support for secularism among Western publics has soared in the last 50 years as adherence to religious denominations lost ground (Hansen, Reference Hansen2011), primarily as a result of individual and societal secularization (Voas, Reference Voas2009; Norris and Inglehart, Reference Norris and Inglehart2011). Among scholars of political behavior, attitudinal preferences for policies enforcing a separation between the church and the state have been recognized as being correlated in important ways with other political attitudes, such as left–right ideological preferences (Huber and Yendell, Reference Huber and Yendell2019), party affiliation (Beard et al., Reference Beard, Ekelund, Ford, Gaskins and Tollison2013), support for social welfare, scientific approaches to societal issues, and other liberal cultural attitudes (Layman et al., Reference Layman, Campbell, Green and Sumaktoyo2021). In addition, research looking at the causes of support for secularism has shown that individuals' sociodemographic background—including higher levels of education and income (Beard et al., Reference Beard, Ekelund, Ford, Gaskins and Tollison2013)—holds significant explanatory power for attitudes toward secular policies.
In Canada, the difference in attitudes toward secularismFootnote 1 between Quebec and the rest of the country (hereafter “Rest of Canada” or “ROC”) is significant. This is one of numerous sociopolitical differences that exist between Quebecers and other Canadians (Nadeau and Bélanger, Reference Nadeau, Bélanger, Kanji, Bilodeau and Scotto2012; Brie and Mathieu, Reference Brie and Félix2021). Yet, secularism continues to create controversy in a uniquely cyclical manner in Canada. Since the Quebec government first proposed to introduce secular legislation in 2013, debates on the ban of religious symbols in the public sphere have been recurrent both within and outside the province. Adopted in 2019, Quebec's Bill 21—An Act respecting the Laicity of the State—prohibits religious symbols for people in position of coercive authority, including police officers and judges. Since its implementation, this legislation has triggered adverse reactions from political actors suggesting that the law should be challenged in court as discriminatory. The constitutionality of Bill 21 was upheld by the Superior Court of Quebec, although it concluded that the provisions were inoperative for English-language school boards. Further legal challenges are likely, with the Supreme Court of Canada expected to hear the case in the coming years. Still, in Quebec, a majority of citizen (64%) report being in favor of the law (Bourgault-Côté, Reference Bourgault-Côté2019). Among other Canadians, however, positions are almost evenly split (Dib, Reference Dib2019).
This paper tests three possible explanations for the differential support for secularism across Canadian regions: religiosity, liberalism,Footnote 2 and prejudice. We operationalize these concepts using multi-item scales, which allow for the measurement of such complex, latent attitudes. Among others, these items make a distinction between negative feelings toward religious and ethnic minorities—a nuance which is often sidelined in the literature—and allow us to test different subtypes of religiosity.
Our findings suggest that differences between Quebecers and other Canadians are partly explained by lower baseline individual levels of religiosity—especially anticlericalism—and by the differential effect of liberal values on support for secularism in Quebec. This is likely to result from the divergent historical and sociological trajectories of Quebec within the Canadian federation over the last 70 years, including Quebec's fraught relationship with the Catholic Church (Zubrzycki, Reference Zubrzycki2016). Our analyses also show that while religious prejudice is a positive predictor of support for secularism both in Quebec and in the ROC, ethnic prejudice is slightly negatively correlated with that attitude in Quebec. These results disprove the commonly held assumption according to which support for secularism would be driven by ethnic prejudice in Quebec. Finally, we demonstrate that among all dimensions of religiosity, anticlerical attitudes are the most powerful predictor of support for secularism across all Canadian provinces. Based on these findings, the cleavage regarding secularism between Quebec and other Canadian provinces should be reassessed as the by-product of low levels of religiosity and of differential forms of liberalism.
Secularism in Quebec and Canada
The commitment by the government of Quebec to enforce secularism has become a recurrent contentious topic in Canada. Outside of the province, state-sanctioned secularism is often interpreted as an explicit attack on minorities, especially since it prohibits “ostentatious” religious symbols that are usually associated with religious minority groups such as Muslims, Sikhs, and Jews (Khan, Reference Khan2021; Sandhu, Reference Sandhu2021). Yet, historically, support for secularism in Quebec has increased following unique sociopolitical changes sparked by the Quiet RevolutionFootnote 3 in the 1960s, with religiosity dramatically declining among Francophones ever since. In the second part of the twentieth century, Quebecers transitioned rapidly from one of the most to one of the least religious communities in the world (Lefebvre, Reference Lefebvre and Beaman2012). In the 1960s and early 1970s, in a rapid sequence of modernization, the state in Quebec took control of the education and of the healthcare and welfare systems that were up to then managed by the Catholic Church and re-established them as secular institutions. This radical move from one of the most pious (McQuillan, Reference McQuillan2004) to one of the most secular societies across the globe informs a substantial part of contemporary Quebec politics (M.D. and Erasmus, 2016).
In the past decades, Quebec's secular tradition has found echoes in the province's political sphere. In 2007, the Quebec government launched the Bouchard–Taylor Commission, a public inquiry on religious accommodations in the province. The commission's heavily publicized report suggested that high-ranking public officials with coercive authority like police officers, judges, and Crown prosecutors should reflect the religious neutrality of the state (Bouchard and Taylor, Reference Bouchard and Taylor2008). Some recommendations from the report were implemented in the years that followed, but other issues remained largely unresolved (Rocher, Reference Rocher, Emongo and White2014). In 2010, the Quebec government first proposed a bill to “establish guidelines governing accommodation requests” but it was not adopted (Bill 94). Then, in 2013, the government proposed a “Charter of Values” which included a prohibition on the wearing of ostentatious religious symbols by people giving or receiving public services. The Charter also never made it into law, but exacerbated years-long discords in the province.
In 2019, debates over secularism culminated with the promulgation of Bill 21 by the Quebec government. The bill, which synthesizes some recommendations of the Bouchard–Taylor report with some controversial policy additions—e.g., prohibition on wearing of religious symbols by school principals, vice-principals, and teachers—benefited from important public support, especially among the governing party's electorate. Since then, the law has remained contentious in both Quebec and Canada, with the legislation being challenged in courts. In 2021, the Quebec Superior Court finally ruled that some of its provisions violated minority language educational rights enshrined in the Charter of Rights and Freedoms. This decision exempted English-language schools in Quebec from having to apply the law. Both parties in the legal fight said they would appeal the decision. Later that year, numerous cities across Canada including Brampton, Guelph, Toronto, and London pledged money and resources in the legal fight against Bill 21. This legal battle is one of the most telling reflections of the considerable regional tensions regarding secular arrangements within Canada.
Support for secularism: religiosity, liberalism, and prejudice
We seek to identify the causes of heightened support for secularism in Quebec, which currently remain unknown. A first potential explanation concentrates on baseline differences in levels of religiosity. This hypothesis ties support for secularism in Quebec to the province's lower levels of religiosity since the decline of the Catholic Church following the Quiet Revolution. Quebec indeed experienced a significant drop in religiosity since the 1960s. This argument contrasts the social trajectories of Quebec and English Canada over the last 60 years—plainly, levels of religiosity have not dropped as significantly in the ROC during this period (Eagle, Reference Eagle2011; Dufresne et al., Reference Dufresne, Kilibarda, Blais and Bibeau2019, 11).
The religiosity hypothesis is supported by empirical findings. For instance, Dufresne et al. (Reference Dufresne, Kilibarda, Blais and Bibeau2019) argue that Canadian respondents with lower levels of religiosity are much more prone to support state-sponsored secularism. Meunier and Legault-Leclair also find that the importance assigned to religion in life matters in explaining support for the wearing of religious symbols by schoolteachers (Reference Meunier and Legault-Leclair2021). However, the effect of religiosity—and of one of its components, anticlericalism—on support for secularist policies in the province has largely remained unexplored. Some scholars maintain that the anticlerical tradition in North America should be distinguished from that in Europe because its development did not stem from opposition to a “pro-clerical authoritarian state”—like in Spain or Italy (Riegelhaupt, Reference Riegelhaupt and Wolf1984; McDavid, Reference McDavid2012, 11)—but this point somewhat overlooks Quebec, where the government heavily relied on the Church's institutions and approval in providing various social services (Lamonde, Reference Lamonde1994; Durou, Reference Durou2011).
Still, contemporary anticlericalism is less acute in Quebec than in some formerly Catholic countries of Europe (Baum, Reference Baum, Lyon and Van Die2000, 158). The high levels of anticlericalism in the province must indeed be understood in conjunction with the more widespread regime of “cultural Catholicism” that characterizes Quebec society (Meunier and Wilkins-Laflamme, Reference Meunier and Wilkins-Laflamme2011). This somewhat paradoxical situation generates a regime of religiosity sometimes characterized as “catho-laïcité” (i.e., catho-secularism) (Maclure, Reference Maclure2014). Though Quebecers' participation in religious practices has been steadily declining—a majority of Quebecers still identify as CatholicsFootnote 4 but the province registers the lowest level of religious participation across Canada (Cornelissen, Reference Cornelissen2021)—the ubiquitous signs of the Church's cultural and social heritage have led some to label Quebecers as “recovering Catholics” (Zubrzycki, Reference Zubrzycki2016). This dynamic gives rise to a distinctive yet fraught relationship between Quebecers and the Catholic Church (Mossière, Reference Mossière2021).
A second potential explanation of the gap in support for secularism is the distinct effect of liberal values in Quebec and in the ROC. Turgeon et al. (Reference Turgeon, Bilodeau, White and Henderson2019), for instance, demonstrate that support for restrictions regarding minority religious symbols in Quebec is primarily driven by the set of liberal values held by Quebecers, which is distinct in many regards from the ones shared by other Canadians. They show that Quebecers' understanding of liberalism is more conducive to support for religious restrictions because it rests on “a vision of liberalism (and laïcité) that called on the state to regulate individual expressions of beliefs and, in so doing, serve as an agent of religious emancipation” (Turgeon et al., Reference Turgeon, Bilodeau, White and Henderson2019, 250–51). This suggests that conservative Quebecers hold similar views than Canadians from other provinces on restrictions for minority groups, while liberal Quebecers display more pro-secularist attitudes than their counterparts elsewhere in the country. Consequently, what explains the difference in attitudes toward secularism would not be liberal values themselves, but the conceptual discrepancies in the meaning of liberalism between Quebecers and other Canadians. Variation in policy preferences for secularism between Quebec and the ROC might therefore be a by-product of two understandings of liberalism at odds with each other.
Finally, a third line of explanation for the heightened support for restrictive secularist policies in Quebec focuses on the role played by prejudice toward immigrants and minority groups. The literature on this phenomenon, which primarily concentrates on the United States and Europe, makes the case that there is a connection between prejudice toward religious minorities and support for wider restrictions on minority religious symbols, especially for Muslims minorities (Kinder and Kam, Reference Kinder and Kam2010; Helbling, Reference Helbling2014). In Canada, research shows that Quebecers are slightly prejudiced toward immigrants and racial minorities (Bilodeau et al., Reference Bilodeau, Turgeon and Karakoç2012), and although this trend is not unique to the province (Turgeon and Bilodeau, Reference Turgeon and Bilodeau2014), negative attitudes toward Muslims in particular has been found to drive support for banning minority religious symbols (Bilodeau et al., Reference Bilodeau, Turgeon, White and Henderson2018).
This last potential explanation for Quebec's higher levels of support for secularism is likely related, on a conceptual level, to its citizens experiencing significant levels of cultural threat (Sniderman and Hagendoorn, Reference Sniderman and Hagendoorn2007; Newman et al., Reference Newman, Hartman and Taber2012; Brie and Ouellet, Reference Brie and Catherine2020). Quebecers indeed form a minority nation within Canada, and its government has been dedicated to protecting the French language and culture via various legislative measures introduced since the Quiet Revolution. However, research on the effect of cultural threat on attitudes toward immigration is inconclusive across various cases (Sides and Citrin, Reference Sides and Citrin2007; Escandell and Ceobanu, Reference Escandell and Ceobanu2010), including in Quebec (Harell et al., Reference Harell, Soroka, Iyengar and Valentino2012; Turgeon and Bilodeau, Reference Turgeon and Bilodeau2014; Medeiros et al., Reference Medeiros, Fournier and Benet-Martínez2017).
Data and methods
Our data emanate from a web panel survey carried out by the public opinion firm Synopsis between September 3 and September 7, 2020, on 2,000 respondents across Canada. Oversampling was carried out in Quebec to allow for a substantial comparison between Quebec respondents and those in the ROC. Data were weighted using sociodemographic variables from the Canadian census to ensure the representativeness of results. The survey includes sociodemographic questions as well as questions on secularism and religiosity, which were worded based on a systematic review of studies of these issues and of their multiple dimensions (Allport and Ross, Reference Allport and Ross1967; Hill and Wood, Reference Hill and Hood1999; Slater et al., Reference Slater, Hall and Edwards2001; Hill and Pargament, Reference Hill and Pargament2003; Idler et al., Reference Idler, Musick, Ellison, George, Krause, Ory, Pargament, Powell, Underwood and Williams2003; Beckford and Demerath, Reference Beckford and Demerath2007; Cutting and Walsh, Reference Cutting and Walsh2008; Koenig and Büssing, Reference Koenig and Büssing2010; Berry et al., Reference Berry, Bass, Forawi, Neuman and Abdallah2011; Zwingmann et al., Reference Zwingmann, Klein and Büssing2011; Cohen et al., Reference Cohen, Mazza, Johnson, Enders, Warner, Pasek and Cook2017).
We investigate three distinct possible explanations found in the literature for the gap between Quebecers and other Canadians regarding support for secularism. Our explanatory variables of interest are (1) the level of religiosity, i.e., the importance given to religious life and to the place of religion in society; (2) liberal values, i.e., attitudes that stress individual freedom (Turgeon et al., Reference Turgeon, Bilodeau, White and Henderson2019, 249), which, due to the distinct political legacies of Quebec and the ROC, could explain their differential support for secularism; (3) and, finally, greater negative feelings toward ethnic and religious minorities as well as in-group preferences measured using a feeling thermometer.
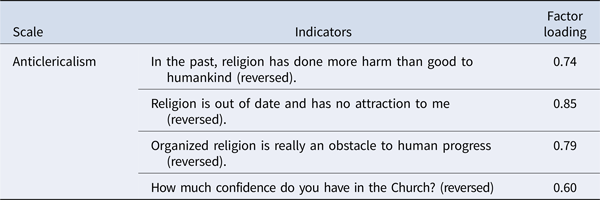
We use multi-item scales to operationalize these complex concepts. There are significant advantages of using scales to measure latent concepts that cannot be directly assessed, like the ones described above (Ansolabehere et al., Reference Ansolabehere, Rodden and Snyder2008). Indeed, multi-item scales are often more reliable than single items, and these scales are useful in complex statistical models with limited degrees of freedom. The factor loadings for our four additive scales are presented in Table A in the Annex.Footnote 5 First, the measure of secularism—our dependent variable—is a scale made up of six theoretically related questions. We operationalize secularism as a single measure composed of respondents' position on (1) whether elected officials should have the right to cover their faces for religious reasons, (2) what efforts should be made to accommodate religious minorities in Canada, (3) whether religious leaders should influence voting during elections, and (4) whether teachers, (5) judges, and (6) police officers should be able to wear religious symbols at work.
Second, our measure of religiosity is made up of 25 religiosity-related survey questions selected following a systematic review of the literature. These questions capture the more inward-looking nature of religiosity. For instance, it includes whether one tries hard to live one's life according to one's religious beliefs, how important is religion to one's life, and whether belonging to a religious group is an important part of one's self-image. The scale also comprises some more socially oriented questions, such as on one's position regarding whether a decline in religiosity leads to the decline of civilization and culture, and whether religious education is essential to preserve morals. We also disaggregate religiosity into four indexes—anticlericalism, religious fundamentalism, social religiosity, and intrinsic religiosity—that synthesizes the theoretical literature on religiosity (Hill and Hood, Reference Hill and Hood1999; Hill and Pargament, Reference Hill and Pargament2003; Cohen et al., Reference Cohen, Mazza, Johnson, Enders, Warner, Pasek and Cook2017).
Third, liberal values are measured using a four-item scale selected from commonly used indicators in the literature (Turgeon et al., Reference Turgeon, Bilodeau, White and Henderson2019). These items are: (1) “society would be better off if more women stayed home with their children,” (2) “euthanasia (or assisted suicide) is never ethically justified,” (3) “gays and lesbians should not be allowed to marry in Canada,” and (4) “it is too easy to get an abortion nowadays.”Footnote 6
Finally, we build two distinct measures of prejudice toward minorities. First, attitudes toward ethnic minorities are measured using respondents' feeling toward Blacks, Asians, Aboriginals, and LatinosFootnote 7 on a feeling thermometer. Second, attitudes toward religious minorities are measured using attitudes toward Jews, Muslims, Hindus, Buddhists, and Sikhs. These allow us to distinguish between negative feelings toward racial and religious minority groups.
Results
Attitudes toward secularism in Quebec and in the ROC
Previous research suggests that there is a significant gap in support for secularism—and for restriction on minority religious symbols—between Quebecers and other Canadians (Turgeon et al., Reference Turgeon, Bilodeau, White and Henderson2019; Dufresne et al., Reference Dufresne, Kilibarda, Blais and Bibeau2019). Descriptive evidence presented in Figure 1 supports this claim, with Quebecers displaying a significantly higher level of pro-secular attitude than citizens from all other Canadian provinces. While there is strong support for secularism among Quebecers, other Canadians reveal less enthusiastic preferences. The asymmetry between both groups reaches a difference of over 15 percentage points (p < 0.01)—with the Quebec average being at 0.71 and the ROC average at 0.54 on a scale ranging from 0 to 1. The regional divide over secularism is on display across all items in our secularism scale (see Figure A). This variation is also apparent in almost all demographic subgroups, including foreign-born Quebecers (see details in Table B in the Annex).
Secularism score across Canadian provinces.
Note: Figure 1 displays the average secularism score (0–1) in all Canadian provinces (n = 2,000). Error bars represent the 95% confidence intervals around the sample mean.
Data: Synopsis, 2020.

Furthermore, questions related to religious symbols worn by individuals in position of coercive authority reveal that support for the prohibition of such symbols for police officers is at 70% among Quebecers but only 49% among other Canadians. Support for extending this prohibition to judges is similar to that of police officers in Quebec but soars to 54% in the ROC. There is also a similar gap on the issue of religious accommodation. In Quebec, 62% of respondents believe that less should be done to accommodate religious minorities. This number contrasts sharply with the position of other Canadians on this issue, 45% of whom responded that less should be done. All these differences are statistically significant (p < 0.01). Although these results underscore a considerable divide between Quebec and ROC respondents, differences in opinion about secularism between Quebecers and other Canadians are, surprisingly perhaps, not as dramatic as one might expect. While support for secularism is more important in Quebec, other Canadians are not openly opposed to the legal regulation of public display of religious symbols (see Figure A in the Annex).
Determinants of secularism across Canadian regions
The score distributions of the religiosity, liberalism, and prejudice scales presented in Figure 2 allow for a general comparison of these baseline determinants of secularism between Quebec and the ROC. First, regarding religiosity, the discrepancy between Quebecers and other Canadians is notable—there is an 8 percentage point difference between both groups (0.32 for Quebec and 0.40 for the ROC, p < 0.01) on the 25-item religiosity index. Our unique set of data enables us to measure four distinct indexes which capture distinct dimensions of religiosity (see Figure B in the Annex). On all four of those, Quebecers express less religious feelings than other Canadians. Quebecers are less religiously fundamentalist (0.38 for Quebec and 0.47 for the ROC, p < 0.01), express less religious behavior (0.31 for Quebec and 0.36 for the ROC, p < 0.01), score lower on the intrinsic religiosity index (0.32 for Quebec and 0.39 for the ROC, p < 0.01), and express higher anticlerical attitudes than other Canadians (0.78 for Quebec and 0.71 for the ROC, p < 0.01). It is striking, however, to note that these important differences of religiosity are largely unacknowledged, with 86% of Canadians from other provinces believing that Quebecers are as much or more religious than the rest of the country (Synopsis, 2021), although low levels of religiosity are one of the province's most distinctive features apart from language.
Religiosity, liberalism, and prejudice scores in Canada. (a) Quebec and (b) Rest of Canada.
Note: Figure 2(a) represents the distribution of scores for Quebec (n = 974), and (b) for the Rest of Canada (n = 1,026). The dotted vertical line represents the median value for each of these distributions. Data: Synopsis, 2020.

Although regional contrasts across these various items are remarkable, they have historical roots. Quebec's peculiar trajectory over the last 70 years has led to drastic declines in church attendance, religious ordination, and religious marriage. Moreover, the Catholic Church's wide-ranging control and domination of Quebec's society until the early 1960s have left some substantial marks over collective attitudes, especially among older generations, as “the reactions of many to religion in general come from deep personal grievances about their Catholic upbringing as well as from broader political, sociocultural resentment toward the role of the Church in Quebec until the Quiet Revolution” (Zubrzycki, Reference Zubrzycki2016, 186). Of course, while these dynamics cannot entirely explain low levels of religiosity in Quebec, they account for a significant part of the explanation.
Second, turning to liberal values, the distribution of respondents' attitudes on these topics displays a different trend. Quebecers are only modestly more liberal than other Canadians among a set of related social issues (a 5 percentage point difference between the Quebec and the ROC average, p < 0.01), including same-sex marriage (a 7 percentage point difference, p < 0.01), abortion (4 percentage point difference, p < 0.01), the place of women in society (4 percentage point difference, p < 0.01), and euthanasia (3 percentage point difference, p < 0.01). However, one important caveat is that the meaning of liberalism in Quebec and in the ROC might be characterized by a conceptual discrepancy. This thesis—the “tale of two liberalisms” argument put forward by Turgeon et al. (Reference Turgeon, Bilodeau, White and Henderson2019)—leads us to expect distinct effects of liberal values on secularism in Quebec and the ROC. We test this hypothesis later with the inclusion of an interaction term between liberalism and Quebec.
Finally, another point on which one might expect Quebecers to differ from other Canadians is the issue of out-group prejudice. Yet, attitudes toward minority groups are highly similar in Quebec and in the ROC. The only notable difference appears when considering only religious minorities, with Quebecers holding more negative feelings than other Canadians toward these groups (0.46 for Quebec and 0.36 for the ROC, p < 0.01). We therefore test religious and ethnic minorities separately in one of our subsequent models.Footnote 8
Table 1 presents separate linear regression models testing each of these scales as a determinant for secularism in Quebec and in the ROC. These results suggest that religiosity plays the most important role in explaining attitudes toward secularism in both regions, with a −0.3 to −0.37 coefficient (see models 2 and 4)—an effect more sizable than that of both other scales combined. Indeed, while liberalism and prejudice are both significantly negatively correlated with secularism, the effect is less considerable (−0.09 to −0.19), although greater in the ROC than in Quebec. Results therefore suggest that the effect of religiosity on secularism is similar in magnitude in Quebec and in the ROC, and that the gap in support for secularism might be partly driven by lower levels of religiosity in Quebec. In other words, we observe a difference in the intercepts of this relationship across regions, but not in the magnitude of their slopes. Finally, we note that the second most important predictor of support for secularism in Quebec is being a Francophone, which increases one's secularism score by 0.23 points on average—yet only by 0.08 points in the rest of the country.
Religiosity, liberalism, and prejudice as determinants of secularism (0–1)

*p < 0.05; **p < 0.01; ***p < 0.001.
Data: Synopsis, 2020 (n = 692 in Quebec, n = 724 in the Rest of Canada).
Method: Ordinary least squares.
Dependent variable: Six-item secularism scale (0–1).
Let's now turn to a more fine-grained analysis of the effect of religiosity on attitudes toward secularism. Our measurement strategy enables us to disaggregate religiosity into four indexes—anticlericalism, religious fundamentalism, social religiosity, and intrinsic religiosity. Figure 3 displays the regression coefficients of each of these indexes as determinants of support for secularism. Our first finding is that anticlerical attitudes provide a powerful explanation of support for secularism in both regions. Yet, while we might expect anticlericalism to have a distinct effect in Quebec as a result of the province's fraught relationship with the Catholic Church—Quebecers also score higher than other Canadians on the anticlericalism scale (see Figure B in the Annex)—we find that anticlerical feelings do not have differentiated effects on support for secularism: it is simply more widespread in Quebec.
Items of religiosity as determinants of secularism score. (a) Quebec and (b) Rest of Canada.
Note: Figure 3 represents the results from a multivariate regression model testing each item of the religiosity scale as a determinant of secularism score (0–1), controlling for being a Francophone, having Canadian citizenship, gender, age, income, and education. Figure 3(a) displays the correlation plot for Quebec (n = 617) and (b) for the Rest of Canada (n = 622). Error bars represent standard deviations from the coefficient (1 for the bold lines, 2 for the light lines) and the dotted vertical line indicates a regression coefficient of 0.
Data: Synopsis, 2020.

Since the baseline levels of negative feelings toward ethnic minorities and religious minorities differ across regions, we also need to test the effect of both types of prejudice separately. Figure 4 displays the descriptive relationship between both types of prejudice per region. Data suggest that the correlation between prejudice against ethnic and religious minorities is considerable in both regions, but stronger in the ROC (r = 0.67) than in Quebec (r = 0.52). In other words, prejudice toward ethnic minorities is a less powerful predictor of prejudice toward religious groups in Quebec, where heightened religious prejudice might rather be explained by the province's tense relationship with its own religious history.Footnote 9
Relationship between negative feelings toward ethnic and religious minorities. (a) Quebec and (b) Rest of Canada.
Note: Figure 4 displays the distribution of scores for negative feelings toward ethnic minorities scale and negative feelings toward religious minorities scale in Quebec (n = 974) and in the Rest of Canada (n = 1,026). The correlation coefficient between both variables is indicated for each region. A locally weighted scatterplot smoothing (including standard errors) visualizes the descriptive relationship between both scales.
Data: Synopsis, 2020.

Table 2 displays the results from a multivariate regression model testing negative feelings toward ethnic and religious minorities as determinants of support for secularism. Results show that while negative feelings toward religious minorities is the strongest predictor of support for secularism (0.25 in Quebec and 0.26 in the ROC), negative feelings toward ethnic minorities is a statistically significant negative predictor of support for secularism in Quebec. This directly opposes claims according to which support for secularism in Quebec would be fueled by ethnic prejudice. Moreover, in models 2 and 4, we test whether attitudes toward Quebecers themselves impact support for secularism. Indeed, having a positive perception of individuals living in Quebec—rather than a negative perception of ethnic/religious minorities—could have been positively correlated with support for the province's secular values. However, results suggest that feelings toward Quebecers are non-significant in the province itself and are even negatively correlated with support for secularism in the rest of the country.
Negative feelings toward ethnic and religious minorities as a determinant of secularism

*p < 0.05; **p < 0.01; ***p < 0.001.
Data: Synopsis, 2020 (n = 819 in Quebec, n = 825 in the Rest of Canada).
Method: Ordinary least squares.
Dependent variable: Six-item secularism scale (0–1).
In order to test whether the effect of our three explanatory variables—religiosity, liberalism, and prejudice (both ethnic and religious)—differs in nature between Quebec and the ROC, we need to estimate whether the relationships observed within the separate regional samples have different slopes (Figure C in the Annex presents the predicted probabilities from the linear models presented in Table 3). These results show that there is no significant interaction effect between religiosity and prejudice toward religious minorities and residing in Quebec. In other words, religiosity or ethnic prejudice does not hold additional explanatory power for attitudes toward secular arrangements in either region. However, results show that liberal attitudes have a disproportionate effect on secularism in Quebec compared to the ROC, which supports the hypothesis that liberal values might not be expressed similarly by Quebecers and other Canadians. The result differs from previously reported findings (Turgeon et al., Reference Turgeon, Bilodeau, White and Henderson2019, 256, Table 1), although the fact that our dependent variable is an index rather than a single item and that we oversampled Quebec respondents could explain the absence of variation across provinces in our data.
Interaction between explanatory variables and region of residence as determinants of secularism

*p < 0.05; **p < 0.01; ***p < 0.001.
Data: Synopsis, 2020 (n = 1,416).
Method: Ordinary least squares.
Dependent variable: Six-item secularism scale (0–1).
Discussion
The results presented in this paper allow us to draw a few conclusions. First, using our unique 25-item scale which ensures a comprehensive measure of religiosity, we show that Quebecers score lower than other Canadians on all dimensions, which accounts for a substantial part of the difference between Quebec and the ROC with regard to support for secularist policies. Though it cannot fully explain this difference, lower levels of religiosity among Quebecers account for some of the province's higher support for secularism. In addition, we find that once religiosity is disaggregated into more precise dimensions, anticlerical feelings play an independent role in explaining preferences for secularism. Anticlericalism indeed drives a substantial part of the observed effect on support for secularist policy among Canadians, regardless of regional differences. This finding, which confirms the role played by religiosity in explaining political behavior (Esmer and Pettersson, Reference Esmer, Pettersson, Dalton and Klingemann2009; Huber and Yendell, Reference Huber and Yendell2019; Ksiazkiewicz and Friesen, Reference Ksiazkiewicz and Friesen2021), also highlights the importance of conceptual and methodological sophistication in modeling the effect of religiosity.
Second, differences in the understanding of what liberal values entail exist between Quebecers and other Canadians. Our results show that Quebecers are slightly more liberal than other Canadians on a range of issues from same-sex marriage to abortion, yet these liberal values constitute a crucial part of the explanation for Quebec's heightened support for secularism, especially among Francophones. This explanation supports the argument made by other scholars that liberalism as it is found in Quebec is somewhat distinct from the form of liberalism that dominates in the rest of the country, and that these two variants of liberalism have differentiated effects on public preferences toward secularism (Turgeon et al., Reference Turgeon, Bilodeau, White and Henderson2019).
Third, we find a particular dynamic between support for secularism and attitudes toward minority groups in Quebec. Although negative attitudes toward religious minorities are related to support for secularism, attitudes toward ethnic minorities are less so. Low levels of religiosity among Quebecers, especially Francophones, are strongly associated with less favorable opinions toward religious minorities, but not toward ethnic minorities. This finding suggests that scholars should make a clear distinction between religious and ethnic minorities in evaluating preferences toward secularism.
Overall, our findings represent an addition to our understanding of the different dynamics that drive the controversial debate over secularism in Quebec and Canada. What distinguishes both “solitudes” is not simply language but also religion (Gidengil, Reference Gidengil1992; Johnston, Reference Johnston2017) and, as this article argues, religiosity. Both Quebec and the ROC have historically progressed through vastly distinct religious ecosystems and this reality still informs their respective political landscapes. Such cultural differentiation between Quebec and Canadian publics is now reflected in incompatible policy preferences about state secularism. This fact ought to be taken into consideration in assessing the nature of the conflict over the place and role of religion—including mere symbolic religious displays—in public life as debates over Quebec's secularist legislation move forward.
Financial support
The study did not benefit from outside funding.
Competing interests
None.
Annex
Scale items and factor loadings


Support for secularism across population subgroups

Secularism item scores by region.
Note: Figure A represents the average scores for Quebec (n = 974) and for the Rest of Canada (n = 1,026) on each of the items composing the secularism scale (0–1). Error bars represent the 95% confidence intervals around the sample mean.
Data: Synopsis, 2020.

Levels of religiosity in Quebec and Canada by dimensions of religiosity.
Note: Figure B shows details for religiosity and each of its dimensions. Anticlericalism is coded in reverse.
Data: Synopsis, 2020 (n = 974 in Quebec, n = 1,026 in the Rest of Canada).

Predicted probabilities for religiosity, liberalism, ethnic prejudice, and religious prejudice on secularism score.
Note: Lines represent predicted probabilities computed from the multivariate model of Table 3, column 2.
Data: Synopsis, 2020 (n = 1,239).

Alexis Bibeau is a Ph.D. candidate in politics at the University of Virginia. His work has recently been published in the Canadian Journal of Political Science, the International Journal of Media & Cultural Politics, and Nations & Nationalism.
Evelyne Brie is an assistant professor of political science at the University of Western Ontario. She holds a Ph.D. in political science from the University of Pennsylvania. Her most recent work has been published in the British Journal of Political Science and French Politics as well as at Laval University Press.
Yannick Dufresne is the leadership chair in the Teaching of Digital Social Sciences and an assistant professor at Université Laval's Department of Political Science. He specializes in the study of public opinion, political communication, and elections. He holds a Ph.D. in political science from the University of Toronto. He has contributed to design and development of several large-scale data collection efforts. His research has been published in various journals including Political Analysis, British Journal of Political Science, Journal of Elections, Public Opinion and Parties and Canadian Journal of Political Science.
Gilles Gagné is a retired professor of sociology from Laval University in Québec City. His research interests focus on the theory of postmodern societal transition. He is a co-founder of the Groupe interuniversitaire d’études de la postmodernité who publishes the yearly Cahiers Société.


 Open access