


Overweight and obesity continue to grow as a global epidemic(Reference Finucane, Stevens and Cowan1,Reference Ng, Fleming and Robinson2) . The prevalence of obesity has almost tripled since 1975(3). The current prevalence of overweight and obesity among adults in Australia is 67 %(4) and 52 % worldwide(3). Being overweight is a risk factor for many chronic diseases (e.g. CVD) and is associated with increased mortality(5). Dietary intake is a modifiable lifestyle factor for overweight and obese individuals(6,Reference Grima and Dixon7) .
Avocados are a rich source of key nutrients including MUFA, dietary fibre, potassium, Mg and phytochemicals(8,Reference Dreher and Davenport9) . Epidemiological evidence suggests that avocado consumers have a significantly higher diet quality than non-consumers(Reference Fulgoni, Dreher and Davenport10). Avocado consumers are also reported to have significantly lower body weight and BMI than non-consumers(Reference Fulgoni, Dreher and Davenport10,Reference Heskey, Oda and Sabaté11) . Research has suggested that the high fat and fiber composition of avocados may contribute to weight loss by maintaining satiety and changing gut-microbiota composition(Reference Henning, Yang and Woo12). A study has also found that isoenergetic substitution of foods with avocados in a lunch meal resulted in an increased post-ingestive satiety during a 5-h period in overweight and obese adults(Reference Wien, Haddad and Oda13). Research also suggests that including avocados in a moderate fat and cholesterol-lowering pattern of eating may contribute to additional improvements in blood lipids in overweight and obese individuals(Reference Wang, Bordi and Fleming14). However, research on the health benefits of avocados in the Australian context is limited. The aim of the study was, therefore, to perform a secondary analysis of the 2011–2012 the National Nutrition and Physical Activity Survey (NNPAS) to quantify avocado consumption in the Australian population and explore the associations between avocado intakes, consumption of nutrients and food groups and anthropometric measurements of the participants.
Methods
Study population
The present analysis used the 2011–2012 NNPAS from the Confidentialised Unit Record Files. The 2011–2012 NNPAS, as a component of the Australian Health Survey 2011–2013, was a cross-sectional, nationally representative survey conducted by the Australian Bureau of Statistics(15). The survey sampled householders in private dwellings in all states and territories (n 8) applying a multistaged, stratified-area, probability sampling design. The sample included 12 153 Australians aged 2 years and older (77 % response rate)(15). Population weights were applied to ensure that the data were representative of the wider Australian population. Detailed information on the methods of the survey has been published elsewhere(15). Ethics approval for conducting the household interview components of the survey was allowed under the Census and Statistics Act 1905(15).
Food and nutrient intake assessment
Dietary intake was assessed with two 24-h recalls conducted on separate days using the Automated Multiple-Pass Method(Reference Bliss16). The first 24-h recall was completed in person by all participants, with a second 24-h recall completed via telephone at least 8 days after the first interview in approximately 63 % of participants(15).
Dietary intake data were analysed using the AUSNUT 2011–2013 food composition database, which applies a nested hierarchical structure of major, sub-major and minor food groups(8). The key nutrients examined were total fat (g), saturated fat (g), monounsaturated fat (g), polyunsaturated fat (g), carbohydrate (g), protein (g), dietary fibre (g), vitamin E (mg), Mg (mg), Na (mg) and potassium (mg). The selection of nutrients was based on those found to vary between ‘avocado consumers’ and ‘non-consumers’ in a representative sample in the USA(Reference Fulgoni, Dreher and Davenport10). The Australian Dietary Guidelines database(17) was applied to aggregate the dietary intake data to food group serves based on a published method(Reference Zoszak, Neale and Tapsell18), including ‘grains’, ‘whole grains’, ‘vegetables’, ‘fruit’, ‘milk and alternatives’ and ‘meat and alternatives’. Intakes of discretionary food items, which are high in saturated fat, added salt, added sugars and alcohol (e.g. sugary drinks, sweet biscuits, cakes, confectionary, salty snack foods and processed meats), were identified using the Discretionary Food List(19). One serve of a discretionary food or alcoholic beverage was defined as containing 600 kJ or 10 g alcohol, respectively(6).
Avocado intake estimation
Avocado (Persea Americana) is an almost pear shaped fruit with a green to black shiny skin and a delicate yellow flesh with a green outer hue(17). Consumption of the avocado is generally without the seed or the skin. Avocado consumption was estimated using an avocado-specific database developed by our team(Reference Guan, Neale and Probst20). The avocado-specific database was created based on the AUSNUT 2011–2013 food composition database(17). The majority of nutrient data related to avocados were derived from a composite of eight samples of Hass avocados purchased in five Australian states(21). Thus, it can be assumed that the Hass avocado is closely related to the AUSNUT 2011–2013 entry for the whole avocado(17). The avocado-specific database represents avocados as a whole food item only, and avocado oil was excluded. Whole avocados and avocado-containing products were included in the present analyses. Avocado intakes were explored in grams per day. The percentage of a composite food product containing avocados was multiplied by the total weight of the product to determine the amount of avocado (in grams) consumed by each participant for each composite product.
Outcome assessment
Demographic characteristics including the age, sex and education level were used. In the 2011–2012 NNPAS, the highest level of non-school educational attainment was self-reported by participants aged 15 years and over(15). As education level was defined as the level of non-school education, data for participants who were currently attending school (i.e. children aged <18 years) were excluded from all regression analyses. Self-reported physical activity information was collected for participants aged 18 years and over. This information was categorised into levels of physical activity, outlined in further detail elsewhere(15). Measurement of height (cm), body weight (kg) and waist circumference (cm) was recorded to one decimal place, using a stadiometer, digital scales and a metal tape measure, respectively(15). BMI was calculated as weight (kg) divided by height (m) squared. Waist circumference was taken at the top of the umbilicus(15).
Statistical analysis
All statistical analyses were conducted using Stata/IC Version 15 (version 15, StataCorp, 2017). To account for the survey design, sampling process and provide unbiased estimates, replicate weightings were applied using jack-knife resampling in the present analysis(Reference Birrell, Steel and Batterham22). A set of replicate weights and personal weights was supplied with the Confidentialised Unit Record Files. Commands were conducted in Stata using the complex design model, with details and the Stata codes on how to use replicate weight in NNPAS published elsewhere(Reference Birrell, Steel and Batterham22).
Usual intakes of key nutrients, dietary energy and food groups were calculated from the two 24-h recalls using the Multiple Source Method(Reference Harttig, Haubrock and Knüppel23) regression model. Mean and 95 % CI and median and 25th and 75th percentiles for avocado consumption (as grams per day) were determined for all participants. Participants were categorised into sub-samples as either ‘avocado consumers’ or ‘non-consumers’, and the proportion of ‘avocado consumers’ and ‘non-consumers’ was determined. To examine avocado intakes in different population groups, the mean avocado intakes in the NNPAS sample and for ‘avocado consumers’ (as grams per day), as well as avocado consumption stratified by age group and sex, were examined. Avocado consumption was compared across age and sex categories using linear regression with pairwise comparisons of marginal linear predictions with Bonferroni adjustments. Food groups and nutrients intake were also compared between consumers and non-consumers using linear regression with pairwise comparisons of marginal linear predictions. The relationship between avocado intakes and the reported consumption of key nutrients and food groups was explored using survey-adjusted linear regression, which were adjusted for confounding using age, sex and usual energy intake (kilojoules per day). Linear regression was performed to explore the association between avocado consumption and anthropometric measures (weight, BMI and waist circumference), which were adjusted for confounding using age, sex usual energy intake (kilojoules per day) and physical activity. Directed acyclic graphs were created to guide the selection of covariates for the analysis(Reference Williamson, Aitken and Lawrie24) (online Supplementary Fig. 1). Linearity, homoscedasticity and normality of residuals were checked for all variables for all regression analyses. A two-tailed P-value < 0·05 was considered significant.
Results
Avocado intake
Among Australians overall, the mean reported avocado intake was 2·56 (95 % CI: 2·37, 2·75) grams per day. Median avocado consumption was 0·00 (25th and 75th percentiles: 0·00–0·00) grams per day. From the NNPAS results, 15·9 % of Australians were found to be ‘avocado consumers’ and 84·1 % were ‘non-consumers’. When the analysis was limited to ‘avocado consumers’ only, the mean avocado intake was 16·09 (95 % CI: 15·41, 16·78) grams per day, with a median intake of 11·37 (25th and 75th percentiles: 6·84–21·19) grams per day.
For all participants, the highest avocado intakes were in adults aged 18–64 years (mean: 2·37 g, 95 % CI: 2·02, 2·72 for males; mean: 3·70 g, 95 % CI: 3·37, 4·04 for females) (Table 1). For ‘avocado consumers’, there were no significant differences in avocado intake among males across the age groups. For female ‘avocado consumers’, those aged 18–64 years consumed significantly higher amounts of avocados than older adults (P = 0·044), with no significant differences seen between children. The highest avocado intake among ‘avocado consumers’ was observed in children 2–8 years (mean: 19·07 g (95 % CI: 11·02, 27·12) for males, mean: 19·24 g (95 % CI: 12·96, 25·52) for females). Among ‘avocado consumers’, there was no significant difference in avocado intakes between education levels (Table 2).
Mean (95 % confidence interval) and median (25th and 75th percentiles) avocado consumption by sex and age groups, for all Australians, and ‘avocado consumers’ only, 2011–2012 National Nutrition and Physical Activity Survey (NNPAS)*,†,‡
(Mean values and 95 % confidence intervals; median values and percentiles)
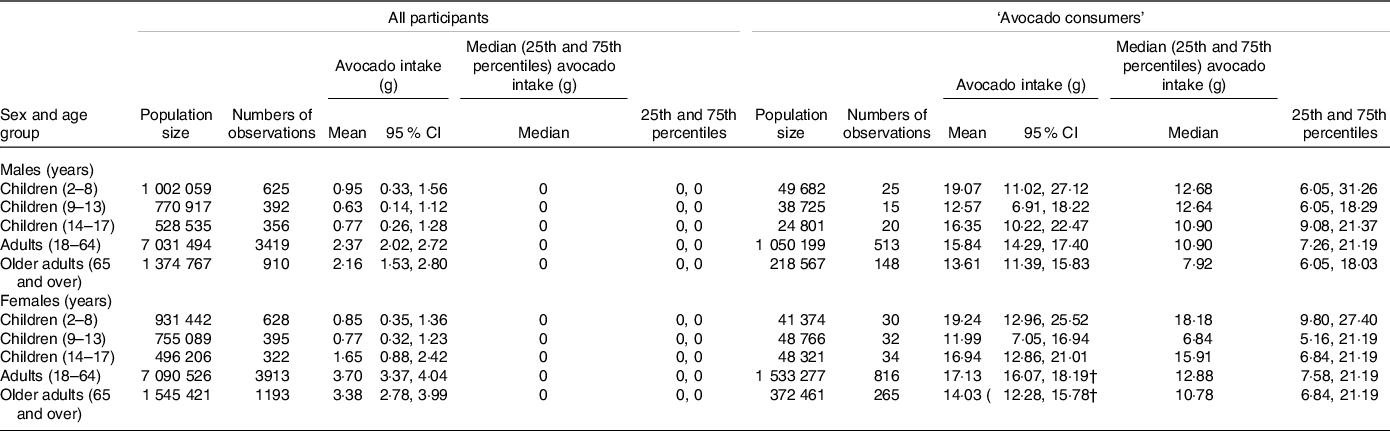
* Complex design using a jack-knife procedure with the replicate weights.
† Australians: population size: 21 526 456, number of observations: 12 153; ‘avocado consumers’: population size: 3 426 173, number of observations: 1898.
‡ Indicate significant differences (P < 0·05) between groups after Bonferroni adjustment.
Mean (95 % confidence interval) and median (25th and 75th percentiles) avocado consumption by education level, for ‘avocado consumers’ only, 2011–2012 National Nutrition and Physical Activity Survey (NNPAS)*,†
(Mean values and 95 % confidence intervals; median values and percentiles)
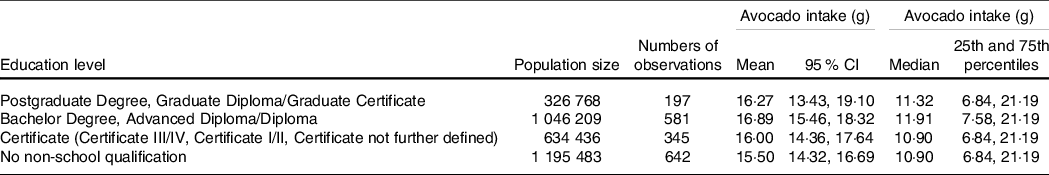
* Complex design using a jack-knife procedure with the replicate weights.
† Australians: population size: 21 526 456, number of observations: 12 153; ‘avocado consumers’: population size: 3 426 173, number of observations: 1898.
Associations between avocado intake and dietary intakes
Compared with non-consumers, the intakes of avocado consumers were significantly higher in monounsaturated fats, polyunsaturated fats, dietary fibre, vitamin E, Mg and potassium (all P < 0·001) (Table 3). Avocado consumers had significantly higher intakes of ‘whole grains’ (P < 0·001), ‘vegetables’ (P < 0·001), ‘fruit’ (P = 0·002) and ‘meat and alternatives’ (P = 0·004) and lower intake of ‘grains’ (P < 0·001), ‘milk and alternatives’ (P = 0·012) and ‘discretionary foods’ (P < 0·001).
Average (95 % confidence interval) daily nutrient intakes and serving intakes of the Australian dietary guidelines food groups for avocado consumers and non-consumers*,†
(Average and 95 % confidence intervals)
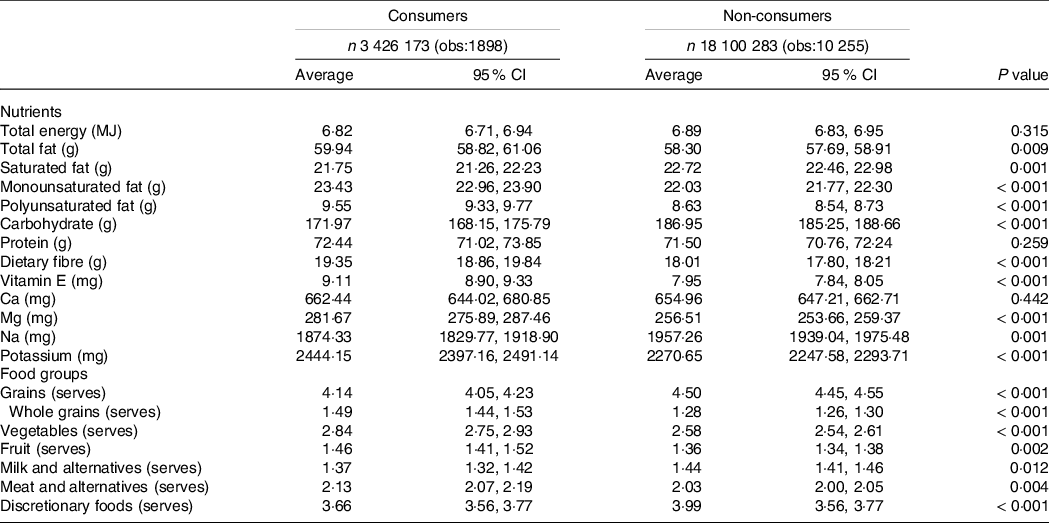
* Complex design using a jack-knife procedure with the replicate weights.
† Australians: population size: 21 526 456, number of observations: 12 153.
Linear regression for avocado consumption (g), nutrients and food groups using the 2011–2012 NNPAS*,†,‡
(Coefficient and 95 % confidence intervals)
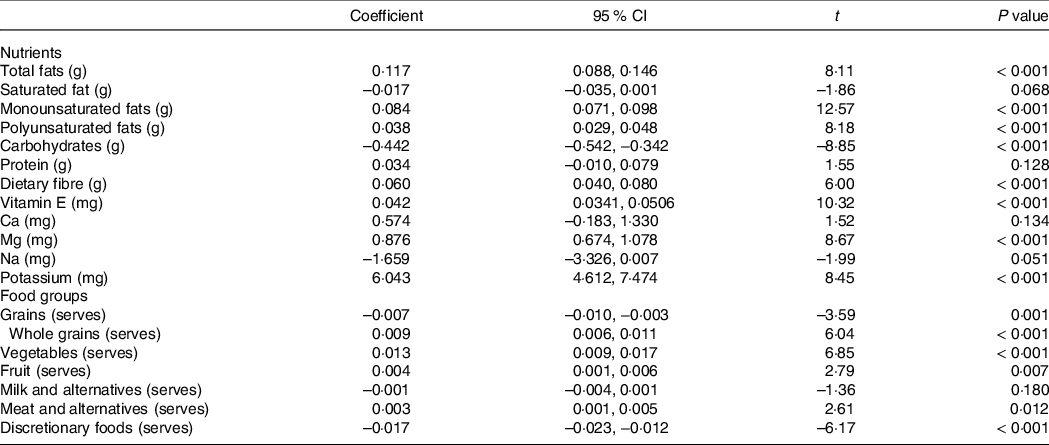
* Complex design using a jack-knife procedure with the replicate weights.
† Australians: population size: 21,526,456, number of observations: 12 153; ‘avocado consumers’: population size: 3 426 173, number of observations: 1898.
‡ Adjusted for age, sex and usual energy intake (kilojoules per day).
After adjusting for covariates, greater consumption of grams of avocados was associated with significantly higher consumption of monounsaturated fats (P < 0·001), polyunsaturated fats (P < 0·001), dietary fibre (P < 0·001), vitamin E (P < 0·001), Mg (P < 0·001) and potassium (P < 0·001), as well as ‘whole grains’ (P < 0·001), ‘vegetables’ (P < 0·001), ‘fruit’ (P = 0·007) and ‘meat and alternatives’ (P = 0·012) food groups. Non-significant associations were found between avocado consumption and saturated fats (P = 0·068), protein (P = 0·128), Ca (P = 0·134), Na (P = 0·051) and ‘milk and alternatives’ (P = 0·180). Greater consumption of avocados was associated significantly to lower consumption of carbohydrates and discretionary foods (all P < 0·001).
Associations between avocado consumption and anthropometric measures
The associations between avocado intake and anthropometric measures were explored in participants aged 18 years and older (Fig. 1). When adjusted for covariates, greater consumption of avocados was significantly associated with a lower body weight (kg) (coefficient: –0·05, 95 % CI: –0·11, –0·01, t: –2·17, P = 0·034), BMI (kg/m2) (coefficient: –0·03, 95 % CI: –0·04, –0·01, t: –3·64, P < 0·001) and waist circumference (cm) (coefficient: –0·07, 95 % CI: –0·10, –0·03, t: –3·83, P < 0·001).
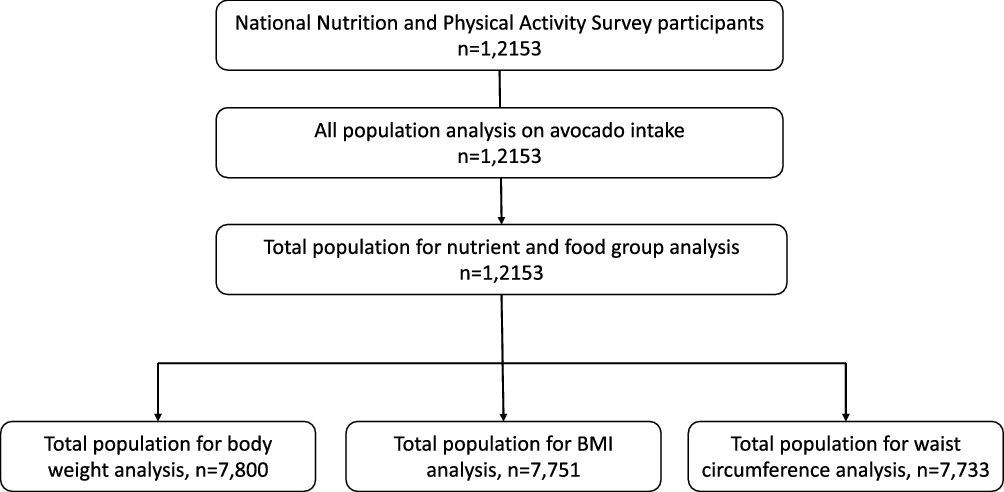
Participant flowchart for secondary analysis of the Australian Health Survey, National Nutrition and Physical Activity Survey component
Discussion
To our knowledge, this study is the first to examine avocado consumption among Australians using a representative national survey. This is also the first study to investigate the associations between avocado consumption and anthropometric outcomes. A novel avocado-specific database was applied to assess avocado consumption from all food sources including those foods in mixed dishes. This research offers insights into avocado consumption in Australia, as well as associations between the intakes of avocados, key nutrients and food groups based on the Australian Dietary Guidelines.
The present study highlighted the importance of developing an avocado-specific database to accurately estimate avocado intake. The proportion of avocado consumers (defined as consuming the whole avocado only) in the USA population (≥ 19 years of age) was suggested to be approximately 2 % (n 347), which was identified from several cycles of NHANES (2001–2008)(Reference Fulgoni, Dreher and Davenport10). The discrepancy in the finding between the present analysis and the USA cohort may be due to the food composition data used to estimate the avocado intakes. In the present study, avocados were consumed not only as whole fruit but also from composite (multi-ingredient) foods, such as guacamole, sushi, hamburgers and Mexican style dishes. The avocado intake, therefore, appears to be underestimated by limiting the measurement of avocado consumption to the whole avocado alone. Thus, to facilitate an accurate estimation of avocado intake, a systematic approach is required to include specific information for avocado and avocado-containing foods, including composite foods.
The findings show that avocado consumption was associated with favourable intakes of key nutrients and food groups based on the Australian Dietary Guidelines. These favourable nutrient intakes are consistent with previous epidemiological and clinical data(Reference Fulgoni, Dreher and Davenport10,Reference Park, Edirisinghe and Burton-Freeman25–Reference Zhu, Huang and Edirisinghe27) . Although avocado consumers had higher intakes of fruit and vegetables as suggested by the present analysis and the USA cohort analysis, Fulgoni et al reported that there were no significant differences between avocado consumers and non-consumers for intakes of total grains, whole grains, dairy, meat and beans and discretionary fats in the USA cohort(Reference Fulgoni, Dreher and Davenport10). The differences in the food supply and definitions of food groups between Australia and the USA may contribute to these differences in food group intakes. Further, the literature has suggested that education level may be positively associated with diet quality(Reference Hiza, Casavale and Guenther28). While diet quality was not specifically addressed in the present study, the lack of an association between avocado intake and education level is of interest as a previous analysis of the NNPAS has indicated that Australians with higher education levels consume higher intakes of nuts, another core food(Reference Nikodijevic, Probst and Batterham29). It is, therefore, worthwhile that the relationship between avocado intakes and education level is further investigated. Avocados are a good source of MUFA, dietary fibre, potassium and Mg(8,Reference Dreher and Davenport9) . Given energy intake was not different between consumers and non-consumers identified by literature(Reference Fulgoni, Dreher and Davenport10) and the present analysis, avocado consumption may be an indicator of improved diet quality. This may in part be due to the contribution of the avocados to intakes of key nutrients. It is also possible that the consumption of avocados may facilitate the consumption of other core foods, as our team has previously found for another core food, nuts(Reference Neale, Tapsell and Martin30).
As avocados are suggested to be a medium energy density food item(Reference Dreher and Davenport9), it is pertinent to examine the association between avocado consumption and anthropometric outcomes. The present findings suggest that avocado consumption was inversely associated with body weight, BMI and waist circumference, aligning with previous epidemiological and clinical studies(Reference Fulgoni, Dreher and Davenport10–Reference Henning, Yang and Woo12). The benefits of avocado consumption on weight management may be attributed to various components including dietary fiber by maintaining satiety and changing gut-microbiota composition. The literature suggests that the volume of a meal plays a role in influencing satiety(Reference Rolls31). Adding whole avocado to a meal tends to increase the meal volume similar to other fruit and vegetables(Reference Wien, Haddad and Oda13). Further, isoenergetic substitution of foods with avocados in a meal has resulted in an increased post-ingestive satiety and reduced motivation to eat in overweight and obese adults(Reference Wien, Haddad and Oda13,Reference Zhu, Huang and Edirisinghe27) . Clinical data also show that avocado consumption can increase the abundance of gut bacteria involved in plant polysaccharide fermentation in overweight and obese adults(Reference Henning, Yang and Woo12,Reference Thompson, Bailey and Taylor26) . The changes in the gut bacterial composition may lead to a change in energy utilisation in the large intestine(Reference Henning, Yang and Woo12). Avocados contains approximately 13 % fat, of which 74 % are represented as MUFA(17). The fat profile of avocados may play a role in body composition among avocado consumers. The literature suggests that the intake of MUFA may contribute to stimulating the expression of leptin mRNA, which assists in regulating energetic homoeostasis(Reference Rostami, Samadi and Yuzbashian32). Diets rich in MUFA appear to favour satiety and reduce food intake(Reference Silva Caldas, Chaves and Linhares Da Silva33). Intake of MUFA may also increase thermogenesis promoting greater energy expenditure and lower fat storage(Reference Casas-Agustench, López-Uriarte and Bulló34). Therefore, it seems that the fibers and MUFA present in avocados may regulate satiety signalling and thermogenesis to favour of body weight control. In addition, avocado consumption as associated with favourable diet quality should also be considered(Reference Fulgoni, Dreher and Davenport10). As such, the inverse relationship between avocado consumption and anthropometric measures may be contributed by avocado consumers eating a healthier diet overall.
While assessing avocado consumption derived from a representative national survey has many strengths, it is not without limitations. First, the present study was a secondary analysis of a cross-section survey. Therefore, the causal evidence between avocado consumption, intakes of nutrients and food groups and anthropometric outcomes cannot be established. Second, as the proportion of avocado consumers in the analysis was small, the power of analyses may be limited. While dietary intake was collected using the Automated Multiple-Pass Method, self-report dietary intake data are prone to recall bias. The data may be biased due to over-reporting or under-reporting foods to conform to societal norms. It should be noted that this study did not exclude respondents who were considered to be misreporting their intakes. To ensure that avocado intakes could be compared across the population, avocado consumption was presented in grams rather than as a percentage of energy. It should be noted that comparison of consumptions across age and sex groups may be affected by total energy intakes. Finally, although directed acyclic graphs were used to guide the decision of covariates for analyses, it is possible that other confounding variables were present that may have affected the results. Therefore, the findings of the present analysis should be interpreted accordingly.
Conclusion
This study is the first to explore avocado consumption in a representative Australian sample which accounted for avocado from all sources. The use of a national representative estimate makes it possible to generalise findings to the population at large. The findings suggest that there were significant associations between avocado consumption and a higher intakes of key nutrients and food groups based on the Australian Dietary Guidelines intakes and lower body weight, BMI and waist circumference. These results suggest that the incorporation of avocado in the diet may support favourable diet quality and be associated with a lower body weight, BMI and waist circumference.
Acknowledgements
This work was supported by the Hass Avocado Broad and the Avocado Nutrition Centre (C2021-0016).
Conceptualisation, Y. P., E. N. and V. G.; methodology, Y. P, E. N. and V. G.; validation, V. G. and Y. P.; formal analysis, V. G.; data curation, V. G.; writing – original draft preparation, V. G.; writing – review and editing, Y. P., E. N. and V. G.; supervision, Y. P. and E. N.
The funders had no role in the design of the study; in the collection, analyses or interpretation of data; in the writing of the manuscript or in the decision to publish the results.
Supplementary material
For supplementary material/s referred to in this article, please visit https://doi.org/10.1017/S0007114521003913


 Open access