

The earliest known report of evolved herbicide resistance in weeds dates back to 1957 (Hilton Reference Hilton1957). After that first reported case, however, herbicide resistance remained a relatively uncommon problem for nearly 30 yr. In the United States, only 11 cases of evolved herbicide resistance had been confirmed before 1980, 9 of which were resistant to atrazine or similar photosystem II–inhibiting herbicides (Heap Reference Heap2017). The relative rarity of new herbicide-resistance cases led some to proclaim that herbicide resistance in weeds was “not likely to spread” and “does not appear to be a major threat in the future” (Parochetti Reference Parochetti1978). It is indisputable that herbicide-resistant weeds have spread and are now a major economic problem faced by farmers around the world. Some have gone so far as to claim that, if left unchecked, herbicide resistance could “threaten the sustainability” of some crop production systems (Gaines et al. Reference Gaines, Zhang, Wang, Bukun, Chisolm, Shaner, Nissen, Patzoldt, Tranel, Culpepper, Grey, Webster, Vencill, Sammons, Jiang, Preston, Leach and Westra2010).
Mixtures of effective herbicides may be among the most important factors in prevention and management of herbicide-resistant weeds (Beckie and Reboud Reference Beckie and Reboud2009; Evans et al. Reference Evans, Tranel, Hager, Schutte, Wu, Chatham and Davis2015). Weed scientists recognized that herbicide mixtures could be an important tool for resistant weed management long before resistance was a major problem (Gowing Reference Gowing1960). Since then, herbicide diversity in the form of mixtures has been demonstrated empirically to reduce the likelihood of resistant weed evolution under field conditions (Beckie and Reboud Reference Beckie and Reboud2009; Evans et al. Reference Evans, Tranel, Hager, Schutte, Wu, Chatham and Davis2015). This is something of a paradox with respect to herbicide-resistant weed management; selection pressure for new resistant weeds will inevitably increase as herbicide use increases, but increasing herbicide mixtures reduces the likelihood of new resistant weeds, at least in the short-term. It has been theorized, however, that this relationship is less true for non–target site based resistance mechanisms over the long term, thereby increasing the potential negative environmental effects for marginal long-term benefit (Mortensen et al. Reference Mortensen, Egan, Maxwell, Ryan and Smith2012).
Some have speculated that the adoption of genetically engineered (GE) glyphosate-resistant crops has exacerbated the problem of “superweeds” (e.g., see Gilbert Reference Gilbert2013). The term “superweeds” has no technical definition, and its use in the media has caused a great deal of confusion about the impacts of herbicide use and GE crops (Kniss Reference Kniss2014). In many cases, use of this term is associated with herbicide resistance, especially as it relates to the use of GE crops. Certainly, the widespread adoption of GE crops and the associated increase in glyphosate use (Benbrook Reference Benbrook2016) has dramatically increased the selection for glyphosate-resistant weeds. But as glyphosate use has increased, use of some other herbicides has decreased (Kniss Reference Kniss2017), and it is therefore plausible that the rate of resistance evolution to other herbicides has decreased as resistance to glyphosate increased. To date, there has been no rigorous investigation into the broader question of whether adoption of GE crops has increased selection for herbicide-resistant weeds in general, or simply shifted selection pressure away from other herbicides to glyphosate.
The objective of this analysis was to identify trends in herbicide use and evolution of herbicide-resistant weeds in the United States, especially as they relate to adoption of GE herbicide-resistant crop varieties. Three widely adopted GE herbicide-resistant crops (corn, cotton, and soybean) were analyzed, as well as three non-GE crops (rice [Oryza sativa L.], spring wheat [Triticum aestivum L.], and winter wheat). Because there was no “control” group in the adoption of GE crops, it is important to compare the observed trends in herbicide use from GE crops with broader trends observed in non-GE crops. Otherwise, it is possible to attribute broad trends observed throughout agriculture to the choice of growing GE crops. If the herbicide use trends observed in GE crops are substantially different from non-GE crop trends, then there is a greater likelihood that those trends are at least partially attributable to GE crop adoption. However, if the trends are similar for all crops, regardless of whether herbicide-resistant GE varieties are available, then it is more difficult to attribute the trends to GE crops.
Methods
Data Sources
In this analysis, two independent data sources have been used to evaluate the impacts of herbicide use in U.S. crops on the evolution of herbicide-resistant weeds. The first data set includes herbicide-resistance cases in the United States through 2015 from the Herbicide Resistance Action Committee (HRAC) International Survey of Herbicide Resistant Weeds (Heap Reference Heap2017). The HRAC website lists documented cases of herbicide resistance, so it is a direct measure of herbicide-resistant weed evolution. However, the HRAC database is almost certainly an underestimate of actual herbicide-resistance cases. Novel resistance cases (like the first documented case of resistance for a species to a herbicide’s site of action [SOA]) are highly likely to be reported to the survey. As resistance to a herbicide family becomes common and widespread, it becomes less likely that each individual new case of herbicide-resistant weeds will be reported by weed scientists to the survey. Therefore, there is some inherent selection bias toward new resistance mechanisms or species at the expense of additional cases of already reported herbicide–species combinations. Still, this rich data source is unique, as no other data set exists that is as extensive or useful for making direct estimates of herbicide resistance.
To reduce the impact of selection bias, all new cases of resistance for a SOA in a weed species were analyzed instead of all individual cases, since weed scientists are more likely to report the first case of resistance to a particular SOA in a new weed species. For example, because there are already hundreds of cases of resistance to acetolactate synthase (ALS)-inhibiting herbicides, weed scientists are unlikely to continue submitting additional populations of resistance in weed species that are well known. However, the first case of ALS-inhibitor resistance in a new species is still likely to be reported, as it represents a novel contribution. Therefore, the rate of resistance showing up in new weed species is at least a reasonable measure of the likelihood of resistance evolution to a particular SOA over time.
Using species-level data instead of cases also avoids the confounding factor of spread of an infestation by pollen or seed movement from one area to another, which would bias the data in favor of cases where the resistance has moved through pollen or seed from one area to another. Weed species mobility at the field or regional level is a function of weed biology, geography, and crop management practices and independent of herbicide use patterns. This analysis provides an estimate of the likelihood of new species evolving resistance, not the relative ecological or economic impact of those resistant species. However, it is worth noting that the number of resistant species and the number of total resistance cases are highly correlated (Pearson’s correlation coefficient=0.85, P=0.001), and therefore, analyzing the number of unique cases of resistance instead of new species would probably lead to similar conclusions (Supplementary Figure 1).
Data for herbicide use and crop-planted area were downloaded from the USDA National Agricultural Statistics Service (USDA-NASS 2017) website (quickstats.nass.usda.gov) for all available years between 1990 and 2015. For each herbicide active ingredient included in the USDA-NASS data, the herbicide’s SOA was recorded as categorized by the Herbicide Handbook (Shaner Reference Shaner2014) (Table 1).
Weed Science Society of America (WSSA) herbicide site of action group numbers and target sites for herbicides used in corn, cotton, soybean, rice, and wheat in the United States between 1990 and 2015. Abbreviations used in figure legends are provided in parentheses.
1 Group numbers and herbicide sites of action are reproduced from Shaner et al. (Reference Shaner2014), Herbicide Handbook, 10th edition.
Area-Treatments
One area-treatment is roughly defined as the number of times one herbicide was applied to one field. Area-treatments were used as a way to standardize herbicide application rates in terms of selection pressure for resistant weeds, since simply presenting the weight of each active ingredient would be misleading. For example, 1 kg of glyphosate (close to the field use rate) would be very different from 1 kg of imazethapyr (which would represent more than 10 field applications) when it comes to the likelihood of selecting for resistance. But 1 area-treatment of both herbicides would suggest that each herbicide was applied at the average use rate one time.
To calculate area-treatments, the total amount of each herbicide active ingredient applied per crop per year was divided by the average application rate within each crop for each year, then further divided by the number of planted hectares of that crop in that year (Equation 1). Area-treatments are unitless and provide an estimate of the proportion of crop area treated with a particular herbicide’s SOA; if a herbicide, on average, were applied to 20% of all crop area, then it would have a value of 0.2 area-treatments for that year. It is possible (common, in fact) for the total number of area-treatments to exceed 1 (or 100% of total crop area). For example, a value of 2 area-treatments could be obtained in several ways, by applying two different herbicides at full rates in a tank mixture to the same field (1+1=2), or by applying the same herbicide to the same field twice (1*2=2), or even by applying four different herbicides at half their average application rates to the same field (0.5+0.5+0.5+0.5=2).
 $${\rm area}\,{\rm treatment}\, {\equals}\, {{{\rm amount}\!/\!{\rm rate}} \over {{\rm area}}}$$
Diversity and Evenness
Simply looking at diversity of herbicide active ingredients would be misleading with respect to herbicide-resistance selection, since many herbicides share the same SOA. If a weed population evolves resistance to any single herbicide, it is possible (and sometimes likely) that the weed will be resistant to other herbicides with the same SOA. SOA diversity, therefore, is a better indicator of selection pressure for herbicide-resistant weed biotypes. Even this approach is not perfect, since not all SOAs will provide effective control of all weed species. However, it is appropriate for looking at national-level data that encompass a broad swath of climates and weed species. Herbicide SOA diversity and evenness was derived by first calculating Shannon’s entropy (Shannon Reference Shannon1949) using Equation 2:
 $$H\, {\equals}\, {\minus}\!\!\!\mathop{\sum}\limits_{{\rm SOA}\, {\equals}\, 1}^n {P_{{{\rm SOA}}} {\rm ln}\left( {P_{{{\rm SOA}}} } \right)} $$
where H is Shannon’s entropy, n is the total number of herbicide SOAs used in each crop, and P SOA is the proportional number of area-treatments for each herbicide’s SOA. Shannon’s entropy has been broadly applied across many disciplines, but was originally developed to measure entropy within the context of cryptography and information theory (Shannon Reference Shannon1949). It is among the most common measures used to quantify species diversity by ecologists and is well-suited to quantifying the diversity of herbicides used in various crops. Herbicide SOA diversity was then calculated from Shannon’s entropy (Jost Reference Jost2006; MacArthur Reference MacArthur1965) using Equation 3:
 $${\rm SOA}\,{\rm diversity}\, {\equals}\, {\rm exp}\left( H \right)$$
Aguilar et al. (Reference Aguilar, Gramig, Hendrickson, Archer, Forcella and Liebig2015) used a similar approach to estimate crop species diversity trends in the United States. Finally, Shannon’s equitability (E) was calculated as a measure of SOA evenness (Equation 4):
 $$E\, {\equals}\, {H \over {{\rm ln}\left( n \right)}}$$
where all previous definitions of variables apply.
SOA diversity values can be used to compare herbicide programs within a crop over time, but also to compare SOA diversity among crops. Unlike SOA diversity, evenness values should only be used to identify trends within a crop and not used to compare herbicide diversity among crops. Evenness is constrained to minimum and maximum values of 0 and 1, respectively. As herbicide SOA become more evenly distributed, evenness increases. As evenness approaches 1, it suggests that all herbicide SOAs used in a particular crop are equally represented within the data set.
Resistance Trends
Linear regression was used to determine the rate of new herbicide-resistant species over time. A similar analysis was conducted individually for all herbicide SOAs with at least 25 cases of documented resistance. For all linear models regressing resistance evolution over time, a break-point analysis was conducted to determine whether the relationship between resistance evolution and time exhibited a broken-line relationship. It is possible that the rate of resistance evolution may change over time. If that change occurs abruptly (due to changing practices like adoption of GE crops or changes in herbicide use), then the relationship may have different slopes before and after the break point. The ‘segmented’ package in R (Muggeo Reference Muggeo2008) allows estimation of the break point in the data and also provides a method for testing whether the regression model with different slopes before and after a break point is significantly better than a simple linear regression (Davies Reference Davies2002).
Finally, herbicide-resistant species per million herbicide SOA applications was estimated by dividing the number of species with evolved resistance to each SOA as of 2015 by the number of applications of that SOA during the period 1990 to 2015. USDA herbicide use estimates are not available for every year for every crop. The total number of herbicide applications was estimated by fitting a local regression (LOESS) to the existing data. The interpolated LOESS estimates from each year were then summed for each SOA and each crop to obtain the total use of that herbicide SOA over the time period from 1990 to 2015.
Results and Discussion
Increased Glyphosate Use
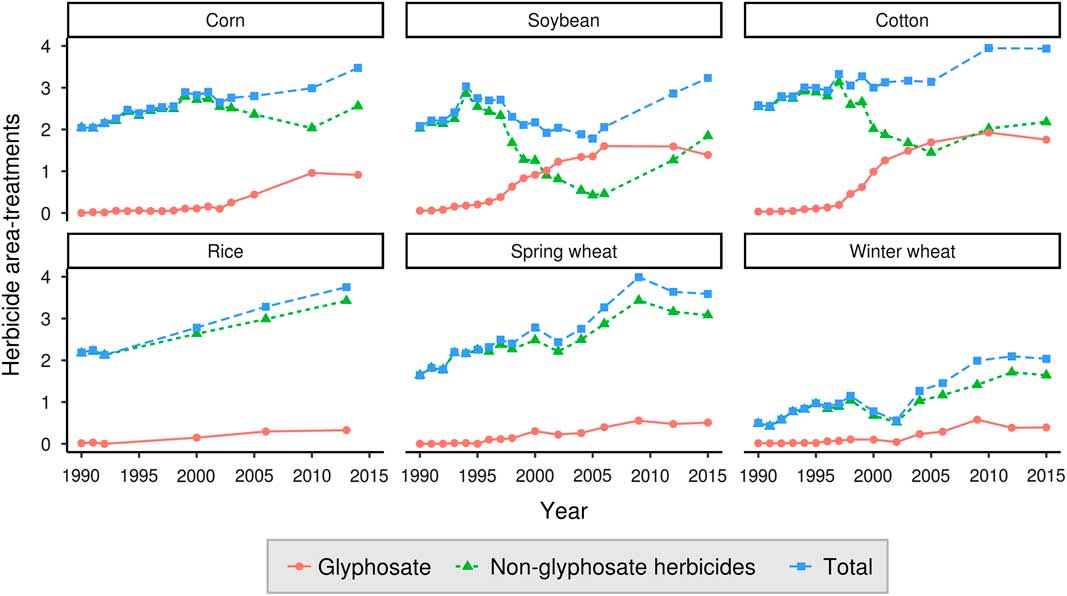
Corn, soybean, and cotton varieties exhibiting resistance to glyphosate were commercialized beginning in the mid-1990s (USDA Economic Research Service 2017). Adoption of glyphosate-resistant cotton and soybean varieties in the United States was rapid, reaching over 50% of total crop area within 6 yr of commercial introduction. Glyphosate-resistant corn adoption was slower in comparison, reaching 50% of total corn area 10 yr after introduction. Predictably, glyphosate use in these crops increased steadily following glyphosate-resistant cultivar adoption (Figure 1). Glyphosate area-treatments increased to 0.9, 1.4, and 1.8 for corn, soybean, and cotton, respectively, in the final year of data (2014 for corn, 2015 for soybean and cotton). This compares with non-glyphosate herbicide area-treatments of 2.6, 1.8, and 2.2 for corn, soybean, and cotton, respectively.
Glyphosate and non-glyphosate herbicide use in six U.S. crops, 1990 to 2015.
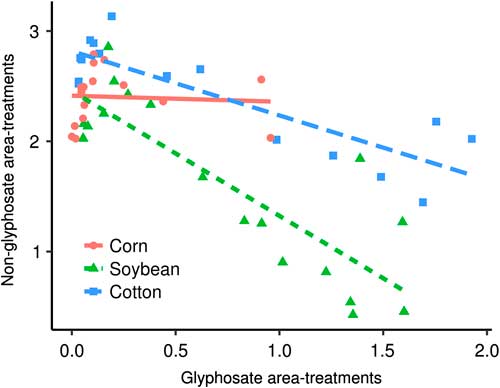
In corn, non-glyphosate area-treatments did not significantly decline as a function of increasing glyphosate use (Figure 2). In cotton and soybean, however, each glyphosate area-treatment was associated with a reduction of 0.6 and 1.1 non-glyphosate herbicide area-treatments, respectively.
Relationship between glyphosate and non-glyphosate herbicide area-treatments in three genetically engineered (GE) glyphosate-resistant crops. Each point represents herbicide use for one surveyed year between 1990 to 2015. Linear regression slopes (95% confidence interval in parentheses): corn, −0.05 (−0.51 to 0.4); soybean, −1.13 (−1.51 to −0.75); cotton, −0.58 (−0.79 to −0.38).
Although no glyphosate-resistant rice or wheat cultivars were commercially available during this time period, glyphosate use also increased in these non-GE crops (Figure 1). By 2013, 0.3 glyphosate area-treatments were applied in rice; 0.5 and 0.4 glyphosate area-treatments were applied to spring wheat and winter wheat, respectively, in 2015. Since no glyphosate-resistant cultivars were available, these glyphosate applications were presumably made either before crop planting or emergence for burndown weed control or, to a lesser extent, as a harvest aid in wheat. The increase in glyphosate use is possibly related to increased conservation tillage adoption requiring herbicides for weed control at planting, but also by a substantial drop in glyphosate prices after patent expiration.
Herbicide Diversity
Interpretation of SOA diversity and evenness is intuitive; greater values mean greater diversity and evenness, respectively. It is presumed that as SOA diversity increases, the selection pressure for herbicide-resistant weeds decreases, because as diversity of herbicide SOA increases, the likelihood that any particular field received multiple effective SOAs also increases.
Corn
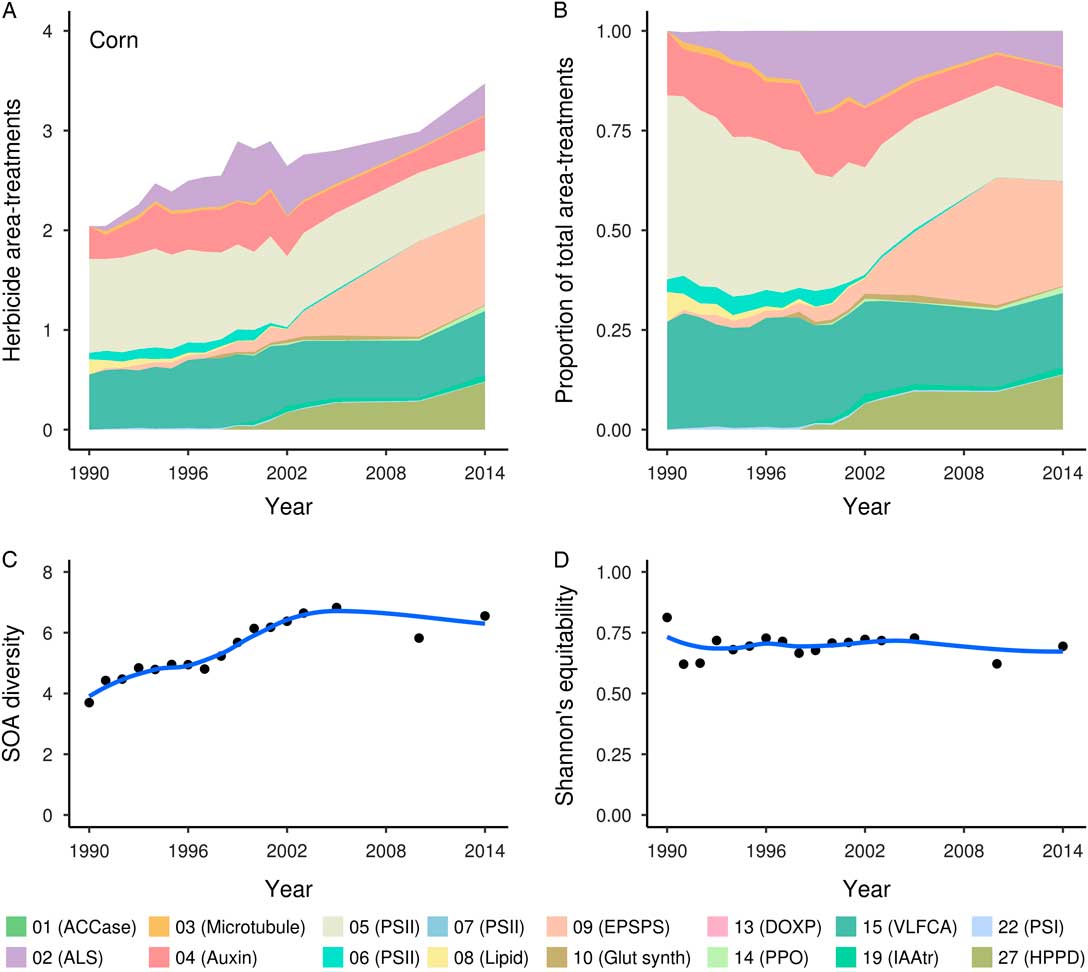
Herbicide area-treatments increased from 2.04 in 1990 to 3.47 in 2014 (Figure 3). Herbicide SOA diversity also steadily increased in corn until 2005, reaching a peak SOA diversity of 6.8 (Figure 3). Evenness of herbicide SOAs remained relatively consistent over the same period. This suggests that the potential for herbicide-resistant weed evolution became less likely in corn in the decade following GE corn introduction. Several changes in herbicide use patterns during this time are responsible for the increase in herbicide diversity. Glyphosate (the only herbicide that inhibits the 5-enolpyruvylshikimate-3-phosphate synthase enzyme, WSSA Group 9) began to increase substantially in corn after 2002, due to adoption of glyphosate-resistant hybrids. Group 27 herbicides (4-hydroxyphenylpyruvate dioxygenase inhibitors) were introduced commercially around the same time (in 1999) and have also increased steadily to reach 0.48 area-treatments in 2014. Group 5 herbicides, which include atrazine, once made up 46% of total corn area-treatments, but have decreased steadily in corn from 0.94 area-treatments in 1990 to 0.64 in 2014. Group 2 herbicide use has fluctuated somewhat over time, reaching a maximum of 0.59 area-treatments, but has averaged 0.29 area-treatments over the entire time period. Group 4 herbicide use has been mostly steady, averaging 0.36 area-treatments, but ranging between 0.23 and 0.46 area-treatments.
Corn herbicide use in the United States, 1990 to 2014: (A) number of herbicide area-treatments by site of action (SOA); (B) proportion of total herbicide area-treatments by SOA; (C) herbicide SOA diversity; (D) herbicide SOA evenness (Shannon’s equitability). Herbicide site of action numbers and abbreviations are defined in Table 1.
Soybean
In soybean, herbicide area-treatments reached a peak in 1994 of 3.03 before decreasing steadily to 1.78 area-treatments in 2005 (Figure 4). This reduction corresponded with an increase in glyphosate use (Group 9) and a reduction in all other herbicide SOAs due to adoption of glyphosate-resistant soybean cultivars. Herbicide diversity in soybean declined rapidly beginning in 1999 and continued a downward trend until 2006. Evenness of herbicide SOAs in soybean followed a trend similar to SOA diversity. The reduction in herbicide diversity corresponded with heavy use of glyphosate in glyphosate-resistant soybean. By 2005, glyphosate represented 76% of all area-treatments. USDA-NASS did not collect herbicide use data for soybean between 2006 and 2012.
Soybean herbicide use in the United States, 1990 to 2015: (A) number of herbicide area-treatments by site of action (SOA); (B) proportion of total herbicide area-treatments by SOA; (C) herbicide SOA diversity; (D) herbicide SOA evenness (Shannon’s equitability). Herbicide site of action numbers and abbreviations are defined in Table 1.
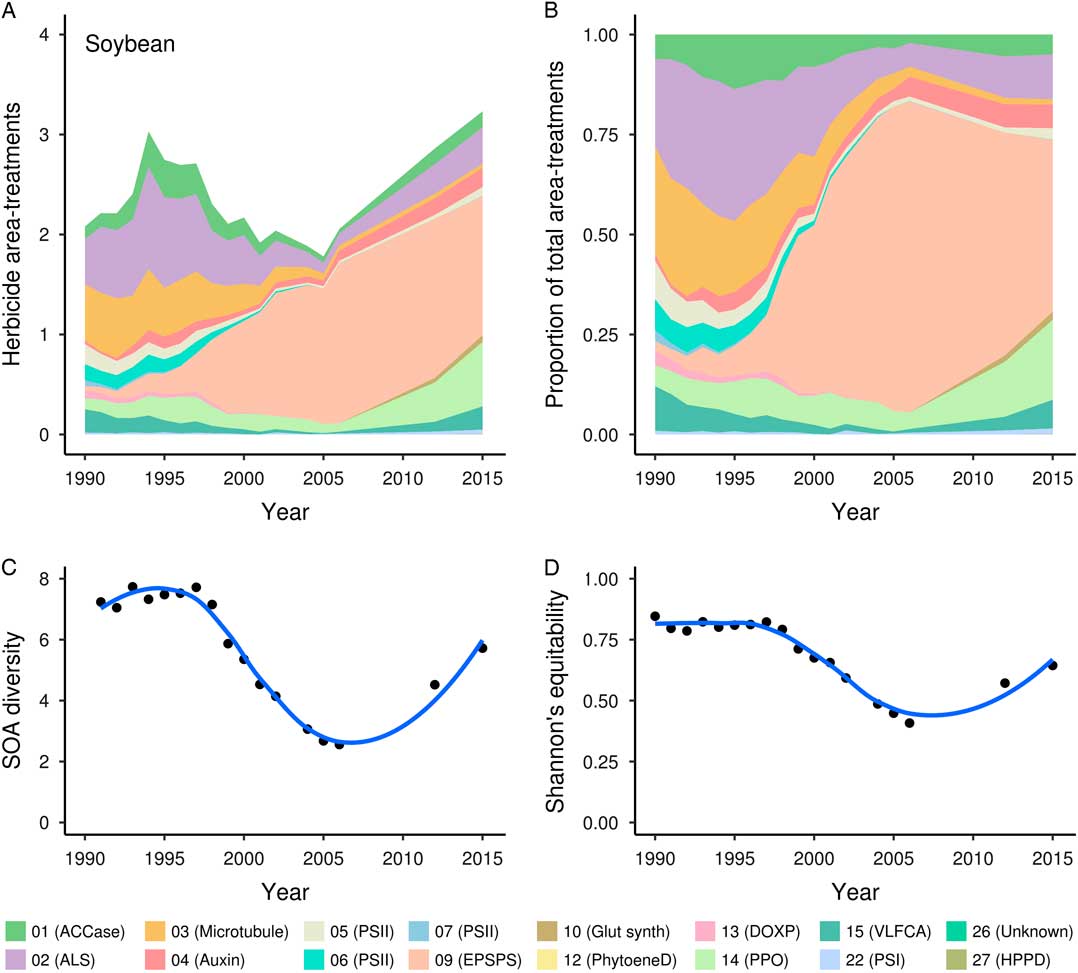
By 2012 herbicide SOA diversity in soybean had increased to levels similar to those observed in 2001 (Figure 4). Although glyphosate use remained steady during the period of 2005 to 2015 (area-treatments ranged between 1.35 to 1.60), the near-exclusive reliance on glyphosate in soybean decreased due to increased use of other herbicides; glyphosate represented 43% of total area-treatments in 2015, and herbicide area-treatments increased to reach an all-time high of 3.23 in 2015. The first documented case of a glyphosate-resistant weed in GE crops (and the second case overall in the United States) was collected from a soybean field in Delaware in 2000 (Heap Reference Heap2017; VanGessel Reference VanGessel2001). It is likely that glyphosate-resistant weeds were responsible for the increase in non-glyphosate herbicide use and the corresponding increase in area-treatments and herbicide diversity between 2006 and 2012, although a causal relationship cannot be confirmed from this data.
Cotton
Cotton herbicide area-treatments increased from 2.57 in 1990 to 3.93 in 2015 (Figure 5). A trend for increasing area-treatments was evident before the introduction of glyphosate-resistant crop cultivars, reaching 3.33 in 1997, the first year of glyphosate-resistant cotton availability. Herbicide area-treatments remained relatively steady through 2005, when 3.14 area-treatments were made. The USDA did not collect cotton herbicide use data in 2006 through 2009. In 2010 and 2015, the last 2 yr of USDA data collection in cotton, area-treatments had increased to more than 3.9. The greatest reduction in cotton herbicide use over this time period was observed in Group 17 herbicides, which are the organic arsenicals. Organic arsenical herbicide use peaked at 0.45 area-treatments and declined to 0.03 area-treatments by 2015. MSMA, the most prominent herbicide in this group, has been reviewed by the U.S. Environmental Protection Agency, but as of the writing of this paper, MSMA still has an active registration for use on cotton in the United States. Mitosis inhibitor herbicides (WSSA Group 3) and photosystem II inhibitors (WSSA Groups 5 and 7) have also remained important components of cotton weed control over time.
Cotton herbicide use in the United States, 1990 to 2015: (A) number of herbicide area-treatments by site of action (SOA); (B) proportion of total herbicide area-treatments by SOA; (C) herbicide SOA diversity; (D) herbicide SOA evenness (Shannon’s equitability). Herbicide site of action numbers and abbreviations are defined in Table 1.
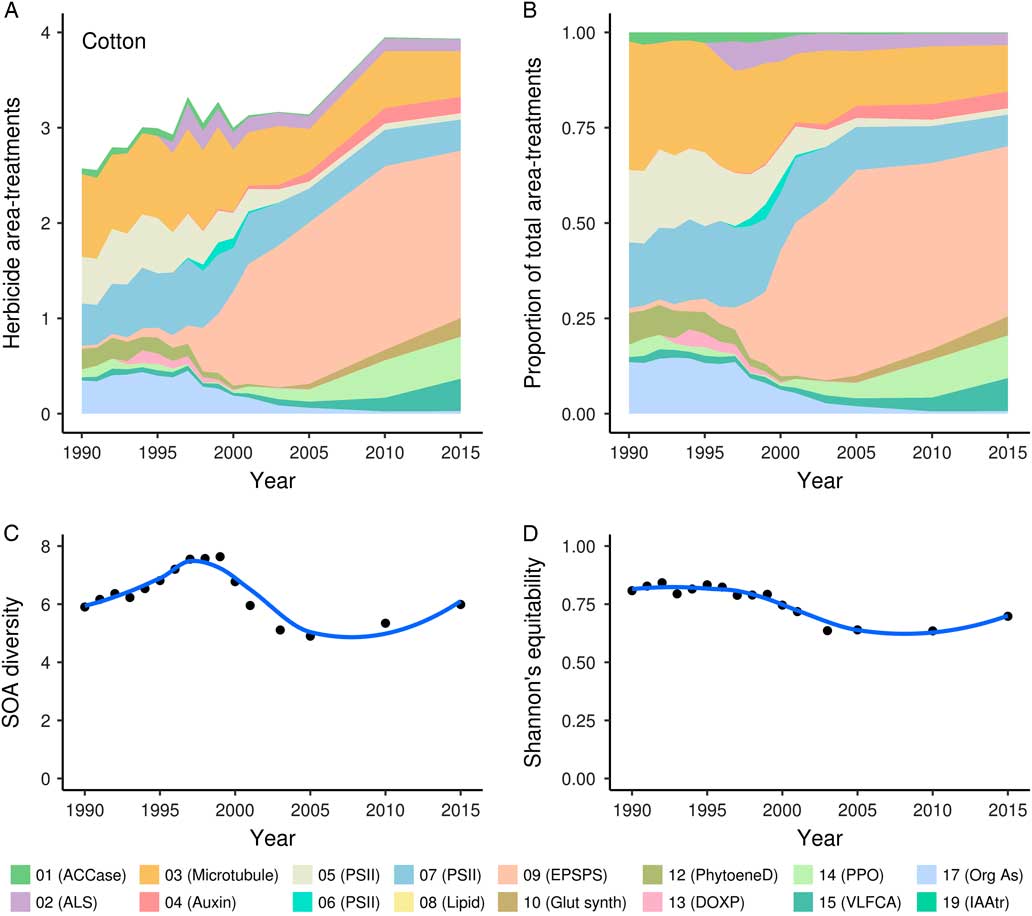
Herbicide SOA diversity in cotton increased steadily from 1990 until 1999, peaking at 7.6 (Figure 5), then declined as glyphosate use became a more dominant component of cotton herbicide programs. Glyphosate became a major component of herbicide use in cotton in the early 2000s. By 2005, glyphosate accounted for 2 area-treatments, which represented 54% of total cotton area-treatments. In 2015, SOA diversity was similar to the value in 1990 (6 and 5.9, respectively). Glyphosate use still accounted for 2 area-treatments in 2015, but due to increases in use of other herbicide SOAs, glyphosate represented only 45% of total area-treatments. Similar to soybean, the increase in non-glyphosate herbicide use in cotton was likely a response to evolution of glyphosate-resistant weeds, most notably, Palmer amaranth (Amaranthus palmeri S. Wats.). The first documented case of glyphosate-resistant Palmer amaranth arose from cotton fields in Georgia in 2004, where glyphosate failed to control this species (Culpepper et al. Reference Culpepper, Grey, Vencill, Kichler, Webster, Brown, York, Davis and Hanna2006). Since that time, Palmer amaranth resistant to multiple herbicide SOAs has become widespread throughout cotton-growing states (Heap Reference Heap2017).
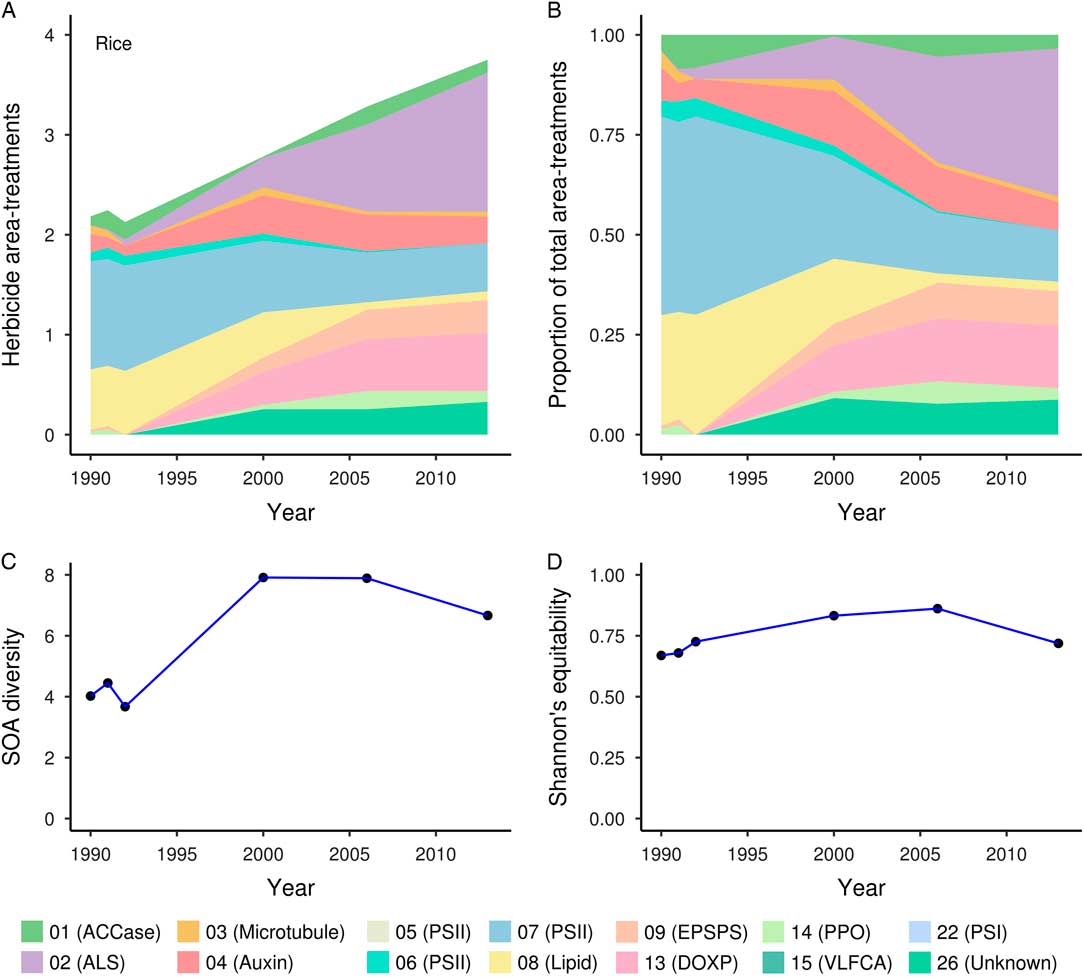
Rice
Herbicide use in rice was only surveyed six times over the last 25 yr, but since the surveys were conducted near the beginning and end of the period, they still provide valuable information on herbicide use trends. The number of herbicide area-treatments increased from 2.25 or fewer in 1990 through 1992 to 3.75 in 2013 (Figure 6). In 1990, only two herbicide SOAs (Group 7 and Group 8) made up 78% of rice herbicide area-treatments (Figure 6). Herbicide SOA diversity and evenness were greater in the last 3 yr surveyed (2000, 2006, and 2013) than in the 3-yr period from 1990 to 1992 (Figure 6). At least a portion of the increased SOA diversity in rice is due to adoption of herbicide-resistant varieties. Use of Group 2 herbicides increased substantially beginning in 2000, so that by 2013, this SOA made up 37% of area-treatments in rice. The increase in Group 2 herbicides corresponds with introduction of imidazolinone-resistant (IR) rice cultivars in 2002. IR rice was conventionally bred to be resistant to this group of herbicides, which would normally be lethal to the crop. By 2006, IR rice cultivars were planted on a substantial number of rice fields in the United States, and adoption increased again between 2006 and 2013 (Anonymous 2016).
Rice herbicide use in the United States, 1990 to 2013: (A) number of herbicide area-treatments by site of action (SOA); (B) proportion of total herbicide area-treatments by SOA; (C) herbicide SOA diversity; (D) herbicide SOA evenness (Shannon’s equitability). Herbicide site of action numbers and abbreviations are defined in Table 1.
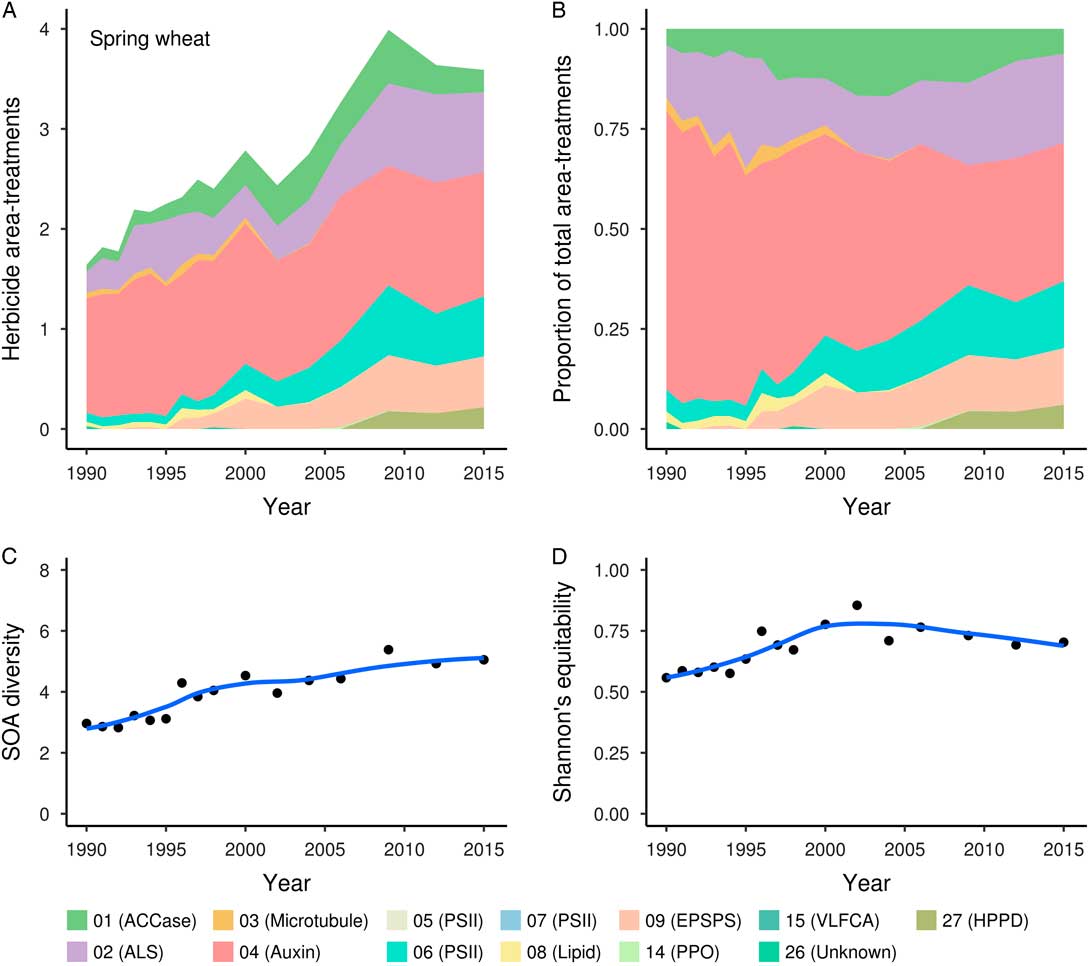
Spring Wheat
Herbicide area-treatments in spring wheat have increased over time, from 1.64 in 1990 to 3.59 in 2015 (Figure 7). Herbicide SOA diversity increased over the last 25 yr, largely as a function of increasing herbicide area-treatments in the crop. Even with this increase, however, herbicide SOA diversity is still less than for corn, soybean, cotton, or rice. Evenness peaked in 2002 at 0.86, then declined to 0.7 by 2015. The use of auxin-type herbicides (WSSA Group 4) remained an important component of spring wheat production throughout the 25-yr period, ranging between 1.15 and 1.44 area-treatments. However, due to the increasing use of other herbicides, Group 4 herbicides have declined from 70% of all area-treatments in 1990 to 35% in 2015. Glyphosate (Group 9) was not recorded in the spring wheat survey data in 1990 through 1992. Even though glyphosate-resistant wheat is not commercially available, glyphosate use in spring wheat increased steadily beginning in 1993. By 2015, glyphosate accounted for 0.51 area-treatments (14% of total area-treatments). Because no glyphosate-resistant spring wheat cultivars are grown commercially, glyphosate was either applied before wheat planting or as a harvest aid, rather than being applied to the growing wheat crop. Glyphosate price reductions probably played a role in the increased use in this crop.
Spring wheat herbicide use in the United States, 1990 to 2015: (A) number of herbicide area-treatments by site of action (SOA); (B) proportion of total herbicide area-treatments by SOA; (C) herbicide SOA diversity; (D) herbicide SOA evenness (Shannon’s equitability). Herbicide site of action numbers and abbreviations are defined in Table 1.
Winter Wheat
Winter wheat had the fewest herbicide area-treatments and lowest herbicide SOA diversity of the crops analyzed, although increasing trends were observed for both metrics over the 25-yr period (Figure 8). Similar to spring wheat, since there are no glyphosate-resistant wheat cultivars available, glyphosate is presumably being applied mostly as a burndown treatment at or before planting, or possibly during the fallow period the year before wheat planting. The USDA-NASS survey asks respondents to include all herbicide applications made between harvest of the previous crop and the current crop. For the winter wheat–fallow system common in the western United States, this period includes approximately 12 mo of fallow. Glyphosate is among the most common herbicides used for fallow weed control, because it is effective and relatively inexpensive.
Winter wheat herbicide use in the United States, 1990 to 2015: (A) number of herbicide area-treatments by site of action (SOA); (B) proportion of total herbicide area-treatments by SOA; (C) herbicide SOA diversity; (D) herbicide SOA evenness (Shannon’s equitability). Herbicide site of action numbers and abbreviations are defined in Table 1.
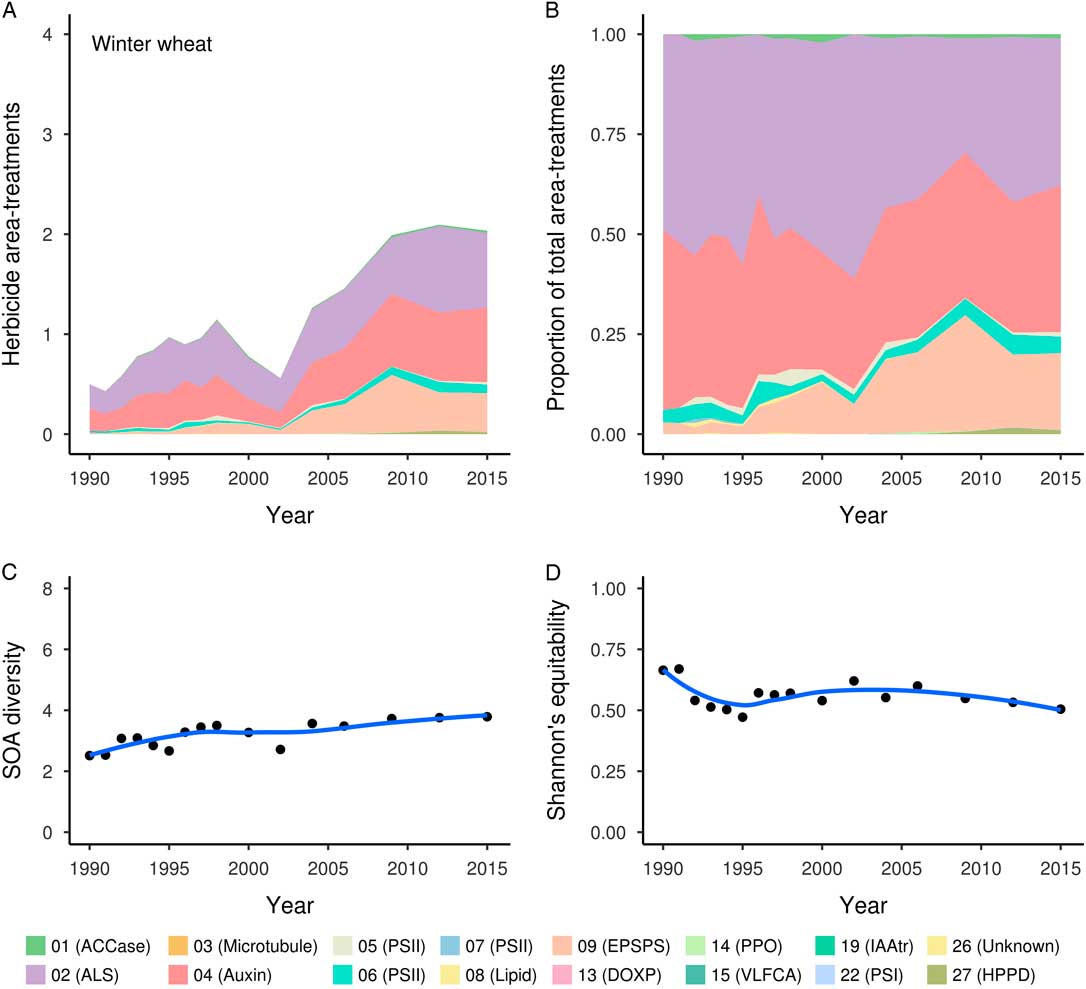
In 2015, just three herbicide SOAs (WSSA Groups 2, 4, and 9) accounted for 93% of all herbicide use in winter wheat (Figure 8). The increasing dominance of just three herbicide SOAs resulted in decreasing evenness even as herbicide area-treatments and SOA diversity increased. Reliance on Group 4 (auxin) herbicides in winter wheat has remained relatively steady over time ranging from 28 to 45% of total area-treatments. Group 2 herbicide use has increased, while glyphosate (Group 9) has also increased.
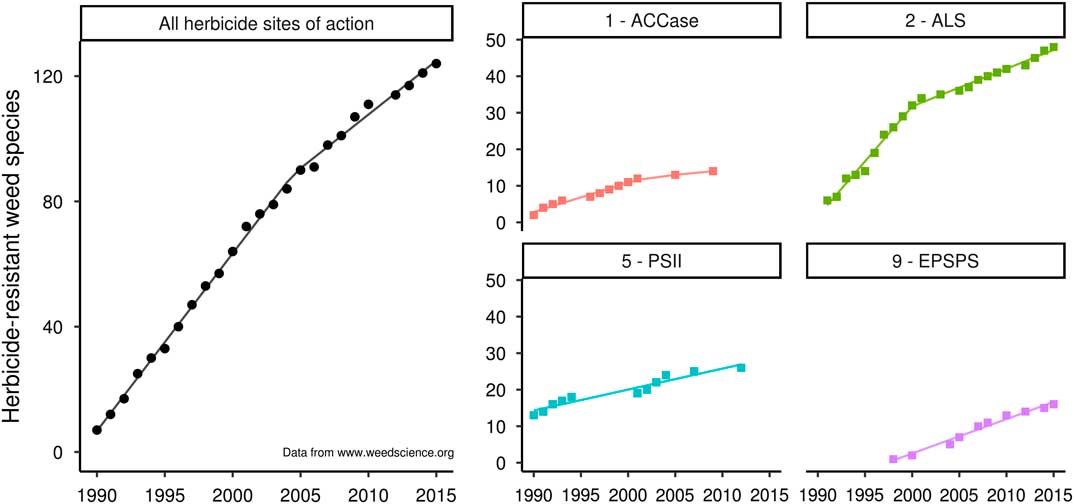
Rate of Herbicide-Resistant Weed Evolution
New herbicide-resistant weed species have increased rapidly over the last few decades, averaging approximately 5 new cases year−1 between 1990 and 2015 (Figure 9). However, break-point analysis suggests that the confirmation of new herbicide-resistant weed species has slowed since 2002 (Davies’ test P-value<0.001), averaging more than 6 new species year−1 before 2002, compared with 4 new species year−1 after 2002. Similarly, of the three herbicide SOAs with at least 10 resistant weed species since 1990, the confirmation of new resistant weed species has also slowed. For Group 1 and Group 2 herbicides, the change in slope occurred around 2002 and 2000, respectively, with the number of new confirmed resistant species dropping 78% and 65%, respectively.
Cumulative herbicide-resistant weed species in the United States as reported to the International Survey of Herbicide Resistant Weeds (www.weedscience.org). All herbicide SOAs combined, slope before 2005=5.7 new species year−1, slope after 2005=3.4 new species year−1 (Davies’ test P-value<0.001); WSSA Group 1 herbicides, slope before 2002=0.8 new species year−1, slope after 2002=0.2 new species year−1 (Davies’ test P-value=0.005); WSSA Group 2 herbicides, slope before 2000=3 new species year−1, slope after 2000=1 new species year−1 (Davies’ test P-value<0.001); WSSA Group 5 herbicides, slope=0.6 new species year−1 (Davies’ test P-value=0.441); WSSA Group 9 herbicides, slope=0.9 new species year−1 (Davies’ test P-value=0.341). Herbicide site of action numbers and abbreviations are defined in Table 1.
Between 1990 and 2015, 17 different weed species evolved resistance to glyphosate in the United States, and glyphosate had been applied approximately 3 billion times to the 6 crops in this analysis (Figure 10). For comparison, there were 27 species resistant to Group 5 herbicides (photosystem II inhibitors), and 51 species resistant to Group 2 herbicides (ALS inhibitors), even though those herbicides were applied a combined 3.2 billion times over the same time period. This suggests that weeds have relatively less capacity to evolve resistance to glyphosate compared with some other commonly used classes of herbicides. This is consistent with previous analyses by Beckie (Reference Beckie2006) and Gustafson (Reference Gustafson2008).
Herbicide-resistance evolution in the United States. Point size is proportional to the estimated number of applications of each site of action (SOA) applied to corn, cotton, soybean, rice, and wheat between 1990 and 2015. Number next to each point represents the number of confirmed weed species resistant to that herbicide’s SOA. Herbicide site of action numbers and abbreviations are defined in Table 1.
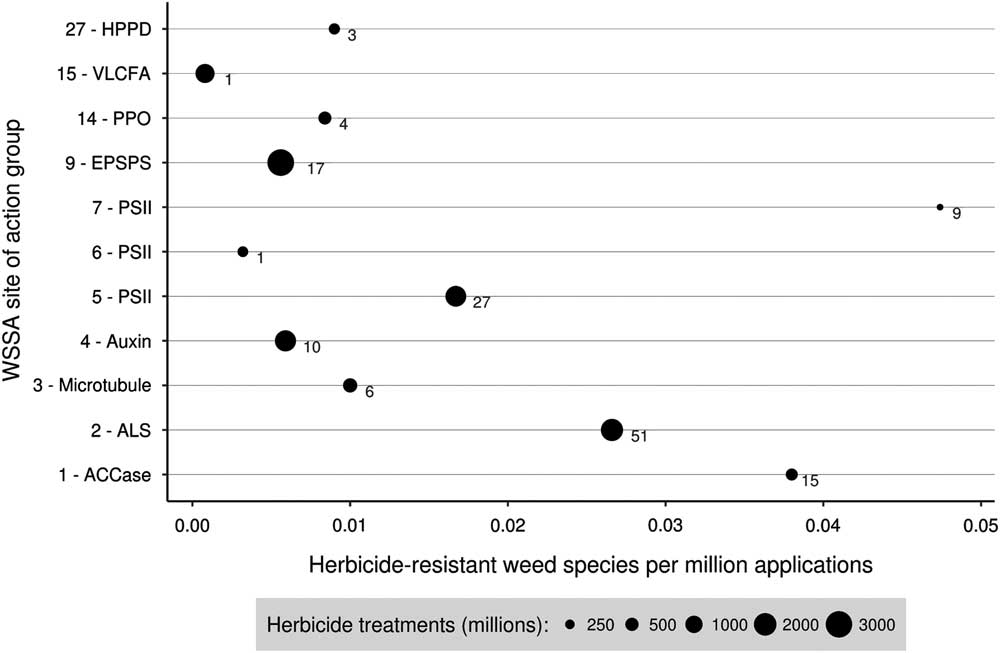
There are several herbicide groups with a lower rate of resistance evolution than glyphosate (Figure 10). Group 15 herbicides are of particular note, since only 1 weed species has evolved resistance to this SOA, even after 1.3 billion herbicide applications. Auxin herbicides (Group 4) appear similar to glyphosate in the rate at which resistant species have evolved (0.9 new resistant species year−1; 0.0059 species per million area-treatments). Looking exclusively from a resistant weed management perspective, these herbicide groups would be preferred options for reducing the likelihood of herbicide-resistant weed development compared with SOAs with higher resistance evolution rates like Group 1 (acetyl-CoA carboxylase inhibitors) or Group 2 (ALS inhibitors).
Although a great deal of recent coverage in the media and scientific literature has focused on herbicide increases in GE crops, herbicide treatments have actually increased faster in the non-GE crops rice and wheat compared with the three major GE crops (Kniss Reference Kniss2017). The herbicide that has generated most recent public interest is glyphosate, which has become heavily used in GE glyphosate-resistant crops. The relationship between glyphosate use and continued use of other herbicides differed among the three GE glyphosate-resistant crops, and glyphosate use has also increased in non-GE crops over the last 25 yr. The rate of new glyphosate-resistant species evolution, however, has remained relatively modest compared with other herbicide SOAs, even in the face of unprecedented selection pressure for resistance.
Evolved weed resistance to glyphosate continues to increase, and this is certainly a problem for farmers who rely on this herbicide for weed control. When viewed broadly, however, the available data suggest that the evolution of herbicide-resistant weeds has not accelerated since the adoption of GE glyphosate-resistant crops. Rather, the rate of new resistant weed species has progressed at a similar or even slightly reduced rate over time. Although GE herbicide-resistant crops are typically discussed as a single entity, the impact this technology had on herbicide use differed depending on the crop. In corn, where many other effective herbicide options are available, increasing glyphosate use did not reduce application of other herbicides. This finding is similar to that of Livingston et al. (Reference Livingston, Fernandez-Cornejo, Unger, Osteen, Schimmelpfennig, Park and Lambert2015), who used a similar data set and reported that less than 15% of corn area received glyphosate-only treatments in 2005 and 2010, and more than 40% of corn area received combinations of glyphosate plus other herbicides in 2010. Purely in the context of herbicide-resistant weeds, the introduction of glyphosate and GE corn varieties has probably had a positive effect, since an additional SOA was introduced and herbicide diversity did not decrease. Similarly, herbicide diversity in the non-GE crops rice and wheat increased during the 25-yr time period of this analysis, although diversity in wheat remains low compared with all GE crops.
A different trend was observed in cotton and soybean, however, where the introduction of GE crops resistant to glyphosate caused a rapid reduction in herbicide diversity by replacing alternative herbicide chemistries. Livingston et al. (Reference Livingston, Fernandez-Cornejo, Unger, Osteen, Schimmelpfennig, Park and Lambert2015) similarly estimated that in 2006, more than 50% of soybean area received only glyphosate without the use of other herbicides. While this may have exacerbated the problem of herbicide-resistant weeds, glyphosate appears to have at least partially displaced three herbicide SOAs (Groups 2, 5, and 7) which are more likely to select for herbicide-resistant weeds compared with glyphosate (Figure 10). It is possible that because glyphosate appears less likely to select for resistant weeds, the overall impact of reduced herbicide diversity may have been at least partially mitigated with respect to herbicide-resistant weed evolution in GE soybean and cotton. This is further supported by the reduced rate of herbicide-resistant weed evolution observed for all SOAs combined, as well as for Group 1 and Group 2 herbicides (Figure 9).
It is important to note that the reduced rate of herbicide resistance that occurred as glyphosate use increased, while suggestive, is not necessarily a causal relationship. It is possible that there are simply fewer remaining weed species with the ability to evolve herbicide resistance to these SOAs, and this decreased rate of resistance might have been observed regardless of the herbicide SOA used. This illustrates the primary weakness in the analysis presented here; one simply cannot estimate with certainty what would have happened if GE crops had not been adopted. The available data suggest that at the very least, the problem of herbicide-resistant weeds has not been accelerated or exacerbated by the adoption of GE herbicide-resistant crops. This does not mean that this trend will continue, however. If continued development of herbicide-resistant crops reduces herbicide diversity in the future, or increases use of herbicide SOAs that are prone to resistance evolution, the herbicide-resistance problem could accelerate. And the current pace at which new herbicide-resistant weeds are evolving, even if it has not been accelerated by GE crops, is unsustainable, given the lack of new herbicide SOAs (Davis and Frisvold Reference Davis and Frisvold2017; Duke Reference Duke2012).
There is also a risk that continued focus on breeding herbicide-resistant crops to manage herbicide-resistant weeds is slowing the development and adoption of new nonchemical weed control strategies and practices. Maintaining or increasing herbicide diversity will certainly play an important role in the management of herbicide-resistant weeds, but it would be naive to think that this problem will be solved by herbicide diversity alone. Using diverse crop and weed management practices is the most important consideration for proactive management of herbicide-resistant weeds (Beckie and Harker 2017; Harker et al Reference Harker, O’Donovan, Blackshaw, Beckie, Mallory-Smith and Maxwell2012; Norsworthy et al. Reference Norsworthy, Ward, Shaw, Llewellyn, Nichols, Webster, Bradley, Frisvold, Powles, Burgos, Witt and Barrett2012). A broad view of weed management diversity that includes nonchemical weed control practices such as new robotics technologies (Slaughter et al. Reference Slaughter, Giles and Downey2008), as well as older, proven practices like tillage and crop rotation, will undoubtedly be required to minimize the impacts of herbicide-resistant weeds in the future.
Acknowledgments
This analysis would not have been possible without the extensive efforts of Ian Heap, director of the International Survey of Herbicide Resistant Weeds (www.weedscience.org), to locate, assemble, and curate reports of herbicide-resistant weeds around the world. I greatly appreciate being allowed to plunder the data from his website. I also acknowledge the USDA-NASS pesticide use survey data as being critical to this work, and hope adequate funding continues for this important data source so that similar efforts will be possible in the future. Thanks to Gustavo Sbatella for many helpful discussions in the preparation of this manuscript. He inspired me to be a better scientist and a better person, and I am eternally grateful to have been blessed with his friendship.
Supplementary material
To view supplementary material for this article, please visit https://doi.org/10.1017/wsc.2017.70


 Open access