

Introduction
Chronic inflammatory demyelinating polyneuropathy (CIDP) is an acquired sensorimotor neuropathy.Reference Mahdi-Rogers and Rajabally1 Despite a cryptogenic pathophysiology, primarily due to the elusive repository of culpable antigenic targets, it is accepted that maladaptive humoral and cell-mediated B- and T- cell responses directed against myelin, nodal, and/or paranodal antigens lead to the peripheral myelinopathy, evincing the electrophysiologic abnormalities evident on nerve conduction studies.Reference Mahdi-Rogers and Rajabally1–Reference Bright, Wilkinson and Coventry3
Although the overall incidence demonstrates international variability, a range of 2–7 per 100,000Reference Bright, Wilkinson and Coventry3,Reference Rajabally, Nicolas, Pieret, Bouche and Van den Bergh4 is typically reported. Although CIDP may occur at any age, the fifth decade harbors the highest incidence.Reference Yoon, Chan and Gold5 CIDP displays heterogeneity in its phenotypic presentation with regard to not only temporal kinetics (i.e., acute vs. progressive vs. relapsing remitting) but also symmetry, and topographical distribution (i.e., a-/symmetric proximal and/or distal, sensory>motor, motor>sensory, ± oculobulbar.Reference Österlund-Tauriala and Partanen6,Reference Mathey, Park and Hughes7
It is assumed that complex host immunogenetic factors coupled with infectious exposure trigger the autoinflammatory binding of antibodies against myelin or myelin-associated independent or complexed antigens. Given the complex presentation of CIDP, multiple diagnostic criteria have been developed employing variable combinations of laboratory, electrodiagnostic, and biopsy findings.Reference Smolen, Landewé and Breedveld8
Despite its complexity, CIDP remains a treatable disease. The mainstays of CIDP treatment include corticosteroids and intravenous immunoglobulins (IVIgs), with immunosuppressive therapies generally reserved for more aggressive disease.Reference Hughes, Donofrio and Bril9,Reference Lehmann, Burke and Kuwabara10 However, despite recognized therapeutic efficacy of Igs, the duration of treatment to achieve optimal clinical response remains opaque.
The ICE study, a randomized, placebo-controlled trial, established the positive effects of IVIg treatment on CIDP.Reference Hughes, Donofrio and Bril9 Because the ICE trial design required participants to crossover to alternate therapy (rescue group) due to the lack of response after two doses, it is unknown whether additional IgG would affect further improvements. Furthermore, it remains unclear whether those CIDP patients whose disease stabilized with IVIg, might eventually improve with additional treatments. It is also unknown as to what duration of IVIg therapy is required to achieve a maximal strength response and whether this recovery is temporally consistent across muscle groups.
In this study, we identified the time required to reach maximal strength gains from IVIg. Furthermore, we sought to establish the cumulative IVIg dose required to obtain such a response. Such information may improve IVIg utilization in patients with CIDP, inform patient expectations, and ultimately optimize outcomes.
Ethics Statement
This study was approved by the Hamilton Integrated Research Ethic Board.
Patients and Methods
Data Collection
We performed a retrospective chart review of 27 clinically diagnosed CIDP patients at Neuromuscular and Neurometabolic Clinic, McMaster University, between 2005 and 2016.
Inclusion criteria for patient selection were based on a recent review of 15 CIDP criteria,Reference Magda, Latov, Brannagan, Weimer, Chin and Sander11 which were established by the European Federation of Neurological Sciences/Peripheral Nerve Society criteriaReference Stiehm12 (EFNS/PNS) as highly sensitive (73%) and specific (90%) based on the presence of 1 or 2 demyelinating findings, with or without ancillary testing, resulting in high feasibility and practical effectiveness.Reference Magda, Latov, Brannagan, Weimer, Chin and Sander11
Only patients meeting EFNS/PNS criteria for definite CIDP were included. Additionally, per the nature of the study, response to IVIg was necessary for inclusion, as failure to respond would contravene the measurement of maximal response.
Exclusion criteria included lack of exposure to IVIg, failure to meet EFNS/PNS criteria for CIDP, and history of other potential causes of neuropathy (i.e., alcoholism, diabetes mellitus, connective tissue disease, exposure to chemotherapy or other neurotoxic drug, hereditary neuropathy, documented nutritional deficiency, and history of ICU admission). Patients missing quantitative isokinetic strength data on more than 50% follow-up appointments were excluded.
Data abstracted from the patient chart review included age, past medical history, medication history (i.e., immunosuppressives, corticosteroids, and IVIg therapy), and serial post-IVIg strength measures. For each patient, the duration of IVIg exposure, total grams of IVIg, and dosing intervals/frequency were analyzed.
Quantitative maximal isometric (Nm) dorsiflexion (DF), knee extension (KE), and elbow flexion (EF) as well as handgrip (HG, kg) strength were recorded on initial consultation and follow-up appointments (Biodex System 4, Shirley, NY; HAND GRIP handgrip dynamometer; Lafayette Instruments, Lafayette, IN).
Methods
Standardized protocols were adopted to test isometric DF, EF, KE, and HG by a trained neuromuscular technician. Initial testing at first consultation was established as baseline strength (pre-IVIg). Standardized measurement protocols were utilized for all functions. EF was assessed with arm flexed at 70° and abducted 30° from the midline. DF was measured with ankle in neutral position aligned with the axis of rotation of the Biodex with hip flexed to 20° resting on an adjustable pad as the patient dorsiflexed for 5 s. Finger flexion was tested with elbow flexed at 90° and shoulder in neutral as the patient squeezed the dynamometer for 5 s in position 2 or 3, per patient hand size. KE was tested with knee flexed at 90° and hip resting at 90° flexion, while pelvic stabilization was achieved with a waist strap. All measurements were made in triplicate and the best response was recorded. Subsequent testing was completed at regular scheduled follow-up appointments, while IVIg therapy was continued.
The IVIg infusions were initiated with body weight-adjusted doses of 2.0 g/kg administered over 2 days, followed by booster/maintenance doses of 1.0 g/kg at frequencies generally ranging between 3 and 4 weeks. However, the interinfusion interval was abbreviated if the patient reported clinically significant wearing off phenomena which was defined as increased acroparesthesias and/or weakness manifested as (1) impaired dexterity, (2) reduced stamina, (3) gait instability, and/or (4) worsening foot drop. Additionally, the infusion interval was extended in case of absence of end-of-cycle symptoms. The presence of trivial sensorimotor end-of-cycle symptoms with no significant functional implications was determined to represent optimal treatment.
Peak strength (P100) was identified for EF, HG, KE, and DF for each patient. P100 was operationally defined as the value on quantitative isometric strength testing after which individuals plateaued, and further strength gains did not exceed 15%. The P100 was specified as the plateau and not the maximum strength value to account for the test–retest variability of isometric strength measurement. The P100 values were calculated relative to the baseline strength of each patient as a percentage change from baseline. Mean changes in isometric strength from baseline were plotted with mean plots for each strength area. Variability of time and magnitude of change were illustrated with vertical and horizontal standard error bars. Due to the small sample size, a nonparametric assessment of differences in the median change from baseline to P100 was tested within each muscle area for statistical significance using the Wilcoxon rank sum test. The acceptable error, α = 0.05, was adjusted using the Bonferroni approach, where each test confirmed the null hypothesis of no effect if p was greater than 0.0125. The main research question of what duration of therapy is associated with maximal recovery was addressed using a descriptive, frequentist approach operationalized in a time-to-event analysis. We were interested in identifying the best estimate for time (in days) the P100 occurred while patients were administered IVIg therapy. The Kaplan–Meier curves were plotted for each isometric strength area to describe the time to maximal strength recovery. We applied a univariate analysis to contrast the differences between isometric strength regions, the total grams of IVIg, mean cumulative dose, mean IVIg treatments required to achieve a relative P100, and the mean time to reach P100 (days). All mean values were tested for differences between strength areas using analysis of variance (ANOVA) with four groups. Variability for mean estimates was reported with a standard error of the mean.
Results
Of the 27 patients screened, 14 met inclusion criteria, where 8 of 14 patients were male with a mean age of 58.6 years. Most patients (12/14) were treated with tapering corticosteroid therapy with an average initiating dose of 38.6 ± 2.5 mg daily, seven were treated with persisting steroid therapy throughout the IVIg treatment (five of which discontinued steroid therapy before completing IVIg treatment). Of the 14 patients, 5 presented with sensory symptoms, 1 of which was notably ataxic; 7 with both motor and sensory abnormalities—3 of whom exhibited acute CIDP with relapses and eventual progression—and 2 with predominant motor symptoms. Four patients received immunosuppression with azathioprine (150 mg daily). One patient was treated for approximately 1 year due to plateau in strength as an attempt to decrease IVIg frequency, two patients due to deterioration post-T100, for approximately 6 months, and one patient was initiated with azathioprine cotemporally with IVIg and prednisone due to disease severity.
The mean IVIg dosing interval accounting for all strength measures was 3.6 ± 0.3 weeks. Cumulative amount of IVIg required to obtain P100 varied for each patient and function investigated, ranging from 562 to 798 g. All patients tolerated the IVIg without any significant adverse effects. Eleven patients were initiated at a dosing interval of 4 weeks, 2 patients at 2 weeks, and 1 patient at 3 weeks. The mean starting interval was 3.6 ± 0.2 weeks. Intervals were adjusted throughout the treatment periods depending on clinical progress, with interval reduction for more severe disease and extension for patients without end-of-cycle deteriorations. HG data were available for all 14 patients. DF and EF data were missing for two patients. KE data were missing for one patient.
P100
Our measure of P100 captured improvements across strength areas. The average number of IVIg treatments (induction + booster doses), across all functions, required to reach P100 was 3.5 ± 0.39 (HG, 3.07 ± 0.22; EF, 3.5 ± 0.34; KE, 4.08 ± 0.47; and DF, 3.5 ± 0.56). At P100, the HG strength measure was significantly different from baseline with a median difference of 14.50 (10.50, 18.50), V = 105, and p = 0.001. At P100, the KE strength measure was significantly different with a median difference of 77.6 (66.00, 122.25), V = 91, and p < 0.001. The DF strength area had a median difference of 10.77 (7.29, 21.95) and met the criteria for statistically significant result (V = 78, p = 0.002). The EF strength measure was significantly different from baseline with a median difference of 23.3 (12.25, 36.40), V = 78, and p < 0.001. Figure 1 illustrates the differences observed within strength areas at baseline and P100 (T100).
Bar graphs represent absolute mean strength gains at T50 and T100 measured in Nm (EF, KE, DF) or Kg (HG). *, significantly different from baseline measurement (p < 0.005).

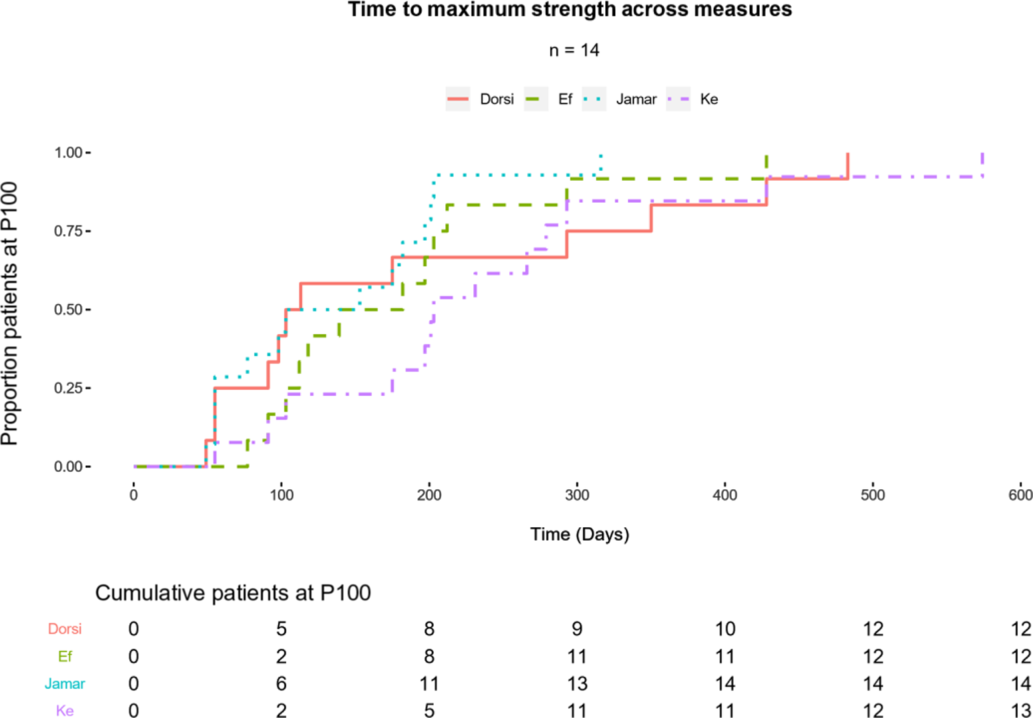
Time to P100
The time-to-event analysis described the effective duration of IVIg, where the event of interest was patients reaching a maximum threshold (P100). Figure 2 plots these events in a series of Kaplan–Meier curves (one for each strength area) with the strata of cumulative patients at their peak in the complementary table below the figure. Overall, we found that most patients who would make incremental gains, while accounting for measurement variability, would occur within 300 days (70% of patients had reached P100 across strength measures). The strength area that took the longest for patients to reach P100 was KE, where the longest patient took up to 600 days to reach P100. HG was the quickest to improve, with 11 of 14 patients reaching their maximum strength benefit by 200 days.
A descriptive analysis revealed that DF achieved the highest mean percent strength improvement over baseline of 463 ± 100% (p < 0.001) followed by EF at 146 ± 45% (p < 0.001), KE at 127 ± 17% (p < 0.001) and HG at 111 ± 22% (p < 0.001) (Figure 3). The mean T100s for the four strength functions were HG at 20.2 ± 3.1 wks EF at 26.7 ± 4.2 wks, DF at 28.4 ± 6.6 wks, and finally KE at 37.7 ± 5.1 wks. Due to the variability and skewness of the data there were no differences in the T100s (Figure 3).
The average rate of improvement among strength areas is described in Figure 4, where KE saw the highest rate of recovery at 2.99 Nm/week. The mean absolute weekly accrual of strength was similar for DF and EF which measured 0.92 ± 0.4 and 1.06 ± 0.2 Nm/week, but differed from KE at 2.99 Nm/week. HG improved by 1.01 ± 0.2 kg/week (Figure 4).
Peak strength gains (P100) described as the primary event for patients over time. A summary table (below plot) counts cumulative patients who have reached P100 in respective strength areas. Total events are included as the final column of the strata at 600 days.
Strength improvements expressed as percent-change from baseline at P100 plotted against T100, respectively. Note, all P100s are significantly different from baseline (p < 0.001) but T100s were not different (see text for details).

Mean weekly strength gains in Nm (EF, KE, DF) or Kg (HG). *, significantly different from EF and DF (p < 0.05). Note: HG, measured in Kg, cannot be compared to EF, KE, or DF which are measured in Nm.

Univariate ANOVA
We were interested to evaluate the differences in strength areas by testing for differences in total grams of IVIg, mean cumulative dose, mean IVIg treatments to P100, and the mean time to P100 (days) across isometric strength regions (Table 1). The sample contained a high degree of variability as to at what time individuals reached their P100 across strength measures. We observed no statistically significant difference in the mean time for patients to reach their P100 (p = 0.21). Excluding HG for different units, we did not detect a difference across strength areas for the mean P100 strength (p = 0.73). Additionally, no differences were observed between strength areas for mean IVIg cumulative dose (p = 0.64) and mean number of IVIg treatments (p = 0.36).
Univariate ANOVA

Discussion
CIDP is a significant polyradiculoneuropathy, resulting in progressive or relapsing weakness and sensory symptoms. It can be difficult to diagnose and, if allowed to progress, may result in severe disability. However, despite the potential for severe pathology, CIDP can be successfully treated. IVIg is an ideal agent due to its favorable side effect profile, systemic tolerability, and lack of toxicity.Reference Oaklander, Lunn, Hughes, van Schaik, Frost and Chalk13 The ICE trialReference Hughes, Donofrio and Bril9 among othersReference Hahn, Bolton, Zochodne and Feasby14 established that the treatment of CIDP with IVIg showed significant benefit. However, the ICE trial rapidly crossed patients over to placebo once improvement was achieved, rendering the question as to whether further treatment with IVIg would have resulted in continued improvements unknown. Furthermore, there is a paucity of literature investigating the time course of recovery to maximum strength using IVIg. The details on CIDP treatment duration with IVIg, amount of medication required, and the overall treatment guidelines are lacking. In our study, we aimed to describe maximal patient recovery from persistent IVIg therapy in patients with CIDP, as defined by maximum strength in four representative proximal and distal groups of muscles in the upper and lower extremities. We identified 14 patients who met definite CIDP criteria via the EFNS/PNS (patients meeting probable or possible criteria were excluded), all of whom were treated with IVIg and experienced significant improvement in strength over highly variable durations. Since our main outcome was time to maximal response, only patients showing improvement with therapy were included in the study (classified as immune therapy responders).
Although 12 of 14 patients initially received steroid therapy in parallel with Ig, improvement continued despite steroid discontinuation. Therefore, while concomitant exposure to two therapies precludes a precise assignment of the therapeutic contributions of either agent, it is clear that no deterioration occurred with steroid withdrawal; and maintenance of maximal response was achieved with IVIg alone.
Time required for patients to obtain a relative plateau in strength (i.e., P100) for functions tested ranged between 20 and 34 weeks of IVIg treatment. However, majority of patients (70%) achieved improvement at 26 weeks, with a fraction remaining as late responders, indicating more resistance of their underlying disease.
HG peaked the earliest and KE the latest. Commensurate with this, the recovery of HG required the lowest cumulative grams of IgG (561.71 ± 97.21), whereas KE the most (798 ± 120.7). Of all the functions tested, DF showed the greatest improvement, as demonstrated by the highest percentage change in peak strength. This was due to the fact that DF weakness was present in all patients and initial peak torque was low (6.3 ± 2.9 Nm), exaggerating the percentage improvement with minor gains in absolute power, notwithstanding the imputation of 1 Nm for six patients with unrecordable baseline DF power. Furthermore, the Biodex does not register power at or below a clinical Medical Research Council (MRC) score of 2/5. Therefore, patients with registrable baseline DF data demonstrated an MRC ≥3. Thus, the Biodex exerts an underestimation bias for patients who improve above a baseline of 0 Nm as it fails to distinguish between MRC 2, 1, and 0. Contrariwise, the continuous measurement capacity of the Biodex permits detection of improvements between MRC grades 3 and 5 (i.e., 25 and 35 Nm are both grade 5 for an adult; unpublished clinic data), thereby mitigating the ceiling effect of an ordinal scale and properly according improvement at the upper range unlike the MRC sum score or the Inflammatory Neuropathy Cause and Treatment (INCAT) score.
A common approach for the administration of IVIg described in the literature consists of an induction (2.0 g/kg) given over 2–5 days followed thereafter by booster/maintenance doses every 3 to 4 weeks.Reference Breiner and Brannagan2,Reference Léger, De Bleecker and Sommer15 Our protocol did not differ greatly, however, throughout treatment, the IVIg dosing frequency was subject to adjustments as dictated by clinical presentation, namely, the presence or absence of end-of-cycle wearing off or symptom recrudescence. This was performed to counteract any deterioration as well as avoid unnecessary exposure to the treatment. Despite clinical attempts to optimize the efficiency of IVIg (i.e., maximal function with minimal therapy), the mean treatment intervals throughout the T100 time period, across functions, ranged tightly between 3.6 and 3.7 weeks, implying relative homogeneity of CIDP severity in this cohort. The data also suggest that, until P100 is achieved, the treatment interval ought to be maintained at 4 or less weeks.
We also observed that, after reaching peak strength, most patients manifested fluctuations in strength, reflecting the variable nature of psychophysical testing which is influenced by numerous factors such as recent activity, motivation, and muscle or joint pain. However, such neurophysiologic vicissitudes, while predominantly psychophysical, are likely impacted by the timing of the interinfusion testing between consecutive IVIg treatments. Interinfusion dynamics of strength changes in IVIg-treated CIDP patients has not been investigated.
Furthermore, different muscle groups manifested differential time dependency reflected in the variable amounts of IVIg that were required. These discrepancies in functional outcomes may be explained by the initial disease severity, degree of disuse atrophy, response rate, and a lack of strict control over ancillary medications (i.e., azathioprine and steroids). Importantly, clinical improvements continued with IVIg therapy despite tapering of corticosteroids. Strength gains can perhaps be partly explained by progressive activity levels of patients. For example, after preliminary primary IgG-mediated biologic or immune-mediated recovery, secondary functional recovery may be realized through re-engagement of relatively disease-imposed sedentariness. More detailed studies would be necessary to differentiate between primary recovery and secondary neuromuscular adaptation to physical activity or even exercise (which the treatment has permitted). This was not the purpose of the current study.
Our findings demonstrate that prolonged IVIg therapy ranging from approximately 5 to 10 doses is required to achieve maximal strength recovery. As such, the INCAT scale may not be sensitive to the mean incremental weekly improvements, ranging from 0.92 to 2.99 Nm/week or 1.0 kg/week, established in our study, suggesting that the “nonresponders” in the ICE trial may have been vulnerable to a type II error. Moreover, while the purpose of the ICE trial was not to quantitate maximal strength gains, it is interesting to note that the 24-week “first period” falls within the T100 range of the current study (i.e., 20–34 weeks). This implies that prior to the extension phase, most responding patients would have achieved or approximated their P100 values. This adds to the existing data established by the ICE trial which required a response after induction and first booster in the IVIg arm or a single IVIg induction after crossover from the placebo arm.
The PRIMA studyReference Léger, De Bleecker and Sommer15 documented a mean INCAT score improvement of −1.0 after 16 weeks of IVIg, with 16 of 17 responders achieving clinically meaningful change by week 10. The secondary outcomes of mean grip strength and MRC sum score reached maximum improvement by weeks 7 and 10, respectively. However, these means considered all patients including the nonresponders who may in fact have declined, thus disqualifying such an analysis from discerning time to maximum response among responders.
However, we do recognize that our study is limited by the small number of patients studied. Also, we understand that we were unable to precisely quantify how much physiotherapy and general physical activity each patient performed; factors would be expected to influence recovery independent of IVIG. The retrospective nature of our study is also not as incisive as a prospective cohort approach.
Nevertheless, given that our cohort consisted of categorical IVIg responders, an estimation of recovery trends was possible.
In summary, our data show that recovery for CIDP patients vary between 5 and 10 doses of IVIg over 20–34 weeks to achieve maximum strength as measured by standard dynamometry. Based on our results, administering tapering immunotherapy for majority of patients may be considered around 30 weeks of treatment if a strength plateau is achieved.
It is most likely that immunomodulation is the predominant mechanism for early recovery, whereas the latter gains may reflect increasing activity patterns through engagement of the previously weakened muscles (particularly the antigravity proximal muscles, i.e., quadriceps). Monitoring self-selected activity patterns in CIDP patients represents another tool to understand the more complex issue of strength recovery, which extends beyond immune-based therapies.
Disclosures
Adrian R. Opala has no conflict of interests to declare. Steven K. Baker has the following disclosures. Dr. Baker received speaker honorarium from AKCEA Therapeutics Canada and Alnylam Pharmaceuticals; consulting fee from Octapharma; and unrestricted educational grants from Allergan Pharmaceutical Company and Grifols. Kevin Kennedy has no conflicts of interest to declare.
Funding
Funding was provided by a private donation from Doug and Marvella Leggat for peripheral nerve research.
Statement of authorship
SKB: Conception, design, authorship, final editing. ARO: Authorship, statistical analysis, and final editing. KK: Statistical analysis.


