





Diets for farmed Atlantic salmon, Salmo salar, have changed considerably during the last decades. In Norway, although 90 % of the ingredients were of marine origin in the 1990s, current diets only contain approximately 30 % marine ingredients(Reference Ytrestøyl, Aas and Åsgård1). This situation is very similar in Chile, Canada and Australia, whereas salmon diets used in Scotland in 2013/2014 contained 60 % plant ingredients and 40 % marine ingredients on average(Reference Shepherd, Monroig and Tocher2). The shift from marine to plant ingredients, or in some cases land animal by-products, has been driven by the need of the feed producers to reduce dietary reliance on the finite marine-derived ingredients, fish oil (FO) and fishmeal (FM) to secure global aquaculture production(Reference Tacon and Metian3). However, vegetable oils are naturally devoid of the nutritionally beneficial n-3 (n-3) long-chain (≥C20) PUFA (LC-PUFA), EPA (20 : 5n-3) and DHA (22 : 6n-3), and cannot be used as the sole oil source in fish diets with a low FM content, since EPA and DHA are essential fatty acids (FA) in salmon diets(Reference Ruyter, Røsjø and Einen4, Reference Bou, Berge and Baeverfjord5). The physiological relevance of these FA is well-recognised, being involved in maintaining the structural and functional integrity of cellular membranes, acting as precursors of important metabolites, such as eicosanoids, and working as signalling molecules able to regulate the transcription of genes involved in lipid metabolism(Reference Smith and Murphy6, Reference Miyazaki and Ntambi7).
The Norwegian, Scottish and Australian salmon industries have reported a significant decrease in the absolute amounts of EPA and DHA in salmon fillets and a concomitant increase in FA typical of terrestrial-derived lipid sources, reflecting the changes in the feed formulation throughout the years(Reference Ytrestøyl, Aas and Åsgård1, Reference Shepherd, Monroig and Tocher2, Reference Nichols, Glencross and Petrie8–Reference Sprague, Dick and Tocher10). In addition, the high inclusion levels of vegetable and/or animal oils rich in n-6 FA in salmon diets result in an associated increase in the n-6:n-3 ratio in fish organs and tissues, including fish fillets(Reference Bou11). This is an important issue that might affect not only fish and human consumer health but also influence consumer perspectives towards farmed fish. Alternative sources of n-3 LC-PUFA oils are being pursued; however, neither oils from traditional oilseeds such as linseed nor the GM stearidonic acid (18 : 4n-3) or EPA rich oils have so far shown efficient conversion to DHA in Atlantic salmon(Reference Kitessa, Abeywardena and Wijesundera12).
In terrestrial GM plant oils, enriched levels of DHA have been achieved, combined with lower n-6 PUFA levels than occurs in conventional canola oils(Reference Kitessa, Abeywardena and Wijesundera12–Reference Petrie, Zhou and Leonforte15). Today, close to 70 % of the oil fraction in feeds for Atlantic salmon in Norway consists of canola oil, demonstrating that the fish already grow and perform well on canola oil-rich diets. In addition, several Atlantic salmon feeding studies using GM plant material from soyabean and maize have shown that they are as safe as commercial varieties (for a review, see Sissener et al. (Reference Sissener, Sanden and Krogdahl16)). GM camelina oil rich in EPA, although containing a high level of n-6 FA, has been tested in diets of post-smolt Atlantic salmon. This oil did not influence the fish performance relative to a FO diet; however, liver transcriptome analyses revealed that the response in fish was closer to the expected response to plant oils than to that of FO(Reference Betancor, Sprague and Usher17). Some studies have shown that Atlantic salmon has a more defined requirement for DHA than for EPA(Reference Thomassen, Rein and Berge18–Reference Emery, Norambuena and Trushenski20). When replacing conventional feed ingredients with new ingredients, it is important to ensure that they are as safe as traditional products.
In the present study, two separate feeding trials with DHA-CA oil were performed, one in Australia at a water temperature of 16°C and one in Norway at a lower water temperature of 12°C. The overall study was undertaken to determine if the new DHA-CA oil containing enhanced levels of n-3 LC-PUFA and a lower level of n-6 LC-PUFA than conventional canola oils would influence growth, performance, health and n-3 LC-PUFA, content in different organs and tissues in Atlantic salmon fingerling.
Materials and methods
Canola oils
The DHA-CA tested in the experiment was obtained from Event NS-B50027-4, which is a modified canola (Brassica napus) line developed by Nuseed Pty. Ltd. The transgenic seeds were modified to produce the LC-PUFA – EPA and DHA; construct details are provided in Petrie et al.(Reference Petrie, Zhou and Leonforte15). The crop used in this trial was grown in Australia during 2015 and 2016. The control canola oil (Ctr-CA) used in the diets was an Australian variety (Garnet) with an oil profile similar to that of the parent (untransformed) line from which NS-B50027-4 was derived. Oils were cold-pressed and filtered.
Analyses of elements and undesirables in the oils
Multielement determination of the oils was done by inductively coupled plasma MS(Reference Julshamn, Brenna and Holland21), while analysis of selected undesirable compounds was conducted by Eurofins (GmbH, Hamburg) using accredited methods (accreditation number D-PL-14602-01-00). Chlorinated pesticides (aldrin; chlordane, cis-; chlordane, oxy-; chlordane, trans-; dieldrin; endrin; γ-HCH (lindane); HCH, α-; HCH, β-; HCH, delta-; heptachlor; heptachlor epoxide, cis-; heptachlor epoxide, trans-; hexachlorobenzene (HCB); mirex; nonachlor, trans-; o,p′-DDD; o,p′-DDE; o,p′-DDT; octachlorstyrene; p,p′-DDD; p,p′-DDE; p,p′-DDT; pentachlorobenzene; toxaphene parlar 26; toxaphene parlar 50; toxaphene parlar 62, endosulfan (-α,-β,-sulfat), toxaphene -26, -50, -60), organophosphate pesticides (119 compounds), 16 PAH-compounds (benzo(a)antracene, benzo(a)pyrene, benzo(b)fluoranthene, benzo(c)fluorene, benzo(ghi)perylene, benzo(j)fluoranthene benzo(k)fluoranthene, chrysene, cyclopenta(cd)pyrene, dibenz(ah)anthracene, indeno(1,2,3-cd)pyrene, 5-methylchrysene, dibenzo(a,e)pyrene, dibenzo(a,h)pyrene, dibenzo(a,i)pyrene and dibenzo(a,l)pyrene) and five lipid-soluble mycotoxins beauvericin and enniatin (A, A1, B and B1) were analysed in the oils.
Experimental diets used in the 16 and 12°C trials
Tables 1 and 2 show the formulation and chemical composition of the experimental diets. The four experimental diets for the 16 and 12°C trials were isoproteic (i.e. 59 and 57 %), isolipidic (approximately 17 and 20 %) and isoenergetic (approximately 21 MJ/kg for both experiments) (Tables 1 and 2). The diets for the two trials were both formulated to contain similar amounts of all nutrients which satisfied the dietary requirement of small fingerling salmon. The ingredients FM and FO used in the two trials came from different sources, and therefore there were some differences in the total quantity of EPA and DHA in their respective diets. The dietary treatments tested in both trials consisted of two diets containing low or high levels of FO and two diets containing low or high levels of DHA-CA oil. Within each temperature study, the FO-based diets were supplemented with standard (control) canola oil (Crt-CA) to provide a similar content of EPA+DHA to the diets containing DHA-CA at 50 and 100 % of total oil supplementation. The FA compositions of diets for the two temperature trials are presented in Table 3. All diets were produced in four pellet sizes and were used in accordance with increasing fish size. Due to the high FM inclusion (79 %) and low supplemental oil inclusion (7·8 %) in the fingerling diet formulations, phytosterols only contributed 8–16 % of the total sterols (the rest being cholesterol) in the feeds (Table 2). The calculated levels of EPA+DHA provided by the ingredients used in the diets are provided in Tables 1 and 2.
Formulation and composition of the experimental diets used in the 16°C water temperature experiment*
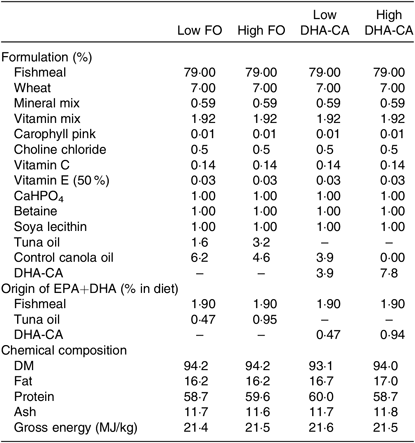
FO, fish oil; DHA-CA, n-3-rich modified canola oil.
* All ingredients were sourced from an Australian provider. The fishmeal used was a commercial fishmeal from South America (Peru and Chile) provided by Ridley Aquafeeds. The source of fish oil was tuna oil in order to more closely match the balance of EPA:DHA in control and test feeds. Feed pellets (three class sizes; 0·5–1·0 mm, 1·0–1·4 mm, and 1·4–2·0 mm) were prepared at the CSIRO Bribie Island Research Centre, QLD. The composition is an average of all three pellet sizes.
Formulation and composition of the experimental diets used in the 12°C water temperature experiment
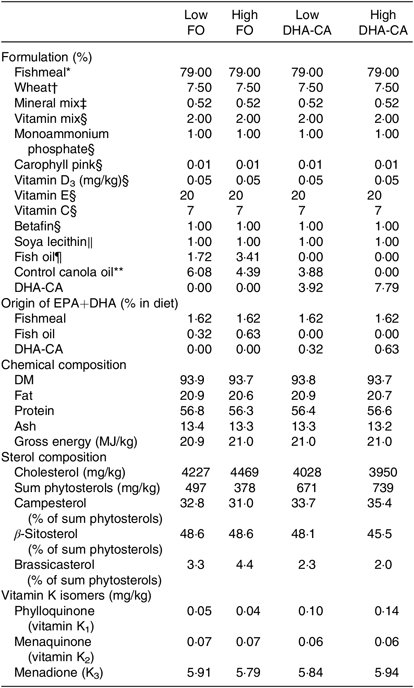
FO, fish oil; DHA-CA, n-3-rich modified canola oil.
* Nordsildmel.
† Norgesmøllene.
‡ Individual minerals purchased from Vilomix and mixed by Nofima.
§ Vilomix.
║ Denofa.
¶ Nordsildmel.
** Australia, var. Garnet.
Selected undesirables, phytosterols, vitamin E isomers and fatty acids in the n-3-rich modified canola oil (DHA-CA) and the control canola oil (Ctr-CA)
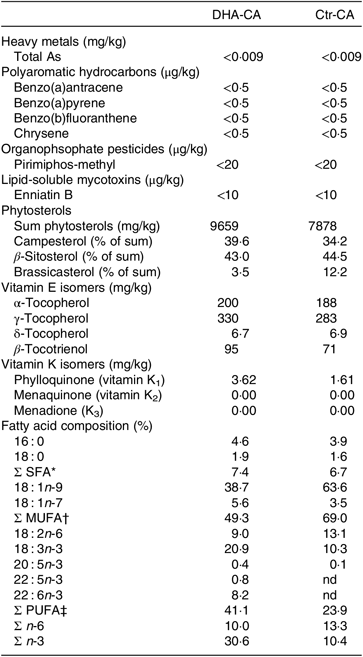
nd, Not detectable levels.
* Includes 14 : 0, 17 : 0, 20 : 0, 22 : 0 and 24 : 0.
† Includes 16 : 1n-9, 20 : 1n-9, 20 : 1n-11, 22 : 1n-7 and 24 : 1n-9.
‡ Includes 16 : 2n-3, 16 : 2n-6, 18 : 3n-6, 20 : 2n-6, 20 : 3n-3, 20 : 3n-6 and 22 : 2n-6.
Fish trials at 16 and 12°C
Atlantic salmon fingerlings with a mean weight of 0·83 (SD 0·02) g were the starting points for the 16°C trial in Australia (CSIRO research facilities, Bribie Island). The Australian experimental fish fry was produced in September 2016 by the industry hatchery Salmon Enterprises of Tasmania Pty. Ltd (Saltas). Atlantic salmon fingerlings with a mean weight of 2·08 (SD 0·05) g were the starting points for the 12°C trial in Norway (Nofima research facilities Sunndalsøra). The Norwegian experimental fish fry was produced in January 2016 from the Broodstock population CrossBreed Stofnfiskur by the company SalmoBreed. The experimental fish were distributed in twelve tanks, 100 individuals per tank (300 litres) and 200 individuals per tank (150 litres) for the 16 and 12°C trials, respectively. The fibreglass tanks were equipped with automatic belt feeders. Freshwater at a constant 16 (SD 0·1)°C and 12 (SD 0·1)°C was supplied at flow rates of 3 and 5 litres/min, respectively. As the fish grew and VO2 increased, flow rate was increased stepwise. Fish were kept under constant light (24 h light–0 h dark) and fed every 10 min. Feed was distributed according to the expected growth rate and a level of overfeeding that would allow all fish to feed ad lib. The four experimental feeds were fed to triplicate groups of fish. Temperature was measured daily in six random tanks.
Fish sampling in the 16 and 12°C trials
In the 16°C temperature trial, three individual samples of thirty pooled fish were taken initially and 100 fish per tank were bulk-weighed (20–30 fish at a time) on the same day. Fish were thereafter bulk weighed on days 0, 34, 56 and 70. On day 70, ten fish per tank were sampled and pooled for whole-body proximal composition and FA analyses and stored at −40°C until analyses.
In the 12°C trial, fish weights were bulk-weighed on days 0, 27, 41 and 83. In the final sampling, five fish from each tank were sampled for whole-body analyses of total lipid and FA content and composition. Additionally, five fish per tank were sampled and used for other analyses. Blood samples were taken, livers and hearts were dissected out and weighed and organ indices were calculated. Samples of intestine, liver, heart and erythrocytes were frozen in liquid N2 and stored at −70°C until analyses for FA composition, gene expression and enzyme activities.
Chemical analysis in the 16 and 12°C trials
Ten fish per tank were used for analyses of carcass chemical composition. Whole fish and DM content of the feeds were determined by gravimetric analysis following drying at 105°C for 16 h. Ash content was determined based on mass change after combustion in a muffle furnace at 550°C for 16 h. Measurement of total N2 content was undertaken using an elemental analyser (Flash 2000 Thermo Fisher Scientific), and data were used to calculate sample protein content based on N × 6·25. Gross energy was determined by isoperibolic bomb calorimetry in a Parr 6200 oxygen bomb calorimeter (Par Instrument Company). Carbohydrate was calculated by difference.
Fat content and fatty acid composition in the 16 and 12°C trials
Total lipids were extracted from the dietary oil, erythrocytes, whole body, muscle, liver, intestine and diets, following the method described by Folch et al.(Reference Folch, Lees and Sloane Stanley22). For the 16°C temperature trial, only whole body and diets were analysed. In each dietary group, fifteen fish were used for lipid analysis (five from each tank). The chloroform–methanol phase after Folch extraction was used for the analysis of the FA composition of total lipids using the method described by Mason et al.(Reference Mason, Eager and Waller23). Briefly, the extract was dried under N2 gas, and residual lipid was trans-methylated overnight with 2′,2′-dimethoxypropane, methanolic-HCl and benzene at room temperature. The methyl esters were separated and analysed using a gas chromatograph (Hewlett Packard 6890; HP) equipped with a split injector by using an SGE BPX70 capillary column (length, 60 m; internal diameter, 0·25 mm; and film thickness, 0·25 μm; SGE Analytical Science), flame ionisation detector and HP Chem Station software. The carrier gas was He, and the injector and detector temperatures were both set at 280°C. The oven temperature was increased from 50 to 180°C at the rate of 10°C/min and then increased to 240°C at a rate of 0·7°C/min. Individual FA methyl esters were identified by referring to well-characterised standards. The relative amount of each FA was expressed as a percentage of the total amount of FA in the analysed sample, and the absolute amount of FA per g of tissue was calculated using C23 : 0 methyl ester as the internal standard.
Similar methods were used for the high-temperature study, and while most FA were the same, a few different FA methyl esters were measured in the two standard protocols. In brief, 3 mg of oil was esterified using methanol–HCl at 105°C for 60 min and then extracted with hexane for separation by GC (Agilent 6890N), using a DB-23 capillary column (length, 60 m; internal diameter, 0·25 mm; and film thickness, 0·15 μm). The carrier gas was H2. Individual FA methyl esters were identified by referring to well-characterised standards and the Agilent RTL FAME Method, relative to C21 : 0 methyl ester as the internal standard.
Gene expression analysis in the mid-intestine of fish reared at 12°C
Total RNA was isolated from mid-intestine using a PureLink Pro 96 RNA Purification Kit (Invitrogen), according to manufacturer’s instructions. RNA was treated with PureLink DNase1 (ThermoFisher) to remove any contaminating DNA. The RNA concentration was measured using a NanoDrop® ND-1000 spectrophotometer (NanoDrop Technologies). Total RNA (900 ng) was reverse-transcribed into cDNA in a 20 μl reaction using a TaqMan® reverse transcription reagents kit (Applied Biosystems) according to the manufacturer’s protocol. Quantitative PCR was performed in a QuantStudio5 instrument (ThermoFisher), and the PCR master mix consisted of 0·5 μl forward and 0·5 μl reverse primer (online Supplementary Table S1, final concentrations of 0·5 μM), 2 μl of a 1:10 dilution of cDNA and 2·5 μl PowerUp™ SYBR™ Green Master Mix (ThermoFisher). All samples were analysed in duplicate with a non-template and non-RT enzyme control for each gene. The reaction was performed by incubating the samples at 95°C for 20 s, forty cycles of 95°C for 1 s and 60°C for 20 s. Primer efficiency was evaluated using 10-fold serial dilutions of cDNA for each primer pair. The specificity of PCR amplification was confirmed by melting curve analysis (95°C for 1 s and 60°C for 20 s, followed by an increase of 0·075°C/s until 97°C). Ef1a, rpol2 and etif3 were evaluated as reference genes, and etif3 was identified as the most stable. Relative expressions of mRNA were calculated using the ΔΔCT method using etif3 as a reference gene(Reference Livak and Schmittgen24).
Histology of intestine of fish reared at 12°C
Histological analysis of the mid-intestinal tissue was performed on fifteen samples from the mid intestine of each dietary group from the low-temperature trial, with samples collected at the final sampling, and fixed in 10 % phosphate-buffered formalin and stored at 4°C until analysis. The samples were dehydrated and processed according to standard protocols. Paraplast-embedded samples were cut using a microtome (5 μm) and stained with haematoxylin–eosin (Merck KGaA). Stained slides were examined using a standard Nikon Optiphot light microscope (Nikon). Images were captured using a MicroPublisher 3.3 RTV camera and analysed using QCapture Suite Software (QImaging). The sections were evaluated in a blinded manner to identify any pathological or other systematic variations in tissue morphology.
Phytosterols, cholesterol, vitamin E and vitamin K analyses in the 12°C trial
Phytosterols and cholesterol were analysed in the oils, feeds and in fish liver samples (six individual fish per tank with triplicate tanks per diet group), on a GC as described in detail by Sissener et al.(Reference Sissener, Rosenlund and Stubhaug25), based on Laakso(Reference Laakso26). HPLC was used for determination of tocopherols in the oils according to CEN(27), with two analytical parallels. Phylloquinone (vitamin K1), menaquinone (MK4-10, K2) and menadione (K3) were analysed both in the oils and feed samples with four analytical parallels by HPLC as described by Graff et al.(Reference Graff, Krossøy and Gjerdevik28).
Enzyme activities in the liver from fish reared at 12°C
Livers were frozen separately in liquid N2 and subsequently analysed for the activities of catalase, glutathione peroxidase and superoxide dismutase. The activity of catalase was measured according to a method described in Baudhuin et al.(Reference Baudhuin, Beaufay and Rahman-Li29). Superoxide dismutase activity colorimetric assay kit (Biovision) and glutathione peroxidase assay kit (Cayman Chemicals) were used to measure the activity of the two enzymes following the manufacturers’ protocol. The enzyme reactions were measured using a Spectrostar Nano plate reader from BMG LABTECH GmbH (Ortenberg).
Liver lipidomics in the 12°C trial
Liver lipids were extracted in the presence of authentic internal standards by the method of Folch et al.(Reference Folch, Lees and Sloane Stanley22) using chloroform–methanol (2:1, v/v). Neutral lipid classes were separated on a solvent system consisting of petroleum ether–diethyl ether–acetic acid (80:20:1). Phospholipid classes were separated using the Agilent Technologies 1100 Series LC. Each lipid class was transesterified in 1 % sulphuric acid in methanol in a sealed vial under N2 atmosphere at 100°C for 45 min. The resulting FA methyl esters were extracted from the mixture with hexane containing 0·05 % butylated hydroxytoluene and prepared for GC by sealing the hexane extracts under N2. FA methyl esters were separated and quantified by capillary GC (Agilent Technologies 6890 Series GC), equipped with a 30 m DB 88 capillary column (Agilent Technologies) and a flame ionisation detector. For detection of ceramides, 2H-labelled internal standards were added and samples were solubilised in methanol, followed by a crash extraction. A bilayer was formed with the addition of KCl in water, and the organic layer was removed and concentrated under N2. The extract was spun, filtered and split into two injections, one for ceramides and one for sphingosines. The extract was injected onto an Agilent C8 column connected to an Agilent 1290 Infinity LC and ABI 4000 QTRAP. The analytes were ionised via positive electrospray, and the mass spectrometer was operated in the tandem MS mode. The absolute concentration of each sphingolipid was determined by comparing the peak to that of the relevant internal standard.
Liver metabolomics in the 12°C trial
The metabolomics work was performed by Metabolon as previously described(Reference Evans, DeHaven and Barrett30, Reference Reitman, Jin and Karoly31) with liver samples sampled from nine fish from each of the four diet groups. Several recovery standards were added for quality control, and samples were prepared using the automated MicroLab STAR® system from Hamilton Company. Proteins were precipitated with methanol under vigorous shaking for 2 min (Glen Mills GenoGrinder 2000) followed by centrifugation. The resulting extract was analysed by four different methods: two separate reverse phase/ultra-performance liquid chromatography (UPLC)-MS/MS methods with positive ion mode electrospray ionisation, analysis by reverse phase/UPLC-MS/MS with negative ion mode electrospray ionisation and analysis by hydrophilic-interaction chromatography/UPLC-MS/MS with negative ion mode electrospray ionisation. Samples were placed briefly on a TurboVap® (Zymark) to remove the organic solvent. The sample extract was dried before being reconstituted in solvents compatible to each of the methods, and each reconstitution solvent contained a series of standards at fixed concentrations. All methods utilised a Waters ACQUITY UPLC and a Thermo Scientific Q-Exactive high-resolution/accurate mass spectrometer interfaced with a heated electrospray ionisation source and Orbitrap mass analyser operated at 35 000 mass resolution (further details can be found in the references above). Metabolites were identified by automated comparison of the ion features in the experimental samples to a reference library of chemical standard entries that included retention time, molecular weight (m/z), preferred adducts and in-source fragments as well as associated MS spectra(Reference Dehaven, Evans and Dai32).
Microarray analysis of liver in the 12°C trial
Liver transcriptome was analysed with Nofima’s 44 k microarray Salgeno containing oligonucleotide probes to all identified genes of Atlantic salmon. Analyses included all four experimental groups with five fish per group, and total twenty arrays were used. Custom microarrays were produced by Agilent Technologies, and all reagents and equipment were purchased from the same provider. One-Color Quick Amp Labelling Kit was used for RNA amplification and labelling, and fragmentation of labelled RNA was performed with a Gene Expression Hybridization kit. After overnight hybridisation in an oven (17 h, 65°C, rotation speed 0·01 g), arrays were washed with Gene Expression Wash Buffers 1 and 2 and scanned with the Agilent scanner. Nofima’s bioinformatics pipeline STARS was used for data processing and mining of results. The high FO group was used as reference. Differentially expressed genes were selected by lows stringency criteria that are commonly applied to feeding trials: log2-expression ratio > |0·6| (1·5-fold) and P < 0·05.
Calculations
Fish growth rate was calculated as follows, based on mean weights:
 $${\rm{Specific \,growth \,rate }}\,{\rm{ = }}\,\left( {{{\rm{e}}^{\left( {{\rm{ln}}W{\rm{1 - ln}}W{\rm{0}}} \right){\rm{/}}t}} - {\rm{1}}} \right){\rm{\,×\,100}},$$
 $${\rm{Thermal \,growth \,coefficient }}\,{\rm{ = }}\,\left( {W{{\rm{1}}^{{\rm{1/3}}}}{\rm{- }}W{{\rm{0}}^{{\rm{1/3}}}}} \right){\rm{\,×\,1000/}}d{\rm{^\circ }},$$
where W0 is start weight (g), W1 is final weight (g), t is number of days and d° is sum day degrees.
 $${\rm{Hepatosomatic \,index }}\,{\rm{ = liver \,weight / body \,weight ×100;}}$$
 $${\rm{Cardiosomatic \,index }}\,{\rm{ = heart \,weight / body \,weight ×100.}}$$
Statistical analyses
In the 16°C trial study, tanks were used as experimental units and differences in performance were tested by one-way ANOVA followed by post hoc comparisons using Tukey–Kramer tests. Before all analyses, the ANOVA assumptions of normality of residuals and homogeneity of variances were tested using the Shapiro–Wilk and Levene tests, respectively. All analyses were performed using NCSS 11.
In the 12°C trial temperature trial, tanks were used as experimental units and the chosen level of significance was P < 0·05. Changes in growth, FA compositions and enzyme activities were analysed by one-way ANOVA and Duncan’s multiple range test. The mRNA transcript abundance of metabolic relevant genes in the intestine was analysed by one-way ANOVA followed by the Tukey’s honest significant difference post hoc test to detect differences within dietary groups. These statistical analyses were conducted using the software SAS (SAS Institute Inc.).
Sterol levels in fish livers were analysed by nested ANOVA, with tank as a random factor and diet as a fixed factor, conducted in Statistica (version 13.1; Statsoft). For statistical analyses of the metabolomics/lipidomics data, any missing values were assumed to be below the limits of detection and these values were imputed with the compound minimum (minimum value imputation). While the lipidomics data are quantitative, the other metabolites are given in relative quantities and for these, the raw data for each biochemical were re-scaled to have a median of 1. Statistical analysis of log-transformed data was performed using R (http://cran.r-project.org/), which is a freely available, open-source software package. A two-way ANOVA with contrasts was used to identify statistically significant (P < 0·05) effects of oil source (DHA-CA v. FO), effects of inclusion level (high v. low) and interaction between oil source and level. Multiple comparisons were accounted for by estimating the false discovery rate (q-value < 0·10). In the figures, the lipid metabolites and enzyme activities are displayed in Tukey box plots, showing median, upper and lower quartiles, maximum and minimum of distributions, while outlier data points are indicated by a triangle.
Results
Characterisation of n-3-rich modified canola oil and control canola oil
There were major differences in the FA composition of the dietary oils DHA-CA v. Ctr-CA, with lower levels of 18 : 1n-9 (39 v. 64 %) and 18 : 2n-6 (9 v. 13 %) and higher levels of 18 : 3n-3 (21 v. 13 %) and 22 : 6n-3 (8·2 v. 0 %) occurring in the DHA-CA than in the Ctr-CA, respectively (Table 3). The DHA-CA also contained 0·4 % 20 : 5n-3 and 0·8 % 22 : 5n-3. In addition, the DHA-CA had a higher level of total vitamin E forms compared with the Ctr-CA, which was primarily due to an increased level of γ-tocopherol, with values of 325 mg/kg in the DHA-CA compared with 282 mg/kg in the Ctr-CA.
A range of undesirables were analysed in the two canola oils, and of the 119 organophosphate pesticides, the thirty chlorinated pesticides and heavy metals, all were below limit of quantification in both oils (data not shown). Only compounds often detected in commercial oils above the limit of quantification are shown in Table 3. In general, the undesirables normally detected in canola oils used in commercial fish feeds were not detected or were below limit of quantification in the two canola oils (DHA-CA and Ctr-CA) used in the current feeding trials. The profile of individual phytosterols differed, with a lower proportion of brassicasterol occurring in the phytosterols in the DHA-CA than in Ctr-CA.
The total content of vitamin K was higher in the DHA-CA with 3·6 mg/kg, compared with 1·6 mg/kg in the Ctr-CA. In the oils, 0·0–0·1 % of total vitamin K was K3, while the remainder was K1 (approximately 95 % trans-K1 and approximately 5 % cis-K1).
Composition of fish feeds
Table 4 shows the FA composition of the diets used in the two temperature trials. When exchanging FO with DHA-CA, the typical plant FA 18 : 1n-9 and 18 : 2n-6 remained relatively similar between the comparable diet groups, but the total SFA was reduced compared with the level of these FA in the corresponding FO diets, while the levels of 18 : 3n-3 increased. The sum of EPA+DHA was similar in the two comparable diets (Low FO v. Low DHA-CA and High FO v. High DHA-CA), but due to the fact that the DHA-CA oil mainly contains DHA and less EPA, the DHA-CA diets contained slightly more DHA and less EPA than the corresponding FO diets. There were some differences between the diets for the two temperature trials; in general, the EPA+DHA and SFA were higher and the MUFA and n-6 PUFA were lower in the diets for the 16°C trial compared with the level of these in the diets for the 12°C trial due to different sources of the ingredients FM and FO.
Fatty acid composition (% of total fatty acids) of the experimental feeds
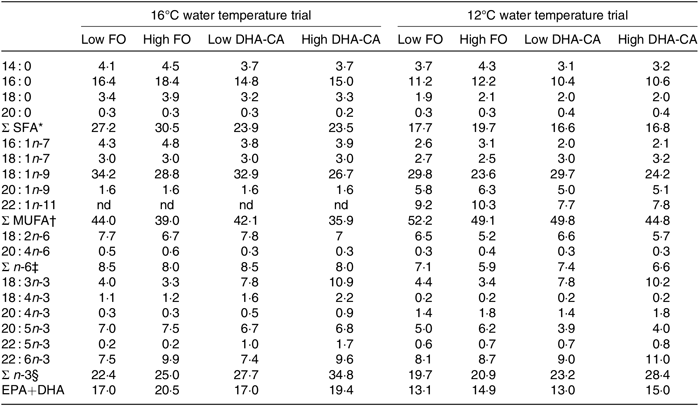
FO, fish oil; DHA-CA, n-3-rich modified canola oil; nd, not determined.
* Includes 15 : 0, 17 : 0, 19 : 0, 22 : 0 and 24 : 0.
† Includes 14 : 1n-5, 16 : 1n-5, 17 : 1-n7, 18 : 1n-11, 22 : 1n-7, 22 : 1n-9 and 24 : 1n-9.
‡ Includes 16 : 2n-6, 18 : 3n-6, 22 : 4n-6 and 22 : 5n-6.
§ Includes 16 : 2n-3 and 20 : 3n-3.
Fish performance and whole-body composition
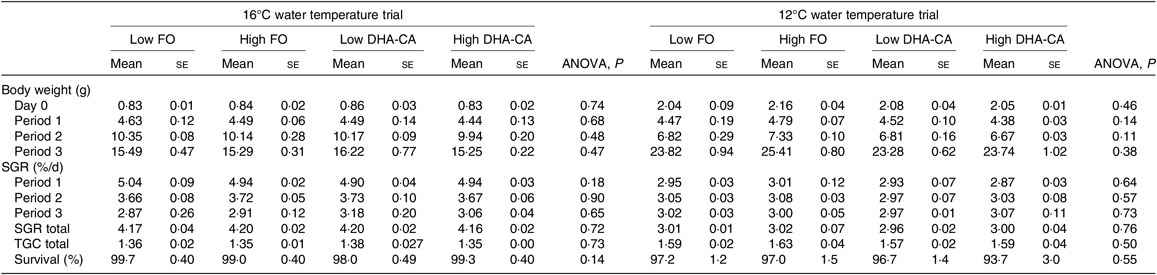
The fish at 16°C grew from an initial weight of 0·8 g to a final weight of approximately 15·5 g, while fish in the 12°C trial grew from 2 to 24 g, resulting in an approximately 20-fold increase in weight during the course of the trial at 16°C and an approximately 12-fold increase at 12°C (Table 5). The specific growth rate at 16°C was 40 % higher than that at 12°C. There was no difference in specific growth rate or thermal growth coefficient between the dietary groups within each temperature trial. Survival was very high (≥94 %) in all groups.
Growth and survival over the experimental period*
(Mean values using tank as a statistical unit (n 3) with their standard errors)
FO, fish oil; DHA-CA, n-3-rich modified canola oil; SGR, specific growth rate; TGC, thermal growth coefficient.
* The period from 0 to 34 d is denoted Period 1, from 34 to 56 d is denoted Period 2 and from d 56 to 70 d is denoted Period 3 in the 16°C trial. The period from 0 to 27 d is denoted Period 1, from 27 to 41 d is denoted Period 2 and from d 41 to 83 d is denoted Period 3 in the 12°C trial.
There were also no differences in proximate whole-body composition (protein, DM and ash) and energy content of fish in the different experimental groups in either of the experiments (Table 6). However, when salmon were reared at 16°C, the whole-body lipid content was significantly increased in fish fed diets containing the DHA-CA oil compared with those fed the FO-diets.
Proximate composition and energy content of whole fish at the end of the experiment
(Mean values using tank as a statistical unit (n 3, being each sample represented by a pool of five fish) with their standard errors)

FO, fish oil; DHA-CA, n-3-rich modified canola oil.
a,b Mean values within a row with unlike superscript letters were significantly different (P < 0·05).
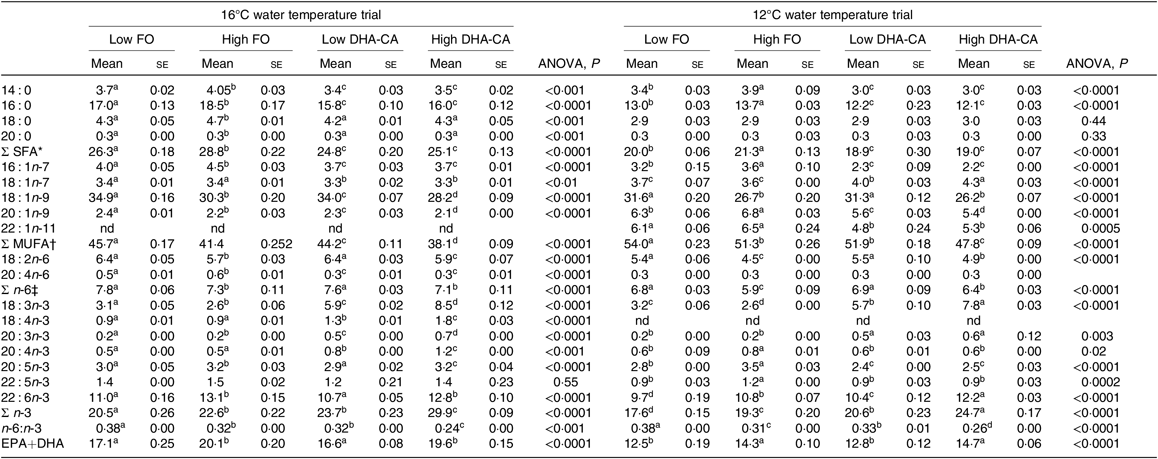
FA profiles in the whole body of fish from the two temperature experiments are presented in Table 7. In general, for both trials, the percentages of SFA were lower and the total n-3 FA were higher in both the DHA-CA groups than in the FO groups, reflecting the high 18 : 3n-3 content and the lower SFA contents of these diets. The two Low dietary groups (Low FO v. Low DHA-CA) and the two High dietary groups (High FO v. High DHA-CA) had similar percentages of EPA+DHA in whole body in both trials, although the actual level was higher in the low-temperature trial due to the higher level occurring in their diets.
Fatty acid composition (% of total) in the whole body of Atlantic salmon fed the experimental diets for 70 d at high (16°C) and for 83 d at low (12°C) water temperature
(Mean values using tank as a statistical unit (n 3, being each sample represented by a pool of five fish) with their standard errors)
FO, fish oil; DHA-CA, n-3-rich modified canola oil; nd, not determined.
a,b,c,d Mean values within a row with unlike superscript letters were significantly different (P < 0·05).
* Includes 15 : 0, 17 : 0, 19 : 0 and 21 : 0.
† Includes 17 : 1, 20 : 1n-7, 20 : 1n-11, 22 : 1n-7, 22 : 1n-9 and 24 : 1n-9.
‡ Includes 18 : 3n-6, 20 : 2n-6, 20 : 3n-6 and 22 : 4n-6.
Fat content and fatty acid compositions of erythrocytes and muscle in fish in the 12°C trial
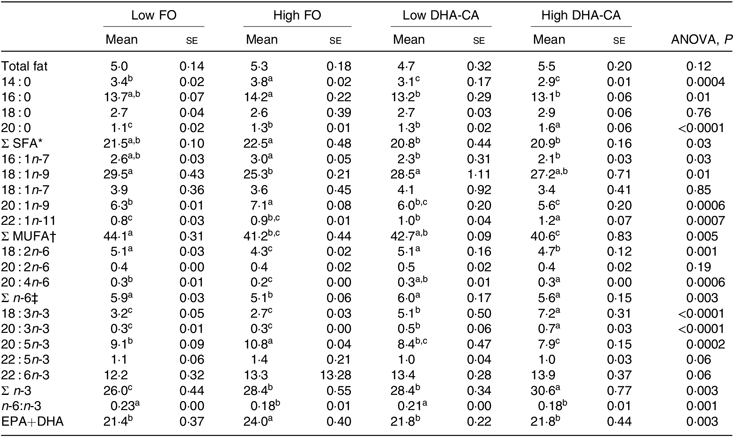
There were no significant differences in total lipid content in muscle between the dietary groups, with the lipid content (% of wet weight) of approximately 5 % in all dietary groups (Table 8). The total FA composition of the muscle showed only minor differences in the percentage of SFA (approximately 21 % of total FA) between the groups. The percentages of MUFA and total n-6 FA were mostly affected by the inclusion level of the oils and only moderately by the oil source. Thus, slightly lower percentages of MUFA (approximately 41 v. 43 %) and of n-6 FA (approximately 5·4 v. 6·0 %) were observed in the muscle from the High groups compared with those in the Low groups. The opposite result was found for the content of total n-3 FA, where the two High dietary groups had the highest percentages of n-3 FA (approximately 29 v. 27 %). The percentage of EPA was lower in the muscle of the two groups fed the DHA-CA diets compared with the FO diets, while 18 : 3n-3 and DHA were higher. The two Low dietary groups (Low FO v. Low DHA-CA) had approximately 22 %, and the two High dietary groups (High FO v. High DHA-CA) had approximately 24 and 22 %, respectively, of EPA+DHA in muscle, showing that the EPA+DHA from the DHA-CA oil was incorporated into muscle tissue to approximately the same extent as from FO.
Lipid content (% of wet weight) and fatty acid composition (% of total) in the muscle of Atlantic salmon fed the experimental diets for 83 d at low (12°C) water temperature
(Mean values using tank as a statistical unit (n 3, being each sample represented by a pool of five fish) with their standard errors)
FO, fish oil; DHA-CA, n-3-rich modified canola oil.
a,b,c Mean values within a row with unlike superscript letters were significantly different (P < 0·05).
* Includes 15 : 0, 17 : 0 and 24 : 0.
† Includes 14 : 1n-5, 16 : 1n-5, 16 : 1n-9, 17 : 1n-7, 20 : 1-11 and 22 : 1n-9.
‡ Includes 18 : 3n-6.
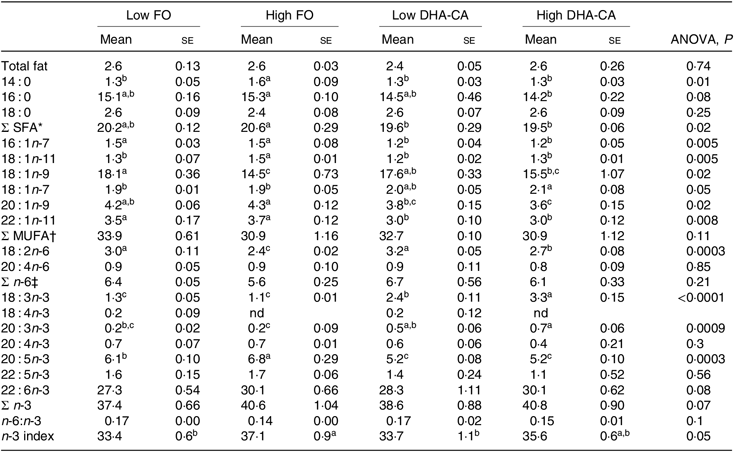
Total lipid content of erythrocytes was similar in all dietary groups (Table 9). The percentages of SFA were in general higher in the FO groups than in the two DHA-CA groups, while the MUFA and total n-6 FA were similar in all diet groups. The total n-3 FA were lower in the FO groups relative to their corresponding DHA-CA groups (Low FO v. Low DHA-CA and High FO v. High DHA-CA). The increase in total n-3 FA was due to the higher content of 18 : 3n-3 in the erythrocytes from fish fed the DHA-CA diets. Erythrocytes’ EPA content was higher in the FO groups than the DHA-CA groups due to a higher content of EPA in the FO diets. However, there was no significant difference in DHA content in erythrocytes of the different groups.
Lipid content (% of wet weight) and fatty acid composition (% of total) in erythrocytes of Atlantic salmon fed the experimental diets for 83 d at low (12°C) water temperature
(Mean values using tank as a statistical unit (n 3, being each sample represented by a pool of five fish) with their standard errors)
FO, fish oil; DHA-CA, n-3-rich modified canola oil; nd, not determined.
a,b,c Mean values within a row with unlike superscript letters were significantly different (P < 0·05).
* Includes 15 : 0, 17 : 0, 20 : 0, 22 : 0 and 24 : 0.
† Includes 14 : 1n-5, 16 : 1n-5, 16 : 1n-9, 17 : 1n-7, 20 : 1n-11, 20 : 1n-7, 22 : 1n-7 and 24 : 1n-9.
‡ Includes 16 : 2n-6, 18 : 3n-6, 20 : 2n-6, 20 : 3n-6 and 22 : 4n-6.
Liver responses in the fish reared at 12°C: liver lipids, metabolomics, markers for oxidative stress and transcriptome analysis
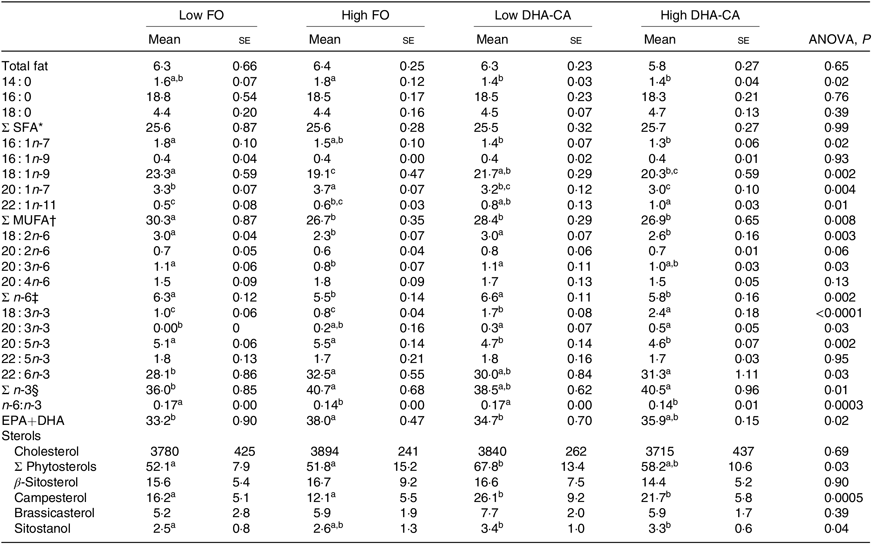
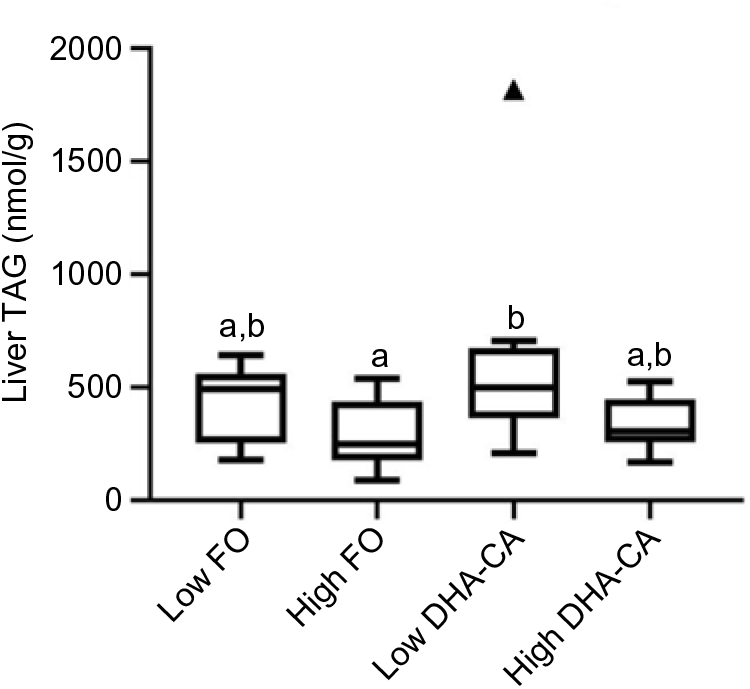
Liver lipids were analysed both by traditional methods for total lipid, total FA profile and sterol content (Table 10), as well as by lipidomic analysis, the later providing quantitation of the total TAG (Fig. 1) and determination of how the dietary FA are influencing the FA composition of different polar and neutral lipid classes (Fig. 2). Table 10 shows that there were no significant differences in total lipid content in liver between the dietary groups. The lipid content (% of wet weight) was 5·8 % in the High DHA-CA and approximately 6·3 % in the other dietary groups. The levels of TAG were affected by the inclusion level of the oils, but not by the oil source. Total TAG (P = 0·01, Fig. 1) was significantly lower in High FO and High DHA-CA compared with Low FO and Low DHA-CA.
Lipid content (% of wet weight), fatty acid composition (% of total), and sterols (mg/kg) in the liver of Atlantic salmon fed the experimental diets for 83 d at low (12°C) water temperature
(Mean values using tank as a statistical unit (n 3, being each sample represented by a pool of five fish) with their standard errors)
FO, fish oil; DHA-CA, n-3-rich modified canola oil.
a,b,c Mean values within a row with unlike superscript letters were significantly different (P < 0·05).
* Includes 15 : 0, 17 : 0, 20 : 0, 22 : 0 and 24 : 0.
† Includes 14 : 1n-5, 16 : 1n-5, 17 : 1n-7, 18 : 1n-7, 20 : 1n-11, 20 : 1n-9 and 22 : 1n-9.
‡ Includes 18 : 3n-6.
§ Includes 16 : 2n-3.
Total TAG in liver from salmon fed the four different diets (n 9 per diet group). TAG is given as nmol/g liver tissue, and the figure is a Tukey box plot, showing the median, the interquartile range and the min/max, excluding outliers (which are indicated by a triangle). Two-way ANOVA showed a significant difference (P = 0·01, q = 0·07) between the two inclusion levels (High v. Low) of transgenic canola oil (DHA-CA) in the diet. a,b Between the individual diet groups, there was a significant difference between High fish oil (FO) and Low DHA-CA (P = 0·005, q = 0·02).
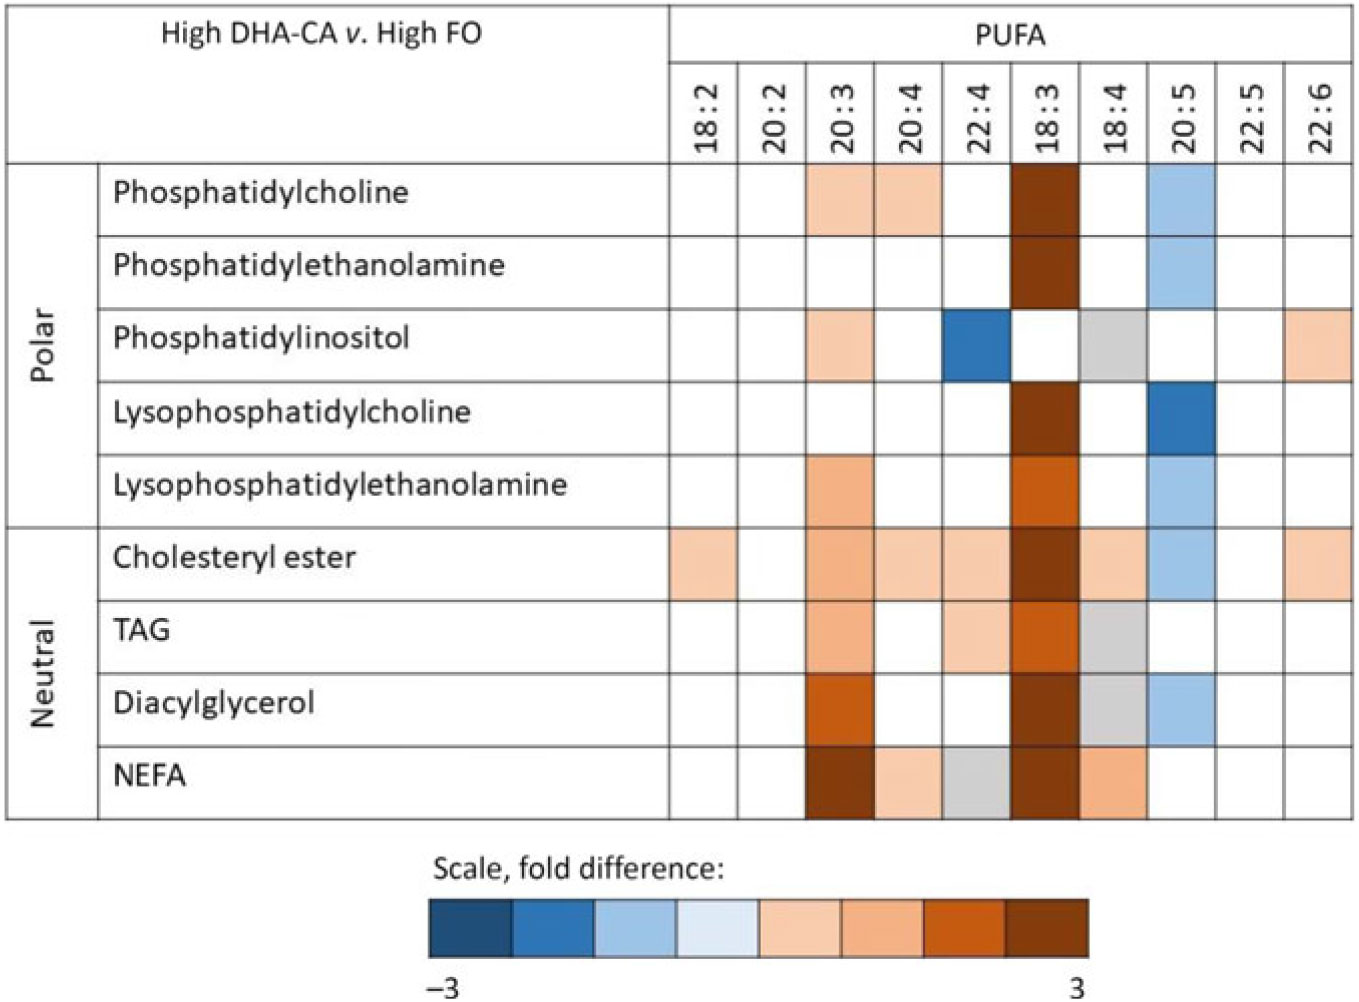
Overall differences in composition of PUFA in the different lipid classes in fish fed a diet containing high levels of an n-3-rich modified canola oil (High DHA-CA; blue = enriched in this group) v. in fish fed a diet containing high levels of fish oil (High FO; red = enriched in this group). Colour indicates a significant difference (P < 0·05) between the two diet groups. The colour intensity shows the fold difference (white = NS, grey = not detected).
The total FA composition of the liver (Table 10) showed no difference in the percentage of SFA (25 % of total FA) between the dietary groups. The percentages of MUFA and total n-6 FA showed slightly lower percentages of MUFA (approximately 27 v. 29 %) and of n-6 FA (approximately 5·6 v. 6·5 %) in the High groups compared with the Low groups. The opposite result was found regarding the content of total n-3 FA, where the two ‘High’ diets had the highest percentages of n-3 FA (approximately 41 v. 37 %). The percentage of EPA was lower in the liver of the two groups fed the DHA-CA diets compared with the FO diets, while 18 : 3n-3 and DHA were higher. The two Low dietary groups (Low FO v. Low DHA-CA, approximately 34 %) and the two High dietary groups (High FO v. High DHA-CA, approximately 37 %) had similar percentages of EPA+DHA in liver.
Lipidomic analyses did not separate between families of FA, but the FA compositions of different polar and neutral lipid classes in the liver were to different degrees affected by the dietary oils (Fig. 2). The most pronounced effects were seen on the incorporation of 18 : 3 FA, with a 2·4- to 2·9-fold increase in High DHA-CA v. High FO in most lipid classes. The proportion of 20 : 5 FA was decreased in most polar lipids in the liver of fish fed High DHA-CA v. High FO, with differences from 1·2- to 1·7-fold. The FA ratio of 20 : 4 increased in phosphatidyl choline (fold difference 1·3, P = 0·003) and also in cholesterol ester and free FA in fish fed High DHA-CA v. High FO. The FA ratio of 22 : 6 was significantly enriched in phosphatidylinositol of fish fed the High DHA-CA v. High FO and also in cholesterol ester (both 1·2-fold difference, P = 0·02). Liver cholesterol was similar in all diet groups, while the DHA-CA dietary groups had increased liver content of phytosterols, primarily campesterol and sitostanol (Table 10).
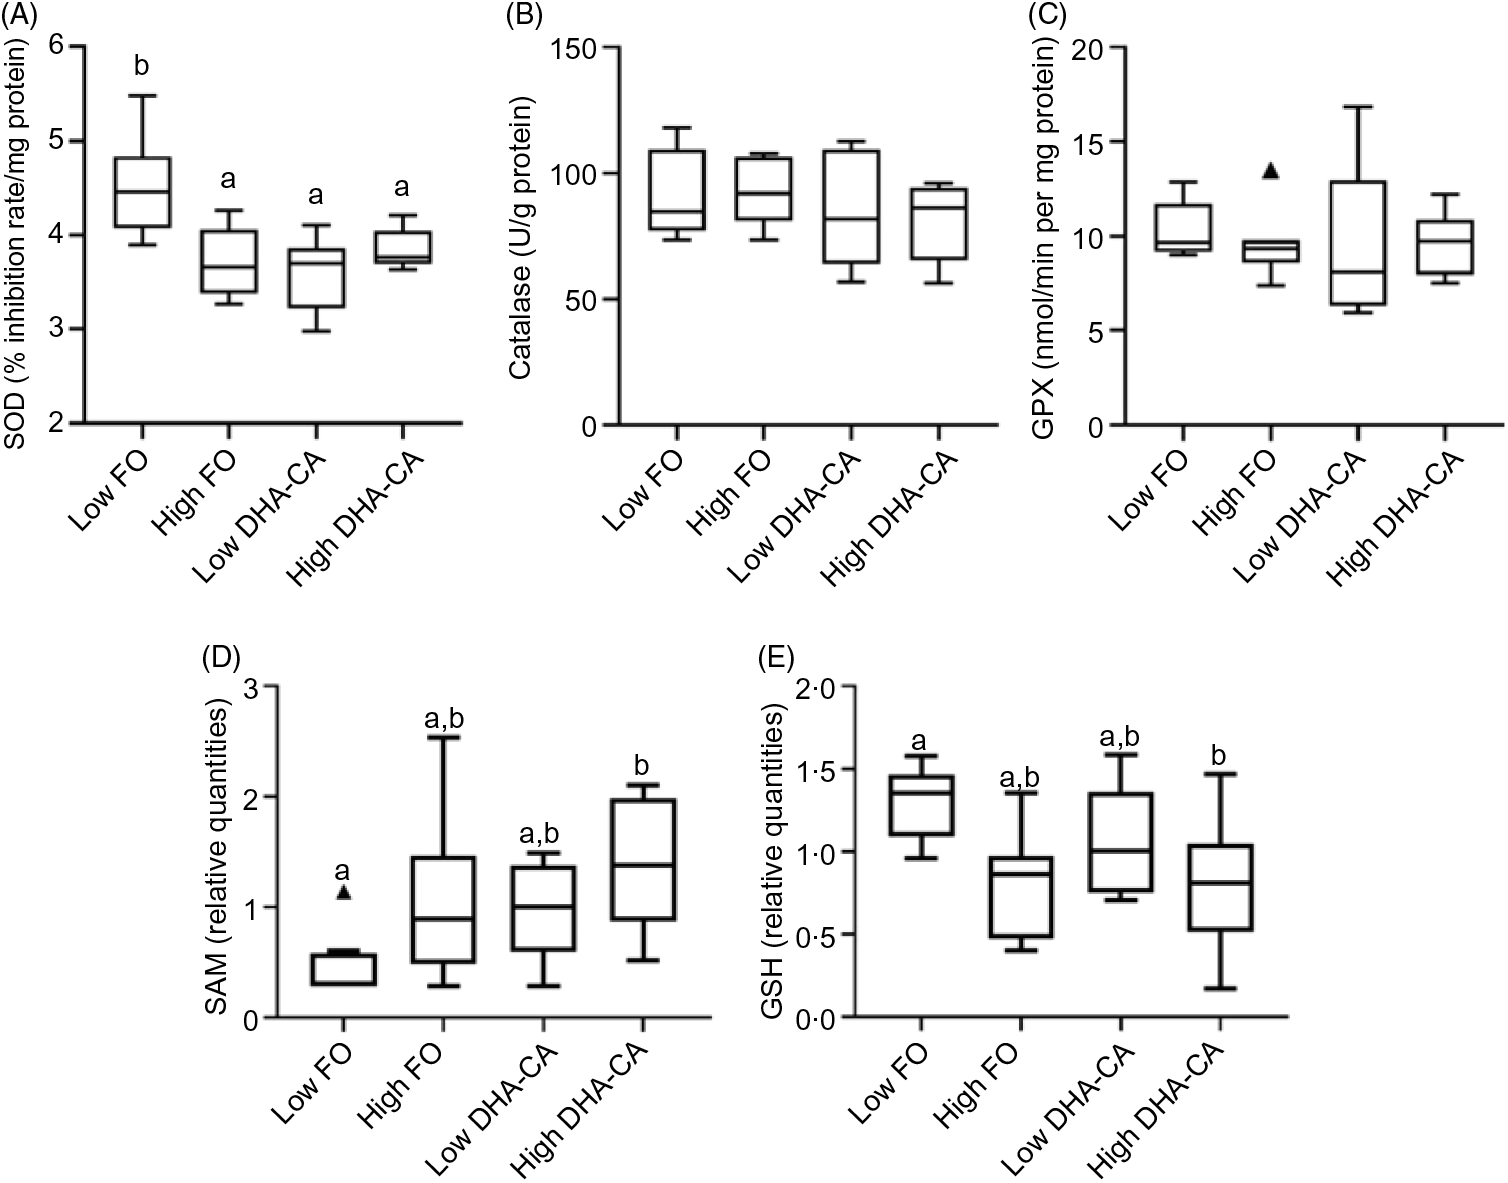
There were no significant differences in the activities of the key enzymes, catalase, glutathione peroxidase and superoxide dismutase associated with oxidative stress between the dietary treatments (Fig. 3). S-Adenosyl-L-methionine is also one of the major physiological protectors against oxidative stress. For S-adenosylmethionine, there was both a diet effect (DHA-CA fed fish livers had higher marker levels than FO fed fish livers, P = 0·005, q = 0·02) and an effect of level (the high inclusion level groups had higher than the Low inclusion groups, P = 0·006, q = 0·05). GSH had a clear effect due to the oil inclusion level, with higher metabolite levels at Low inclusion compared with high inclusion (P = 0·003, q = 0·04), irrespective of oil source. The GSSG was constant (not shown). As GSSG was constant, the ratio of GSSG to GSH was increased at the high inclusion levels.
Differences between the two inclusion levels (High v. Low) of transgenic canola oil (DHA-CA) in the diet. The upper panel shows the activities of three enzymes involved in the oxidative stress response in the liver: superoxide dismutase (SOD) (A), catalase (B) and glutathione peroxidase (GPX) (C). The lower panels show the levels of two metabolites related to redox management – S-adenosylmethionine (SAM) (D) and GSH (E) and are given as relative quantities. The graphs are Tukey box plots, showing the median, the interquartile range and the min/max, excluding outliers (which is indicated by a triangle), n 9 per diet group. For SAM, two-way ANOVA showed a significant difference (P = 0·006, q = 0·05) between the two inclusion levels (High v. Low) of DHA-CA in the diet. a,b Between the individual diet groups, there was a significant difference between Low fish oil (FO) and High DHA-CA (values with unlike letters are significantly different, P = 0·0002, q = 0·004). Similarly, for GSH, two-way ANOVA showed a significant difference (P = 0·003, q = 0·04) between the two inclusion levels. a,b Between the individual diet groups, there was a significant difference between Low FO and High DHA-CA (values with unlike letters are significantly different, P = 0·006, q = 0·04).
The gene expression profiles in livers of salmon fed High DHA-CA and High FO were nearly identical. Salmon fed Low FO and Low DHA-CA diets showed highly consistent stimulation of genes in lipid and cholesterol metabolism relative to the High groups. Twenty-two up-regulated differentially expressed genes encoded seventeen proteins with key roles in lipid and cholesterol metabolism (Table 11). Eighteen genes encode twelve enzymes of terpenoid backbone and steroid biosynthesis (diphosphomevalonate decarboxylase, farnesyl diphosphate synthase, 7-dehydrocholesterol reductase, isopentenyl-diphosphate Δ-isomerase, lanosterol 14-α demethylase, lanosterol synthase, mevalonate kinase, squalene mono-oxygenase, squalene synthase, stearoyl-CoA desaturase b, sterol-4-α-carboxylate 3-dehydrogenase and sterol-C5-desaturase). FA binding protein is required for transportation of highly lipophilic compounds, while insulin-induced gene 1 and lipin control steroid and FA metabolism at different levels. The expression differences of genes involved in lipid and steroid metabolism were related to the levels of n-3 LC-PUFA in the diets, but not to the source of these FA, as shown in Table 11. The microarray analysis revealed no significant differences in transcription of genes associated with stress, apoptosis, inflammation, xenobiotic metabolism or any other processes that might indicate adverse effects of the diets (data not shown).
Selected differentially expressed genes (DEG) in the liver from Atlantic salmon fed diets containing fish oil (FO) or oil from the n-3-rich modified canola (DHA-CA) for 83 d at low (12°C) water temperature*
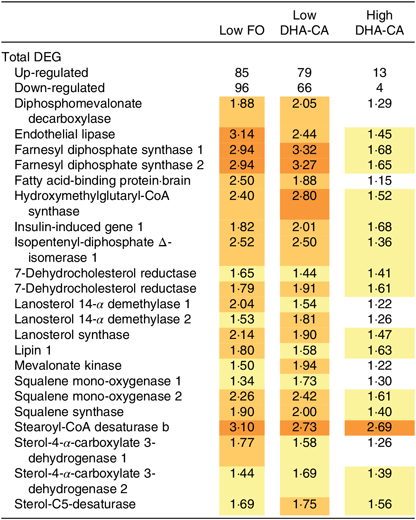
* Data are presented as relative to the diet containing high levels of FO, which is regarded as the reference level. Significantly up-regulated genes (log2-expression ratio > |0·6| (1·5-fold), P < 0·05) are highlighted with red scale.
Gene expression and histological analyses of the intestine
The histological analyses of intestinal morphology revealed no differences between the dietary groups (data not shown). Gene expression analysis of intestine tissue did not show any significant differences in expression of markers for FA oxidation (aco, cpt1), FA synthesis (fas, scd1, scd2), stress (hsp70), inflammation (cox2) or oxidative stress (nrf2, cat, sod1s, gpx2) between FO and DHA-CA for either the Low or the High groups. The High DHA-CA had a small, but significantly higher expression level of the apoptosis marker bax compared with the High FO group (online Supplementary Table S2).
Discussion
The major overall aim of the two fish feeding trials was to rigorously investigate the suitability and possible fish health safety risk associated with the use of oil from a newly developed GM canola crop (DHA-CA) as an n-3 FA source in feed for Atlantic salmon. The experiments used different fish populations, water temperatures and sources of raw ingredients to provide a robust assessment of DHA-CA in varying experimental conditions. Very small fingerlings were chosen as the target life stage as they undergo extremely rapid growth and are highly responsive to dietary changes due to their heightened sensitivity.
Influence of n-3-rich modified canola oil on culture performance
The experimental fish showed a 12- and 20-fold increase in body weights at 12 and 16°C, respectively, over the course of both experiments. The specific growth rate was higher in the high-temperature experiment, with Australian strains adapted to warm water conditions. Thermal growth coefficient indicated both cohorts grew similarly well at their respective temperatures. The DHA-CA groups, relative to the corresponding FO groups, grew equally well with high survival rates (≥94 %) achieved in both experiments.
Influence of n-3-rich modified canola oil on salmon health and safety
Intestine and liver are particularly sensitive organs to harmful effects. The expression of genes associated with stress or toxicity, or enzyme activities related to oxidative stress, was not affected in fish fed DHA-CA. The moderate effects observed in these organs were primarily due to the inclusion level of the oil in the diet and not to the oil source, results which further strengthen the fact that our trial could not reveal any major fish health risk associated with inclusion of DHA-CA in salmon diets. This is in agreement with studies showing that both a high-EPA oil and an EPA+DHA oil from transgenic Camelina sativa included in feeds for post-smolt Atlantic salmon had no detrimental effects on fish performance, metabolic responses or the nutritional quality of fillet(Reference Betancor, Sprague and Usher17, Reference Betancor, Sprague and Sayanova33).
The analysed composition of the DHA-CA oil in our trial compared with a conventional canola oil showed that it contained very low levels of undesirables, with levels measured far below limit of quantification of pesticides, mycotoxins, heavy metals and PAH. Further, DHA-CA also had lower levels of the typical plant oil FA – 18 : 1n-9 and 18 : 2n-6 – compared with a conventional canola oil and higher levels of γ-tocopherol and the health-beneficial n-3 FA – 18 : 3n-3 and DHA. Overall, these results show that the DHA-CA oil has a nutritionally beneficial composition compared with conventional canola oils in line with other n-3 rich oils derived from newly developed transgenic plant crops as reviewed by Tocher et al.(Reference Tocher, Betancor and Sprague34). The healthy profile of the DHA-CA oil investigated in the present study can explain that no negative effects on fish performance and health were found, even at high inclusion levels. The vitamin E (particularly γ-tocopherol) differed between DHA-CA and Ctr-CA; however, both oils were well within the normal range given for the different vitamin E isomers in commercial canola oil(35).
Influence of n-3-rich modified canola oil on composition of whole body, muscle and erythrocytes
The study showed no major differences in total lipid, protein or energy content of the whole body of fish in the various dietary groups, while the FA compositions were affected. Generally, for both temperature trials, lower percentages of both SFA and MUFA and higher percentages of 18 : 3n-3 and DHA were found in whole body of DHA-CA groups compared with the FO groups, reflecting the FA compositions of the diets. The level of EPA was moderately reduced with increased dietary inclusion of DHA-CA in the diet, due to the lower levels of this FA in DHA-CA oil. Overall, the results showed that the comparable Low FO v. Low DHA-CA and the High FO v. High DHA-CA diets resulted in equal percentages of EPA+DHA in the whole body, showing that the fish could equally utilise the EPA and DHA from traditional FO and from the DHA-CA oil. This is also in agreement with what has been observed with the EPA rich oil and the EPA+DHA rich oil from Camelina sativa (Reference Betancor, Sprague and Sayanova33, Reference Betancor, Li and Sprague36).
An additional benefit of DHA-CA compared with conventional canola oil is the lower levels of n-6 FA, which results in lower body levels of n-6 FA when included in the diet. The n-6 FA are linked to pro-inflammatory pathways and generally tend to bio-accumulate with the use of terrestrial plant oils to replace FO(Reference Bou, Berge and Baeverfjord37). The muscle tissue showed similar trends to the FA profiles of those of the whole body, except for lower relative percentages of MUFA and higher percentages of n-3 PUFA. This indicates the fish fillet FA profile is potentially of greater nutritional benefit to human nutrition as a result feeding DHA-CA rather than a more conventional mixture of canola oil and FO.
The different dietary groups had only minor differences in their FA composition of erythrocytes, showing that the erythrocytes are less affected by the dietary FA than whole body and muscle. There were no significant differences in the EPA+DHA content or total n-6 FA content between any of the dietary groups in erythrocytes; the most marked effect was increased 18 : 3n-3 and reduced 18 : 2n-6 with increase in dietary DHA-CA level in the diet.
Response of liver to n-3-rich modified canola oil
Previous data have shown that genetic modification of canola can give large unintended effects on phytosterol composition (both increase and decrease)(Reference Abidi, List and Rennick38). Results from our study show that dietary DHA-CA oil results in a 10–30 % higher level of phytosterols in liver than that occurs in the comparable FO-fed groups. However, a recent feeding trial with Atlantic salmon fed diets with added different phytosterol levels showed no negative effect of phytosterols up to 3000 mg/kg feed(Reference Sissener, Rosenlund and Stubhaug25, Reference Sissener, Liland and Holen39). In our study, the highest dietary level with the highest dose of DHA-CA was 739/kg feed, showing that no negative effects due to increased phytosterol in diet or in the liver would be expected. There was a moderately lower level of cholesterol in the diets containing the DHA-CA than in the two FO diets; however, the gene expression results from livers showed that a relatively large number of genes in the sterol biosynthesis, among them several genes with important roles in cholesterol synthesis, including lanosterol synthase, squalene synthase and sterol-4-α-carboxylate-3 dehydrogenase, were up-regulated in both the Low FO and Low DHA-CA groups compared with the two High groups, indicating that it is not the cholesterol level in the diet that effects the expression of these genes in liver in our study, rather the n-3 LC-PUFA levels. This is contradictory to studies showing that the cholesterol synthesis in Atlantic salmon is regulated by the dietary content of cholesterol, that is, high dietary levels able to inhibit and low dietary levels able to stimulate cholesterol synthesis(Reference Kortner, Björkhem and Krasnov40). However, other factors may also influence cholesterol metabolism. In line with our findings, previous mammalian studies have reported that EPA and DHA have hypocholesterolaemic effects by reducing hepatic cholesterol synthesis(Reference Park, Choi and Jin41).
The FA that varied the most in the liver total lipids between the four experimental dietary groups was 18 : 3n-3 (from 0·8 to 12·4 % of total FA), and this was also reflected in the different lipid classes, with 18 : 3 enriched in most liver lipid classes in fish fed the DHA-CA dietary groups compared with the FO groups. While EPA+DHA was well balanced between DHA-CA diets and their corresponding FO control groups, the DHA:EPA ratio was higher in the DHA-CA dietary groups. Hence, 20 : 5 FA decreased in the cell membrane PLs phosphatidyl choline, phosphatidylethanolamine, lyso phosphatidyl choline, cholesterol ester and TAG in the livers of fish fed the DHA-CA diets. DHA increased primarily in cholesterol ester and phosphatidylinositol. In the current diets, formulated for small fish, a high proportion of LC-PUFA was also provided from the FM fraction rather than the oils, resulting in fairly high EPA levels in all feeds above requirements. The FA 20 : 3 increased in most lipid classes. Although the lipid class analyses do not separate between FA families, this is probably the elongation product from 18 : 3n-3 to 20 : 3n-3, since this FA also increases in the total lipid fraction.
There were no significant differences in the total lipid level in the liver, while total TAG was moderately lower in both the high inclusion level of LC-PUFA irrespective of source. This is opposite to earlier findings with EPA rich oil from Camelina sativa in salmon diets which resulted in a moderate increase in liver TAG(Reference Betancor, Sprague and Sayanova33). However several studies have shown that a FO rich in EPA and DHA results in decreased TAG level in liver when compared with a diet rich in plant oil, in line with our findings here(Reference Bou, Berge and Baeverfjord5, Reference Sissener, Torstensen and Owen42). A factor could be 18 : 1n-9, which was higher in the two feeds with low oil levels (Low FO and Low DHA-CA) compared with the two feeds with high oil levels (High FO and High DHA-CA) and has in previous trials/cell trials been implicated in liver lipid accumulation(Reference Todorčević, Vegusdal and Gjøen43). These data indicate a positive effect on fish liver health and metabolism of a high inclusion level of LC-PUFA, irrespective of whether this source is FO or DHA-CA.
Conclusions
Our results show that the newly developed modified canola oil (DHA-CA) has a beneficial FA profile compared with conventional plant oils, with particularly high levels of the n-3 FA – 18 : 3n-3 and DHA. Levels of phytosterols, vitamin E and minerals in the n-3 modified canola oil fall within the natural variation of commercial canola oils. Levels of undesirable compounds were undetectable.
Two feed trials have been carried out with salmon in fresh water, the purpose of which has been to evaluate the suitability and safety associated with the use of n-3-rich modified canola oil on fish performance, composition and health at two water temperatures. The fish increased their weight approx. 20-fold at 16°C and 12-fold at 12°C. Both experiments showed high survival across all dietary groups and corresponding growth in salmon fed with a FO diet to salmon fed n-3 modified canola oil. The salmon fed the n-3 modified canola oil had the same EPA+DHA content and proportional (%) level in the whole body as salmon fed FO. The level of oil in the experimental feeds was the main factor affecting differential expression of genes and not the source of the oil. The level of oil in the feeds was also the determining factor for the measured health biomarkers in liver, intestine and muscle and not the source of the oil. Based on the current studies, it is concluded that the n-3-rich modified canola oil (DHA-CA) is as safe as other commercial canola oils and is suitable as an alternative oil source in salmon diets.
Ethical statement
The cultivation and production of DHA-CA oil was conducted with approval from the CSIRO Animal Ethics Committee, approval number A6/2016. Approved methodology was in accordance with the ‘Australia Code for the care and Use of Animals for Scientific Purposes’ 8th edition, and all associated legislation and regulations regarding the welfare of animals.
The feeding trial with Atlantic salmon (project FOTS ID 8378) was conducted in compliance with the Norwegian national regulation for use of experimental animals (FOR-2015-06-18-761) and classified as not requiring a specific license (§2-f, corresponding to Directive 2010/63/EU Article 1, section 5f), since the experimental treatments were not expected to cause any distress or discomfort for the fish (FOTS decision reference no. 8378).
Acknowledgements
The authors thank Nuseed R&D Lead Malcolm Devine, of the Omega-3 Program and Benita Boettner, Global Lead of Commercial Strategy in Nuseed for providing the DHA-CA and control CA oil and for their valuable contribution to scientific trial design and scientific discussions. The authors are grateful to Målfrid Bjerke, Leikny Fjeldstad and Jacob Wessels for skilful technical assistance. For the CSIRO led high-temperature trial, we thank David Blyth for extruding diets and technical expertise overseeing the CSIRO experiment, Simon Irvin for logistics and ethic approval, Barney Hines, Nicholas Bourne and Sue Cheers for chemical composition analysis of the CSIRO samples. Thanks to Rod Smith and Amanda Bergamin for their help with pressing suitable canola oil fractions, Richard Taylor for organising fish shipment and vaccination and Joel Slinger for receiving and acclimating fish. Thanks to Glenn Elliot and Santi Done, from Nu-Mega, for providing the control tuna oil. Finally, Surinder Singh for his knowledge of the DHA-CA oil and assistance with experimental design.
This work was funded by The Norwegian Seafood Research Fund – FHF (grant no. FHF901037).
B. R. has, as project leader, contributed to the formulation of the research questions, design of the study and writing of article. N. H. S. and M. S. contributed to the design of the study, analyses of environmental pollutants, nutrients and lipidomic analyses and writing of article. C. J. S. and P. D. N. contributed to design and analyses of the 16°C water temperature trial and writing of article. A. K. and E. L. contributed with the gene expression analyses and writing of article. G. M. B., T.-K. Ø. and M. B. contributed with design and analyses of the 12°C water temperature trial and writing of article.
There are no conflicts of interest.
Supplementary material
For supplementary material referred to in this article, please visit https://doi.org/10.1017/S0007114519002356


 Open access

