Milk protein and fat are the main determinants of nutritional value of milk, and people are constantly striving to raise the contents of milk protein and fat through feeding and nutrition technology in the breeding process(Reference Dias, Garcia and Islam1–Reference Roy, Ye and Moughan3). Milk protein and fat are mainly synthesised in mammary epithelial cells (MEC). The regulation of milk protein synthesis in MEC is mainly controlled by the mechanistic target of rapamycin (mTOR), which is well known the most central signalling for protein synthesis(Reference Osorio, Lohakare and Bionaz4–Reference Dong, Zhou and Saremi6). The lipogenic transcription factor sterol regulatory element binding protein 1c (SREBP-1c) is a key regulator of TAG synthesis and has been proven a master regulator of milk fat synthesis(Reference Li, Zhao and Wei7–Reference Qiu, Qu and Zhen9). The premature full length form of SREBP-1c (fSREBP-1c) can be activated into the mature nuclear form of SREBP-1c (nSREBP-1c), which enters nucleus and binds to gene promoters of lipogenic enzymes for their expression leading to increased TAG synthesis(Reference Xiao, Xiong and Yang10,Reference Zhang, Li and Hu11) .
Amino acids, especially the branched chain amino acids including leucine, valine and isoleucine (Ile), are not only substrates for protein synthesis but also key signalling stimuli for mTOR phosphorylation (activation) and SREBP-1c expression and maturation in MEC(Reference Son, Park and Lee12–Reference Li, Zhou and Li15). In branched chain amino acids, leucine and valine can stimulate the mTOR and SREBP-1c signalling pathways via activation of phosphatidylinositol 3 kinase (PI3K), which is a central hub of ‘early stage’ signalling pathways sensing extracellular stimuli such as nutrients and hormones(Reference Che, Xu and Gao16,Reference Guo, Liang and Zheng17) .
Besides directly stimulating mTOR phosphorylation and SREBP-1c maturation in the cytoplasm, amino acids can also up-regulate these gene expressions leading to subsequent protein activation. We have previously demonstrated that some nuclear factors, such as purine-rich element binding protein B, the NF-κB1) and glycyl-tRNA synthetase, can mediate amino acid signalling to mTOR and SREBP-1c expression for milk protein and fat synthesis(Reference Huo, Yu and Li18–Reference Luo, Qi and Huang20). The molecular mechanism via which amino acids stimulate mTOR and SREBP-1c expression is still largely unknown. Nevertheless, the role of Ile in the regulation of milk synthesis in MEC is rarely reported and yet unclear.
Brahma-related gene 1 (BRG1), encoded by the SMARCA4 gene, is the core component of the mammalian switch/sucrose non-fermentable chromatin remodelling complex. BRG1 is composed of multiple domains which include an evolutionarily conserved catalytic ATPase domain, a conserved C-terminal bromodomain, AT-hook motif and the N-terminal region(Reference Mashtalir, D’Avino and Michel21,Reference Wu, Lian and Stein22) . The ATPase domain can translate energy generated by ATP hydrolysis to histone modification and mechanical motion on DNA templates; thus, BRG1 can epigenetically regulate gene transcriptional activation through chromatin remodelling(Reference Mashtalir, D’Avino and Michel21–Reference Wu, Kamikawa and Donohoe23). It has been found that BRG1 is the most important chromatin remodeller, and many transcription factors activate or inhibit gene expression by binding with BRG1 to regulate histone modifications such as H3K27ac, H3K27me3 and H3K4me3 at specific gene enhancers(Reference Wu, Kamikawa and Donohoe23–Reference Zhu, Lan and Yi25). BRG1 is ubiquitously expressed in cancer cells and promotes the malignant tumour phenotype(Reference Hartley, Leung and Ahmad26–Reference Wang, Song and Cao28). There are still few reports on the regulatory mechanism of BRG1 in normal cellular physiology, and it is still unknown whether BRG1 plays a regulatory role in the stimulation of amino acids on milk synthesis in MEC. Furthermore, it is still largely unknown whether amino acids can regulate the mTOR and SREBP-1c signalling pathways through an epigenetic mechanism of chromatin remodelling.
We previously found by proteomics analysis that BRG1 might be associated with amino acid-stimulated milk synthesis in MEC (data used in another study and not shown). In this study, we intend to explore the role of Ile on milk protein and fat synthesis in MEC and the underlying molecular mechanism associated with BRG1-mediated chromatin remodelling.
Methods
Collection of mouse mammary gland tissues
Samples of mouse mammary gland tissues of different periods were collected to detect BRG1 expression. Animal experiments were performed in compliance with the Regulations on Animal Experimentation of Yangtze University. Twelve healthy female ICR (the Institute of Cancer Research) mice were divided on average into three groups: 8-week-old in puberty, 11-week-old on the 14th lactating day and 12-week-old on the 3rd day in dry period. These mice were killed by dislocation of the spinal cord and the mammary gland tissues were aseptically excised and stored at –86°C.
Cell culture and treatments
Bovine MEC (BMEC) were separated and subcultured from mammary glands of healthy lactating Holstein cows harvested from a local slaughter house. This protocol was approved by the Ethical Committee for Animal Welfare from Northeast Agricultural University. Cell purity was identified by immunofluorescence observation with an anti-cytokeratin 18 antibody (sc-51582, Santa Cruz). Identified BMEC were maintained in a DMEM/F12 complete medium (Gibco) containing 10 % fetal bovine serum (Gibco) and 100 U/ml of antibiotic (penicillin and streptomycin) in a 5 % CO2 atmosphere at 37°C. Digestion and subculture were carried out when cells were grown up to 90 % confluence in DMEM/F12 medium.
Cell cultures were incubated with fetal bovine serum-free OPTI-MEMI medium (Gibco) for 24 h and grown to 70–80 % confluence (∼1 × 10⁵ cells/cm2) before all experimental treatments. Ile (purity > 99 %) was purchased from a company (S20042, YuanYe) and dissolved in OPTI-MEMI medium to form a 50 mM solution. Cells were treated with Ile (0, 0·25, 0·5, 0·75, 1·0 and 1·25 mM) (final concentration) and cultured for 24 h. To inhibit the PI3K activity, cells were treated for 24 h with the specific PI3K inhibitor LY294002 (S1737, Beyotime) (15 μM).
Western blotting
Whole cell lysates were obtained by re-suspending cell pellets in RIPA buffer (Beyotime) with freshly added protease inhibitor. Protein samples were denatured, separated by 8–10 % SDS-PAGE and transferred to nitrocellulose membranes. The membranes were blocked in 5 % non-fat milk for 1·5 h at room temperature and then incubated with primary antibodies at 4°C overnight. Primary antibodies were used against the following targets: β-casein (bs-10032R, Bioss, 1:500), mTOR (bs-1992R, Bioss, 1:500), p-mTOR (Ser2448) (#2971, CST, 1:500), fSREBP-1c (140881-AP, Proteintech, 1:1000), nSREBP-1c (bs-1402R, Bioss, 1:500), BRG1 (216341-AP, Proteintech, 1:1000), AKT (bs-0115R, Bioss, 1:500), p-AKT (Thr308) (bs-2720R, Bioss, 1:500), H3 (17168-1-AP, Proteintech, 1:1000), H3K27me3 (39055, Active Motif, 1:1000), H3K27ac (39034, Active Motif, 1:1000) and β-actin (sc-47778, Santa Cruz, 1:200). The membranes were further incubated with a horseradish peroxidase-conjugated goat anti-rabbit secondary antibody (A0208, Beyotime, 1:2000) or a goat anti-mouse secondary antibody (A0216, Beyotime, 1:2000) at 37°C for 1 h. Next, Western blots on the membranes were observed with an enhanced chemiluminescence detection kit (Applygen) and were visualised by a chemiluminescence instrument (JS-1070, PeiQing).
Detection of TAG secretion
TAG can be secreted by MEC into culture medium, and their content is an important indicator of milk fat synthesis in MEC. The content of TAG in culture medium was measured with a TAG assay kit (E1013, Applygen) at 550 nm using a microplate reader (SpectraMax iD3 Multi-Mode, Molecular Devices).
Detection of lipid droplet by fluorescent microscopy
BMEC were replated onto coverslips in a six-well plate. When cells reached approximately 30–40 % confluence, they were fixed with 4 % paraformaldehyde (room temperature, 15 min) and washed with PBS. Lipid droplets were stained for 15 min with 1 μg/ml BODIPY 493/503 (D3922, Invitrogen). Following BODIPY staining, cells were washed three times. Finally, nuclei were stained with DAPI (C02-04002, Bioss) in the dark for 10 min. Subsequently, lipid droplets formed in cells were observed under a fluorescence microscope (DLMB-2, Leica). Fifteen cells were analysed for each sample. The area-integrated optical density of lipid droplet puncta per cell was analysed by using Image J.
Small-interfering RNA selection and transfection
Three pairs of small-interfering RNA (siRNA) targeting BRG1 mRNA and negative control were purchased from GenePharma. BMEC in a well of 6-well plate were transfected with 200 pmol siRNA or negative control RNA oligonucleotide using the GP-transfect-Mate (G04008, GenePharma) following the user’s manual. The knockdown efficiency was evaluated by Western blotting analysis. One pair of the three pairs of siRNA targeting BRG1 mRNA was selected for further use, and the oligonucleotide sequences were as follows: sense, 5'-CCUCAACGCCAAGGCCUAUTT-3'; antisense, 5'-AUAGGCCUUGGCGUUGAGGTT-3'.
Gene activation vector construction and transfection
Gene activation of BRG1 was performed using the CRISPR-dCas9 technology. Briefly, four sgRNA targeting different sites in the BRG1 promoter (NCBI Gene ID: 414274) were designed on the bioinformatics website http://chopchop.cbu.uib.no/. The fragments of sgRNA were: 183, 5'-CACCGGGGACCGTTTGTCCAGTTG-3'; 594, 5'-CACCGCAGGTCGATGTTCCGATGA-3'; 671, 5'-CACCGCTTCCAAGGTCGTGCATGA-3'; and 982, 5'-CACCGCTAGACGCGCACGCGCGCT-3'. These fragments were individually cloned into the pSPgRNA vector (Addgene). For BRG1 gene activation, one of these recombinant plasmids was co-transfected into cells with the SP-dCas9-VPR plasmid (hereafter named as VPR) (#63798, Addgene) using the GP-transfect-Mate (G04008, GenePharma), according to the manufacturer’s instruction. BMEC co-transfected with the empty vectors pSPgRNA and VPR served as the negative control. Cells were harvested at 48 h after transfection for further analysis. The most effective gene activation vector, pSPgRNA-183, was selected by Western blotting analysis.
RNA isolation and qRT-PCR
RNA was extracted with the RNAeasy Animal RNA Isolation Kit with Spin Column (R0026, Beyotime), according to the manufacturer’s instructions. RT reaction was performed using the BeyoRTII First Strand cDNA Synthesis Kit (D7168S, Beyotime). qRT-PCR was subsequently performed using the BeyoFast SYBR Green qPCR Mix Kit (D7260, Beyotime) on a CFX96 real-time PCR system (Bio-Rad) with the following primers: mTOR, F: 5'-CTGGATTTCACGGACTATGC-3', R: 5'-GATGGTTGATTCGGTGTCTC-3'; SREBP-1c, F: 5'-CAGTAGCAGCGGTGGAAGTG-3', R: 5'-GAGAGACAGAGGAAGACGAGTG-3'; and GAPDH, F: 5'-CCTGCCGCCTGGAGAAACCT-3', R: 5'-GAAGAGTGAGTGTCGCTGTTGAAGT-3'. PCR consisted of forty cycles of 95°C for 15 s and 60°C for 15 s and a final cycle (95°C, 15 s; 60°C, 15 s and 95°C, 15 s) generated a dissociation curve to confirm a single product. Relative mRNA expression was determined by the 2−ΔΔCt method. GAPDH was used as a normalisation gene and the value of the control group was arbitrarily set as 1·00.
ChIP assay
ChIP assay was carried out following the instruction of the ChIP Assay Kit (P2078, Beyotime). All buffers contained 1 mM phenylmethanesulfonyl fluoride (ST506, Beyotime). Treated cells were cross-linked with 1 % formaldehyde. Then cells were precipitated and incubated in the SDS Lysis Buffer. The cell lysate was sonicated on ice (10 s pulse, 30 s break, 3–4 times, 20 W power) by an ultrasonic homogeniser (JY92-IIN, Scientz) to break the genome into 200–1000 bp in size. Next, the cell lysate was collected after centrifugation at 14 000 × g at 4°C for 5 min. Soluble chromatin (1 %) was kept as the input control. Chromatin solution was incubated overnight at 4°C with antibody against BRG1 (21634-1-AP, Proteintech), H3K27ac3 (39034, Active Motif) or H3K27me3 (39055, Active Motif). RNA polymerase II served as a positive control and IgG negative control. Next day, the antibody was collected using the A + G agarose. Afterward, the washed chromatin solution from the antibody was denatured in 5 M NaCl at 65°C for 4 h and concentrated to 30 μl with the DNA Purification Kit (D0033, Beyotime).
PCR was performed to amplify target sequence using series of specific primers to identify the protein binding sites in the mTOR and SREBP-1c promoters. The PCR products were observed by agarose gel electrophoresis and verified by sequencing. ChIP-PCR only detected one same product for all of BRG1, H3K27ac3 and H3K27me3 binding sites in the mTOR or SREBP-1c promoters, and these primers were used for ChIP-qPCR analysis. The primers were described as follows: mTOR, F: 5'-CCTTTAGGATGGACTGGTTG-3', R: 5'-TGCAGATGGTGATTGTAGCC-3'; SREBP-1c, F: 5'-TTTGGCACTCAGCTTTCTTT-3', R: 5'-CGGATGACACCACCCTTAT-3'.
Statistical analysis
Data are shown as mean values with their standard error of the mean from at least three independent experiments. Student’s t test was used to determine statistically significant differences between two means. Differences among groups were tested by ANOVA. Different letters represented significant differences between groups. Differences between experimental groups were considered significant at P < 0·05 or highly significant at P < 0·01.
Results
Isoleucine promotes milk protein and fat synthesis in mammary epithelial cells in a dose-dependent manner
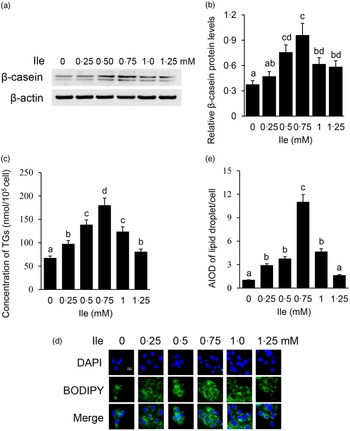
The purity of BMEC was identified by immunofluorescence observation of CK18 in cells (online Supplementary Fig. S1). BMEC were treated with different concentrations of Ile (0, 0·25, 0·5, 0·75, 1·0 and 1·25 mM) for 24 h. Casein proteins are the main kind of proteins in milk, in which content accounts for about 80 % w/w of the total milk protein. β-casein is one kind of the most abundant casein protein and often used as the indicator of milk protein synthesis in in vitro cell model analysis. Western blotting analysis detected that the protein levels of intracellular β-casein (Fig. 1(a) and (b)) were gradually increased with the increasing concentrations of Ile, peaked at 0·75 mM, then gradually decreased with Ile more than 0·75 mM. Ile treatment also affected the amount of TAG in the culture medium (Fig. 1(c)) and lipid droplet accumulation in cells (Fig. 1(d) and (e)), as the same trend of β-casein. These data suggest that Ile stimulates milk protein and fat synthesis in BMEC in a dose-dependent manner.
Ile dose dependently promotes milk protein and fat synthesis in BMEC. (a) BMEC were treated with different concentrations of Ile (0, 0·25, 0·50, 0·75, 1·0 and 1·25 mM). β-casein protein level was analysed by Western blotting analysis. (b) Relative fold of β-casein protein level (protein/β-actin) from the Western blots in (a) was quantified by grey scale scan. (c) Amount of TAG in the culture medium was monitored using a TAG assay kit. (d) Lipid droplets in cells were observed by a fluorescence microscope. DAPI (blue), lipid droplet (green). Scale bar represents 25 μm. (e) AIOD of lipid droplet puncta per cell from (d) was analysed by using Image J. Fifteen cells were analysed for each sample. The AIOD of the control group was set as 1·00 for clarity. Data are the mean values with their standard error from three independent experiments (n 3). a,b,c,d Mean values with unlike letters were significantly different (P < 0·05).Ile, isoleucine; BMEC, bovine mammary epithelial cell; AIOD, area-integrated optical density.

Isoleucine stimulates the signalling pathways related to milk protein and fat synthesis
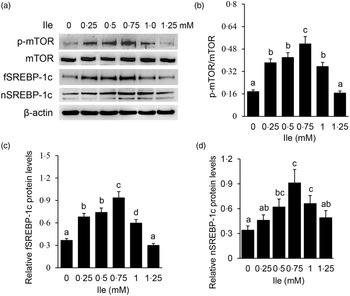
Western blotting detected that Ile treatment significantly increased the protein level of p-mTOR (Fig. 2(a) and (b)), and the protein levels of fSREBP-1c (Fig. 2(a) and (c)) and nSREBP-1c (Fig. 2(a) and (d)), with the most increase occurring at 0·75 mM Ile treatment. These data suggest that Ile might enhance the mTOR and SREBP-1c signalling pathways for milk protein and fat synthesis.
Ile affects the mTOR and SREBP-1c signalling pathways in a dose-dependent manner. (a) Cells were treated as in Fig. 1. Western blotting analysis was performed to measure the indicated protein levels. (b) The ratio of p-mTOR to mTOR in (a) was quantified by grey scale scan. (c) and (d) Relative folds of fSREBP-1c (c) and nSREBP-1c (d) levels (protein/β-actin) in (a) were quantified by grey scale scan. Data are the mean values with their standard error from three independent experiments (n 3). a,b,c,d Mean values with unlike letters were significantly different (P < 0·05). Ile, isoleucine; mTOR, mechanistic target of rapamycin; SREBP-1c, sterol regulatory element binding protein 1c.

Isoleucine stimulates Brahma-related gene 1 expression in a phosphatidylinositol 3 kinase-dependent manner
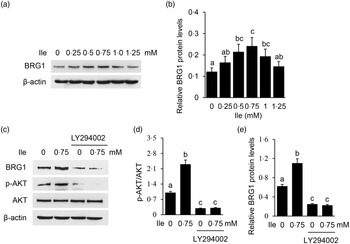
The expression of BRG1 was also significantly affected in cells treated with Ile (Fig. 3(a) and (b)), the same trend as p-mTOR as shown in Fig. 2(a) and (b). PI3K inhibition was confirmed in cells treated with LY294002 by Western blotting analysis of phosphorylation of AKT, which is a substrate of PI3K (Fig. 3(c) and (d)). PI3K inhibition totally abolished Ile-stimulated BRG1 expression (Fig. 3(c) and (e)). These data demonstrate that PI3K is required for Ile to stimulate BRG1 expression and suggest that BRG1 might be involved in the regulation of Ile on milk synthesis.
PI3K is required for Ile to stimulate BRG1 expression. (a) BMEC were treated as in Fig. 1. BRG1 protein levels were measured by Western blotting analysis. (b) Relative fold of BRG1 level (protein/β-actin) in (a) was quantified by grey scale scan. (c) Cells were treated with LY294002 (15 μM) and Ile (0·75 mM) for 24 h. Western blotting analysis was performed to measure the indicated protein levels. (d) The ratio of p-AKT to AKT from the Western blots in (c) was quantified by grey scale scan. (e) Relative fold of BRG1 level (protein/β-actin) from the Western blots in (c) was quantified by grey scale scan. Data are the mean values with their standard error from three independent experiments (n 3). a,b,c Mean values with unlike letters were significantly different (P < 0·05). PI3K, phosphatidylinositol 3 kinase; Ile, isoleucine; BRG1, Brahma-related gene 1; BMEC, bovine mammary epithelial cell.

Brahma-related gene 1 is a key mediator for isoleucine to stimulate milk protein and fat synthesis
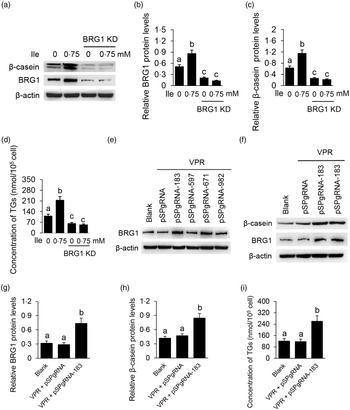
We then determined the role of BRG1 in the stimulation of Ile on milk protein and fat synthesis in BMEC. BRG1 knockdown (Fig. 4(a) and (b)) significantly blocked Ile-stimulated β-casein synthesis (Fig. 4(a) and (c)) and secretion of TAG from cells into the culture medium (Fig. 4(d)). An effective gene activation vector (pSPgRNA-183) to stimulate BRG1 expression was selected from four recombinant pSPgRNA plasmids (Fig. 4(e)). BRG1 gene activation (Fig. 4(f) and (g)) significantly increased β-casein synthesis in BMEC (Fig. 4(f) and (h)) and TAG secretion into the culture medium (Fig. 4(i)). These data demonstrate that BRG1 is a key mediator of the stimulation of Ile on milk protein and fat synthesis in BMEC.
BRG1 mediates the stimulation of Ile on milk protein and fat synthesis. (a) Western blotting analysis of β-casein protein level in BMEC transfected with a BRG1 siRNA and treated with Ile (0·75 mM) for 24 h. (b) and (c) Relative folds of BRG1 (b) and β-casein (c) protein levels (protein/β-actin) from the Western blots in (a). (d) Amount of TAG in the culture medium was monitored using a TAG assay kit. (e) Western blotting analysis of BRG1 expression levels in cells transfected with each of four different BRG1 gene activation vectors. (f) Western blotting analysis of β-casein protein level in BMEC transfected with the gene activation vectors pSPgRNA-183 and VPR. Cells transfected with pSPgRNA and VPR served as a negative control. Two technical replicates of pSPgRNA-183 and VPR transfection were shown. (G and H) Relative folds of BRG1 (g) and β-casein (h) protein levels from the Western blots in (f). (i) Amount of TAG in the culture medium was monitored. Data are the mean values with their standard error from three independent experiments (n 3). a,b,c Mean values with unlike letters were significantly different (P < 0·05). BRG1, Brahma-related gene 1; Ile, isoleucine; BMEC, bovine mammary epithelial cell.

Brahma-related gene 1 mediates the stimulation of isoleucine on the mechanistic target of rapamycin and sterol regulatory element binding protein 1c pathways
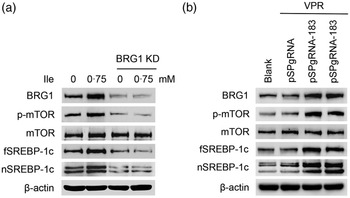
We next determined the effects of BRG1 on the signalling pathways leading to milk protein and fat synthesis. Western blotting analysis showed that BRG1 knockdown blocked mTOR phosphorylation and fSREBP-1c and nSREBP-1c protein levels increased by Ile (Fig. 5(a)), whereas BRG1 gene activation significantly activated mTOR and stimulated SREBP-1c expression and maturation (Fig. 5(b)).
The effects of BRG1 on the signalling pathways associated with milk synthesis. (a) Western blotting analysis of indicated protein levels in BMEC transfected with a BRG1 siRNA and treated with Ile (0·75 mM) for 24 h. (b) The expression of indicated proteins in cells transfected with the gene activation vectors pSPgRNA-183 and VPR. Two technical replicates of pSPgRNA-183 and VPR transfection were shown. Data are the mean values with their standard error from three independent experiments (n 3). a,b,c Mean values with unlike letters were significantly different (P < 0·05). BRG1, Brahma-related gene 1; BMEC, bovine mammary epithelial cell; Ile, isoleucine.

Isoleucine stimulates the binding of Brahma-related gene 1 to mechanistic target of rapamycin and sterol regulatory element binding protein 1c promoters
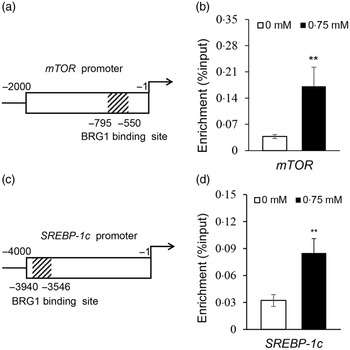
To elucidate how BRG1 mediates Ile stimulation on the mTOR and SREBP-1c signalling pathways, we further observed the binding of BRG1 to mTOR and SREBP-1c promoters using ChIP analysis and analysed the effects of Ile on these bindings. Only one sequence (–550 to –795 bp) was amplified in the promoter (–1 to –4000 bp) of mTOR (Fig. S2, Fig. 6(a)), suggesting that there might be only one binding site of BRG1 in the promoter of mTOR. ChIP-qPCR further detected that Ile significantly increased BRG1 binding to the mTOR promoter (Fig. 6(b)). ChIP-PCR also detected that only one sequence (–3546 to –3940 bp) was amplified in the promoter (–1 to –4000 bp) of SREBP-1c (Fig. S3, Fig. 6(c)). ChIP-qPCR further detected that Ile markedly increased BRG1 binding to the SREBP-1c promoter (Fig. 6(d)). These results suggest that BRG1 might mediate Ile signalling to the mTOR and SREBP-1c pathways through binding to these two promoters.
Ile stimulates BRG1 binding to the gene promoters of mTOR and SREBP-1c. (a) Twelve primers to amplify the different regions of the gene promoter (–1 to −2000 bp) of mTOR were used for ChIP-PCR analysis of the binding site of BRG1 in the gene promoter of mTOR. Only one sequence (–550∼ –795 bp) was amplified in the promoter of mTOR, and the corresponding primers were used for next ChIP-qPCR. Figure depicts the binding region of BRG1 in the gene promoter of mTOR. (b) ChIP-qPCR analysis of the binding of BRG1 to the gene promoter of mTOR in cells stimulated by Ile (0·75 mM). (c) ChIP-PCR analysis of the binding site of BRG1 in the gene promoter of SREBP-1c. Twenty-three primers were used to amplify the different regions of the gene promoter (–1 to −4000 bp) of SREBP-1c. Only one sequence (–3546 to −3940bp) was amplified in the promoter of SREBP-1c, and the corresponding primers were used for next ChIP-qPCR. Figure depicts the binding region of BRG1 in the gene promoter of SREBP-1c. (d) ChIP-qPCR analysis of the binding of BRG1 to the gene promoter of SREBP-1c in cells stimulated by Ile (0·75 mM). Data are the mean values with their standard error from three independent experiments (n 3). ‘**’, P < 0·01. Ile, isoleucine; BRG1, Brahma-related gene 1; mTOR, mechanistic target of rapamycin; SREBP-1c, sterol regulatory element binding protein 1c.

Brahma-related gene 1 regulates H3K27ac and H3K27me3 deposition on the mechanistic target of rapamycin and sterol regulatory element binding protein 1c promoters
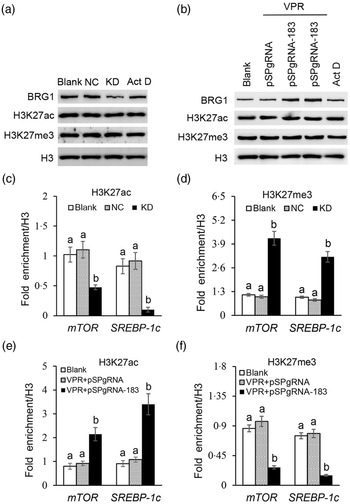
We further explored how BRG1 activates mTOR and SREBP-1c gene transcription. Our previous ChIP-PCR results showed only one binding site of H3K27ac or H3K27me3 in the promoter of mTOR (Reference Qi, Wang and Zhang29). In this experiment, we further found also only one binding site of H3K27ac or H3K27me3 in the promoter of SREBP-1c (online Supplementary Figs S4 and S5). Expectedly, these binding sites in these two promoters were the same as those of BRG1. Western blotting detected that BRG1 knockdown (Fig. 7(a)) or gene activation (Fig. 7(b)) did not affect the protein levels of H3K27ac and H3K27me3 in cells. Actinomycin D is a transcription inhibitor, which can be used to detect whether changes of protein levels are associated with their gene transcription. In addition, actinomycin D also did not affect BRG1, H3K27ac and H3K27me3 protein levels (Fig. 7(a) and (b)), suggesting that these protein levels might be stable in cells and might not have a keen relationship with their gene expression. ChIP-qPCR further found that BRG1 knockdown hindered the binding of H3K27ac (Fig. 7(c)) but triggered the binding of H3K27me3 (Fig. 7(d)) to mTOR and SREBP-1c promoters, whereas BRG1 gene activation had the opposite effects (Fig. 7(e) and (f)). These results suggest that BRG1 mediates Ile signalling to mTOR and SREBP-1c mRNA expression through triggering H3K27ac and inhibiting H3K27me3 binding to their promoters.
Effects of BRG1 on the binding of H3K27ac and H3K27me3 to the mTOR and SREBP-1c gene promoters. (a) Western blotting analysis of indicated protein levels in BMEC transfected with a BRG1 siRNA or treated with Act D (transcription inhibitor). (b) Western blotting analysis of indicated protein levels in BMEC transfected with the gene activation vectors pSPgRNA-183 and VPR or treated with Act D. (c) and (d) ChIP-qPCR analysis of the binding of H3K27ac (c) and H3K27me3 (d) to the gene promoters of mTOR and SREBP-1c in cells transfected with a BRG1 siRNA. (e) and (f) ChIP-qPCR analysis of the binding of H3K27ac (e) and H3K27me3 (f) to the gene promoters of mTOR and SREBP-1c in cells transfected with the BRG1 gene activation vectors pSPgRNA-183 and VPR. Data are the mean values with their standard error from three independent experiments (n 3). a,b Mean values with unlike letters were significantly different (P < 0·05). BRG1, Brahma-related gene 1; mTOR, mechanistic target of rapamycin; SREBP-1c, sterol regulatory element binding protein 1c; BMEC, bovine mammary epithelial cell; Act D, actinomycin D.

Brahma-related gene 1 mediates isoleucine signalling to mRNA expression of mechanistic target of rapamycin and sterol regulatory element binding protein 1c
qRT-PCR analysis further detected that BRG1 knockdown diminished Ile-stimulated mTOR (Fig. 8(a)) and SREBP-1c (Fig. 8(b)) mRNA expression, whereas BRG1 gene activation significantly promoted these mRNA expressions (Fig. 8(c) and (d)). These data demonstrate that BRG1 mediates Ile signalling to mTOR and SREBP-1c mRNA expression.
Effects of BRG1 on Ile signalling to mRNA expression of mTOR and SREBP-1c. (a) and (b) qRT-PCR analysis of mTOR (a) and SREBP-1c (b) mRNA levels in cells transfected with a BRG1 siRNA and treated with Ile (0·75 mM) for 24 h. (c) and (d) qRT-PCR analysis of mTOR (c) and SREBP-1c (d) mRNA levels in cells transfected with the gene activation vectors pSPgRNA-183 and VPR. Data are the mean values with their standard error from three independent experiments (n 3).a,b,c Mean values with unlike letters were significantly different (P < 0·05). BRG1, Brahma-related gene 1; Ile, isoleucine; mTOR, mechanistic target of rapamycin; SREBP-1c, sterol regulatory element binding protein 1c.

Brahma-related gene 1 is highly expressed in the lactating period of mouse mammary gland
To provide in vivo evidence that BRG1 is involved in milk synthesis in mammary gland, we observed its expression in mouse mammary gland of different periods. Western blotting analysis detected that BRG1 was expressed in all of mouse mammary glands of puberty, lactating and dry periods. The expression of BRG1 in lactating period was markedly higher than that in puberty or dry period (Fig. 9(a) and (b)). These data were in consistent with that BRG1 is a key positive regulator of milk protein and fat synthesis in MEC.
Expression of BRG1 in mouse mammary glands. (a) Western blotting analysis of BRG1 protein levels in mouse mammary glands of puberty, lactating and dry periods. (b) Relative folds of BRG1 protein levels from the Western blots in (a). Data are the mean values with their standard error (n 4). a,b Mean values with unlike letters were significantly different (P < 0·05). BRG1, Brahma-related gene 1.

Discussion
The regulatory role of Ile in milk synthesis is yet unclear, and the corresponding molecular mechanism remains poorly defined. In this study, we demonstrate that Ile promotes β-casein synthesis and milk fat synthesis, mTOR phosphorylation, SREBP-1c expression and maturation, and BRG1 expression in BMEC in a dose-dependent manner. Ile stimulates BRG1 expression in a PI3K-dependent manner. BRG1 is a key positive regulator of milk protein and fat synthesis and mediates Ile signalling to the mTOR and SREBP-1c signalling pathways. Ile stimulates BRG1 binding to the promoters of mTOR and SREBP-1c. BRG1 functions through triggering the binding of H3K27ac but inhibiting the binding of H3K27me3 to these two promoters, thereby mediating Ile signalling to gene transcription of mTOR and SREBP-1c. BRG1 is highly expressed in mouse mammary gland of lactating period.
We observed that Ile promoted β-casein synthesis, TAG secretion and lipid droplet formation in a dose-dependent manner, and the maximal effect was at the dose of 0·75 mM. When the concentration of Ile was more than 0·75 mM, the stimulatory effects gradually diminished. Additionally, Ile also increased in the same way phosphorylation of mTOR, and expression and maturation of SREBP-1c, which are the two main signalling pathways associated with milk protein and fat synthesis. We previously have shown that Met, leucine and Lys promote milk synthesis in MEC in a dose-dependent manner, and the maximal effects were at the dose of 0·60, 0·75 and 0·70 mM, respectively(Reference Qiu, Qu and Zhen9,Reference Li, Li and Wang14,Reference Qi, Meng and Jin30) , in agreement with our results. It is still unknown why excess of Ile has deleterious effects. We speculate that excess amino acids might cause antagonism and imbalance among amino acids, desensitisation of their cognate receptors or produce toxic secondary metabolites. From our experimental data and previous reports, we conclude that Ile can stimulate the mTOR and SREBP-1c signalling leading to milk protein and fat synthesis in MEC and functions in a dose-dependent manner.
BRG1, as a central enzyme subunit of the switch/sucrose non-fermentable chromatin remodelling complex, regulates gene expression, DNA replication, repair and recombination through the epigenetic mechanism of histone modification. Though BRG1 is the most important chromatin remodeller, it is still unknown whether BRG1 plays a regulatory role in milk synthesis. Our gene function study results showed that BRG1 mediated Ile signalling to mRNA expression of mTOR and SREBP-1c, leading to milk protein and fat synthesis in MEC. We noted that the protein level of non-phosphorylated mTOR always maintained relatively stable: when the mRNA expression of mTOR increased, its protein phosphorylation also increased, but the non-phosphorylated mTOR remained unchanged, and vice versa. These results were consistent with our previous studies, which might reflect a dynamic balance between mTOR mRNA expression, protein synthesis and protein phosphorylation(Reference Li, Li and Wang14,Reference Li, Zhou and Li15) . In breast cancer cells, BRG1 up-regulates cell proliferation and the expression of enzymes responsible for fatty acid and lipid biosynthesis(Reference Sobczak, Pietrzak and Płoszaj31,Reference Sun, Yuan and Chen32) . BRG1 modulates SREBP activity to stimulate SREBP target gene transcription for lipid synthesis in hepatocytes(Reference Li, Li and Hong33). BRG1 contributes to lipid metabolism by stimulating gene transcription of SREBP cleavage activating protein(Reference Kong, Zhu and Shao34). These reports show that BRG1 is a key positive regulator of cell growth and anabolism, in agreement with our data. Our experimental data demonstrate that Ile promotes milk synthesis in a BRG1-dependent manner, and BRG1 functions via controlling gene transcription of mTOR and SREBP-1c. A series of previous findings have depicted that amino acids can activate mTOR and SREBP-1c through signalling pathways in the cytoplasm(Reference Wolfson and Sabatini35–Reference Condon and Sabatini37). In comparison with these reports, our findings demonstrate that the switch/sucrose non-fermentable subunit ATPase BRG1 mediates Ile stimulation on gene transcription of mTOR and SREBP-1c and thus uncover a novel layer of regulation of activation of the mTOR and SREBP-1c signalling pathways by amino acids.
We showed that Ile stimulated BRG1 expression through the PI3K signalling. PI3K is a central hub of ‘early stage’ signalling in response to extracellular stimuli, and several previous reports have demonstrated that amino acids can activate PI3K through G protein-coupled receptors or amino acid transporters(Reference Li, Li and Wang14,Reference Guo, Liang and Zheng17,Reference Qi, Meng and Jin30) . It is still unknown the G protein-coupled receptor or amino acid transporter that can mediate Ile signalling to PI3K activation needs to be explored in future study. We observed that PI3K mediated Ile stimulation on BRG1 expression, but the underlying molecular mechanism is still unknown. Treatment with the transcription inhibitor actinomycin D did not affect the protein level of BRG1, indicating that BRG1 protein level is stable and has little relationship with their gene expression. Based on this observation, we speculate that Ile might stimulate BRG1 expression via other mechanism but not regulating their gene expression. Increasing reports have proved that BRG1 protein level in the nucleus can be regulated through the process of ubiquitination and deubiquitination(Reference Huang, Zhao and Chen38–Reference Wang, Young and Jeng40). ARID1A, another key subunit of the switch/sucrose non-fermentable complex, can also be regulated by ubiquitination and deubiquitination(Reference Luo, Wu and Nan41). We speculate that Ile might affect BRG1 expression through specific ubiquitinase or deubiquitinase, and we will carry out this research in the future.
The deposition of H3K27ac and H3K27me3 on gene enhancers is a well-known epigenetic mark of gene activation and gene inhibition, respectively(Reference Igolkina, Zinkevich and Karandasheva42–Reference Bandara, Otsuka and Matsubara44). ChIP-PCR with BRG1, H3K27ac and H3K27me3 antibodies detected that only one same sequence was amplified in the promoter of mTOR or SREBP-1c. We have previously shown that ARID1A also binds to the same site in the promoter of mTOR and inhibits H3K27ac deposition on this site and negatively regulate mTOR gene transcription(Reference Qi, Wang and Zhang29). Gene function study results showed that BRG1 stimulated H3K27ac but decreased H3K27me3 binding to these two promoters. Taken together, these above data suggest that these sites might be enhancers of mTOR and SREBP-1c.
There are regions at both the N- and C-termini outside the catalytic ATPase domain of BRG1 that serve as protein interaction modules to induce active histone modifications such as H3K27ac and H3K27me3 to genomic targets(Reference He, Wu and Tian45–Reference Trotter and Archer47). In consistent with these previous reports, our experimental data prove that BRG1 functions through regulating deposition of H3K27ac and H3K27me3 on gene enhancers of mTOR and SREBP-1c in MEC. Furthermore, ChIP-qPCR detected that Ile significantly increased BRG1 binding to these ‘possible enhancers’ of mTOR and SREBP-1c, and qRT-PCR analysis validated that BRG1 mediated Ile signalling to mRNA expression of mTOR and SREBP-1c. Taken together, we conclude that BRG1 functions as a key mediator of Ile signalling to the gene transcription of mTOR and SREBP-1c through regulating chromatin remodelling including H3K27ac and H3K27me3 deposition on these promoters.
In summary, current study uncovers that Ile stimulates milk protein and fat synthesis in MEC by up-regulation of mTOR and SREBP-1c gene expression through BRG1-mediated chromatin remodelling, in which BRG1 triggers H3K27ac but inhibits H3K27me3 deposition on mTOR and SREBP-1c promoters for their transcription. Increasing reports highlight that amino acids can regulate animal production through epigenetic mechanism(Reference Ji, Wu and Dai48,Reference Marín-García and Llobat49) . Our findings uncover a novel layer of epigenetic regulation by amino acids such as Ile on the signalling pathways associated with milk protein and fat synthesis, which would lay a deep theoretical foundation for the utilisation of Ile in milk production.
Acknowledgements
This work was supported by grants from National Natural Science Foundation of China (no. 31671473).
H. Q. and Z. W. designed the research and performed the experiments; L. W. analysed the results; M. H. and M. Z. provided critical reagents; X. G., H. Q. and Z. W. wrote and reviewed the manuscript.
The authors declare no conflict of interest.
Supplementary material
For supplementary materials referred to in this article, please visit https://doi.org/10.1017/S0007114522001544