


Introduction
Apple is among the most important fruits grown in northeastern North America, yet apple growing can be arduous due to the diversity and abundance of pests and diseases that can attack the trees and the fruit (Vincent and Roy, Reference Vincent and Roy1992; Vincent and Bostanian, Reference Vincent and Bostanian1998). Without applications of insecticides, more than half of the region's production would be damaged (Chouinard et al., Reference Chouinard, Philion and Cormier2006). In a typical commercial orchard in Quebec, for example, over 14 pesticide applications are needed during the growing season to limit production losses (Morin and Chouinard, Reference Morin and Chouinard2001). The broad spectrum of insecticides generally used impact a multitude of organisms that can be either damaging or beneficial to the crop (Thistlewood, Reference Thistlewood1991; Bishop et al., Reference Bishop, Collins, Mineau, Burgess, Read and Risley2000; Biddinger et al., Reference Biddinger, Robertson, Mullin, Frazier, Ashcraft, Rajotte, Joshi and Vaughn2013). Furthermore, intensive application and repeated use of compounds containing the same active ingredient often result in natural selection of resistant individuals among pests (Grigg-McGuffin et al., Reference Grigg-McGuffin, Scott, Bellerose, Chouinard, Cormier and Scott-Dupree2015).
Exclusion systems have been developed and used to prevent pest damage and reduce economic losses in many organic crops (Granatstein et al., Reference Granatstein, Kirby, Ostenson and Willer2016). The structure characteristics of exclusion systems have also been adapted for fruit trees, and their effectiveness appears promising for reducing the need for insecticides, as nets provide an impenetrable barrier against harmful pests. In Quebec apple orchards, exclusion netting systems are generally installed in a row-by-row design and are closed above the base of the trunks with clips (Chouinard et al., Reference Chouinard, Firlej and Cormier2016, Reference Chouinard, Veilleux, Pelletier, Larose, Philion and Cormier2017). The soil is therefore excluded from the system, which prevents the development of most pests [e.g., codling moth (Cydia pomonella), apple maggot (Rhagoletis pomonella) and plum curculio (Conotrachelus nenuphar)] that complete their life cycle in the soil or at the base of the trunk (Agnello et al., Reference Agnello, Chouinard, Firlej, Turechek, Vanoosthuyse and Vincent2006). Furthermore, nets are installed before bud break to protect trees against early season pests [e.g., tarnished plant bug (Lygus lineolaris)]. However, while these nets exclude pests, they also prevent pollinators from reaching the flowers.
Apple trees have self-sterile flowers and require pollen from another cultivar to ensure fruit set (Ramírez and Davenport, Reference Ramírez and Davenport2013). Pollen transfer is carried out exclusively by pollinating insects, since apple pollen is too heavy to be propagated by wind (Boyle-Makowski and Philogene, Reference Boyle-Makowski and Philogene1985). The ability of pollinators to carry out cross-pollination is paramount for apple fruit set; otherwise, fertilization and seed initiation do not take place, as the flower dries and falls without forming a fruit. In North America, honey bees (Apis mellifera) are the most efficient and commonly used commercial pollinator in fruit trees, including apples (Gardner and Ascher, Reference Gardner and Ascher2006).
However, other wild bees, such as bumble bees (Bombus spp., Hymenoptera: Apidae), are also proving to be excellent pollinators of fruit tree orchards (Thomson and Goodell, Reference Thomson and Goodell2001). Many studies have already demonstrated that bumble bees are an effective complementary pollinator to honey bees when introduced in various crops, resulting in higher fruit set, fruit size (i.e., diameter), yield and number of seeds per fruit (Calzoni and Speranza, Reference Calzoni and Speranza1996; Dag et al., Reference Dag, Zipori and Pleser2006; Desjardins and De Oliveira, Reference Desjardins and De Oliveira2006; Zisovich et al., Reference Zisovich, Goldway, Schneider, Steinberg, Stern and Stern2012; Brittain et al., Reference Brittain, Williams, Kremen and Klein2013; Garibaldi et al., Reference Garibaldi, Steffan-Dewenter, Winfree, Aizen, Bommarco, Cunningham, Kremen, Carvalheiro, Harder, Afik, Bartomeus, Benjamin, Boreux, Cariveau, Chacoff, Dudenhöffer, Freitas, Ghazoul, Greenleaf, Hipólito, Holzschuh, Howlett, Isaacs, Javorek, Kennedy, Krewenka, Krishnan, Mandelik, Mayfield, Motzke, Munyuli, Nault, Otieno, Petersen, Pisanty, Potts, Rader, Ricketts, Rundlöf, Seymour, Schüepp, Szentgyörgyi, Taki, Tscharntke, Vergara, Viana, Wanger, Westphal, Williams and Kleijn2013, Reference Garibaldi, Carvalheiro, Leonhardt, Aizen, Blaauw, Isaacs, Kuhlmann, Kleijn, Kleijn, Kremen, Morandin, Scheper and Winfree2014; Mallinger and Gratton, Reference Mallinger and Gratton2015). Indeed, bumble bees' activity exceeds that of honey bees under many conditions (Garibaldi et al., Reference Garibaldi, Steffan-Dewenter, Winfree, Aizen, Bommarco, Cunningham, Kremen, Carvalheiro, Harder, Afik, Bartomeus, Benjamin, Boreux, Cariveau, Chacoff, Dudenhöffer, Freitas, Ghazoul, Greenleaf, Hipólito, Holzschuh, Howlett, Isaacs, Javorek, Kennedy, Krewenka, Krishnan, Mandelik, Mayfield, Motzke, Munyuli, Nault, Otieno, Petersen, Pisanty, Potts, Rader, Ricketts, Rundlöf, Seymour, Schüepp, Szentgyörgyi, Taki, Tscharntke, Vergara, Viana, Wanger, Westphal, Williams and Kleijn2013, Reference Garibaldi, Carvalheiro, Leonhardt, Aizen, Blaauw, Isaacs, Kuhlmann, Kleijn, Kleijn, Kremen, Morandin, Scheper and Winfree2014).
Exclusion netting systems appear to represent a good alternative to insecticides and may become the norm for organic orchard management in the future (Chouinard et al., Reference Chouinard, Veilleux, Pelletier, Larose, Philion and Cormier2017, Reference Chouinard, Veilleux, Pelletier, Larose, Philion, Joubert and Cormier2019). Currently, nets must be opened for a few hours on 2–3 suitable days during bloom to ensure successful pollination by honey bees and adequate fruit set. This repeated, labor intensive opening–closing operation could be avoided if pollinators could be introduced in the exclusion netting system. Honey bees do not tolerate being restricted to an enclosed space such as the interior of nets (Vaissière et al., Reference Vaissière2000). However, bumble bees are commonly used for pollination in sheltered crops such as greenhouses and high tunnels (see Table IV in Velthuis and Van Doorn, Reference Velthuis and Van Doorn2006) and appear promising for this purpose.
The aim of the study was to test the effectiveness of commercially available Bombus impatiens in net-secluded hives for pollinating apple blossoms without having to open the nets. The first objective was to compare the value of pollination services provided by bumble bees placed under nets to that provided by pollinators (primarily honey bees and wild bees such as bumble bees and other bees) naturally present within the orchard. Based on previous studies (e.g., Boyle-Makowski and Philogene, Reference Boyle-Makowski and Philogene1985; Thomson and Goodell, Reference Thomson and Goodell2001) that compared the pollination of bumble bee and honey bee, we hypothesized that apple trees pollinated by commercial bumble bee hives in plots under exclusion netting systems would: (1) offer a satisfactory fruit set; and (2) provide equivalent fruit quality (i.e., weight, size and number of seeds). The second objective was to compare the efficacy of bumble bees from hives under exclusion netting systems in two positions, either at the end or in the middle of the tree row. Tested hypotheses were as follows: (1) the location of hives under exclusion netting systems would not influence the quality of fruit (i.e., weight, size and number of seeds) produced by apple trees; and (2) fruit load (i.e., total number of fruit per tree) would decrease as the distance between commercial bumble bee hives and trees to be pollinated increased.
Materials and methods
Experimental setup
This 2-year study (2016–2017) was conducted in the experimental orchard of the Research and Development Institute for the Agri-environment (IRDA), located in Saint-Bruno-de-Montarville, Quebec, Canada (45°32′35.8″N, 73°20′29.0″W). Eight adjacent rows of dwarf apple trees, cv. GingerGold on B-9 rootstock, were selected from a 3-year-old high-density plot. Each row was divided into two experimental plots (plot length: 18.5 m, tree height: 3 m) containing 14 trees each. Four treatments were compared: (1) introduction of a bumble bee hive placed at the end of the row, under nets; (2) introduction of a bumble bee hive placed in the middle of the row, under nets; (3) negative control with no pollinators, under nets and (4) agronomic control with nearby bee hives (<50 m), without nets. Treatments were applied randomly and repeated four times. Sampled trees were pre-selected in all 16 experimental plots (6–8 apple trees in 2016 and 5 in 2017).
Exclusion netting system
The net support structures were installed in early April 2016, based on the complete exclusion netting system described by Chouinard et al. (Reference Chouinard, Veilleux, Pelletier, Larose, Philion and Cormier2017) in order to create a hexagonal tunnel to hold the net away from the branches (Supplementary Fig. 1). The nets, made of clear high-density polyethylene (18.5 × 9 m; mesh size: 1.90 mm × 0.95 mm; 60 g m−2; 87% light transmission) (ProtekNet®, Dubois Agrinovation, Saint-Rémi, Quebec, Canada), were installed before bloom (installation dates: May 3, 2016 and April 24, 2017). During installation, nets were carefully sealed as tightly as possible around each tree trunk to prevent insects from climbing up and penetrating the interior of the net. The nets remained set up in the plot during the entire growing season and were removed after harvest (mid-September).
Pollination technique
Ten commercial bumble bee hives of B. impatiens were purchased from Koppert Canada Limited (Natupol©, Scarborough, Ontario, Canada, https://www.koppert.ca/). Each Natupol hive contained a full colony with a queen, plus 50 workers and brood (pupae, eggs and larvae). Hives were received 5–7 days prior to expected full bloom and were equipped with feeders that provided a nectar solution. In each colony a black plastic pollen dispenser was installed in the hive (Supplementary Fig. 2). Hives were placed under nets 3 days before expected full bloom (May 18, 2016 and May 15, 2017). In addition, a white plastic board (coroplast) of the same size as the hive (10 × 11 × 8″) was installed on all hives as insulation and protection against harsh weather. Hives were opened and bumble bees were allowed to acclimatize to the net environment for half a day. Apple pollen from a compatible pollinizer (cv. Rome Beauty; Firman Pollen, Yakima, Washington, USA, http://www.firmanpollen.com/) was used for cross-pollination because only one cultivar was present in each experimental plot. Fresh pollen was added to the dispenser each sampling day during bloom (3 days in 2016 and 2 days in 2017). Quality testing (i.e., pollen germination tests) of stored pollen (−18°C) was performed in 2017 to ensure its viability (+75% germination) (R. Reisbick, Firman Pollen, personal communication).
Management
For the duration of the study, no pesticides or any other chemical management were applied, except for ground fertilizers. However, due to heavy spring rains in 2017, fungicide treatments (captan) against apple scab (Venturia inaequalis) needed to be applied to save the crop. In 2016, each experimental plot was manually thinned after June drop according to standard commercial practices. However, in 2017, because of high scab incidence, no thinning was needed or performed.
Sampling
Sampling is divided into three categories focused on three components of pollination:
-
Floral visitation rate. Sampling was performed on days with suitable weather conditions, i.e., sunny, temperatures above 15°C and winds below 11 km h−1 (May 21–23, 2016 and May 17–18, 2017) (Martins et al., Reference Martins, Gonzalez and Lechowicz2015). In 2016, we counted the number of bumble bees foraging per tree over a period of 10 min. However, this sampling was modified the following year because we realized that it overestimated the counts due to bumble bees moving from tree to tree and being counted twice. Therefore, in 2017, ten bumble bee workers were visually tracked for 3 min in each plot that contained a commercial hive (for a total of 30 min of observation per plot). Observations were made from outside the plot to minimize interference yet ensure a clear view of the foraging workers (Pyke, Reference Pyke1978; Goulson, Reference Goulson2010). For each bee, the floral visitation rate (number of flowers visited per minute) was calculated by dividing the number of floral visits by the duration of the observation period (Javorek et al., Reference Javorek, Mackenzie and Vander Kloet2002). A visit was considered to have occurred when the bee touched the stamens and/or the pistil of a flower. The presence or absence of a pollen load in the pollen basket was used to confirm flower pollination activity by foragers.
(1) Pollination efficacy. For this study, the pollination efficacy of bumble bees under nets was defined as the effect of pollination on (1) fruit load, (2) fruit quality and (3) seed yield. Total fruit load was assessed by evaluating the total number of flower buds in the pink stage (May 17, 2016 and May 10, 2017) and the total number of fruits in mid-June was evaluated on selected trees (6–8 apple trees in 2016 and 5 in 2017) following Amarante et al. (Reference Amarante, Steffens, Mafra and Albuquerque2008, Reference Amarante, Steffens and Argenta2011) and Sheffield (Reference Sheffield2014). Fruit quality tests were performed (September 6, 2016 and September 1, 2017) on approximately 50 marketable fruits from each experimental plot except for the negative control plot, where no fruit was produced due to the absence of pollination. Fruits were randomly selected and were evaluated for any kind of damage. According to commercial standards for fresh market quality, fruits that were either smaller than 70 mm, that presented insect damages, or that had more than 25% scab cover were removed from sampling. The quantity of fruits we were able to evaluate each year was very different given the high pressure of scab in 2017. This condition reduced the number of fruits suitable for evaluation compared to 2016. Fruits were then measured to establish weight, diameter, firmness, sugar level and total number of seeds per fruit (Iglesias and Alegre, Reference Iglesias and Alegre2006; Amarante et al., Reference Amarante, Steffens, Mafra and Albuquerque2008, Reference Amarante, Steffens and Argenta2011; Sheffield, Reference Sheffield2014; Garratt et al., Reference Garratt, Truslove, Coston, Evans, Moss, Dodson, Jenner, Biesmeijer and Potts2014a, Reference Garratt, Breeze, Jenner, Polce, Biesmeijer and Potts2014b). Fresh weight (g) of the fruits was assessed using an electronic scale (Mettler Toledo, 0.1 g). The maximum diameter (mm) of fruits at their equator (widest point) was evaluated using an electronic vernier caliper (Mastercraft, 0.01 mm). The firmness of the fruit flesh (lb) was evaluated on two sides using a penetrometer (Fruit pressure tester FT327, 1 lb). The estimated amount of sugar (°Brix) contained in the fruits was evaluated using a refractometer (Hanna HI 96801, 0.2%). The number of seeds per fruit were counted and their distribution pattern was assigned to one of eight possible categories (A–H) of fertilized carpel according to the chart of Sheffield (Reference Sheffield2014) (Supplementary Fig. 3). Within 3 days of harvest, all quality measurements had been taken to prevent bias due to post-harvest maturation.
(2) Bumble bee hive location. Distance (in m) between commercial bumble bee hives and selected trees was calculated for each plot. In fall, total yield of each of the selected trees was calculated and correlated with their location relative to the hive.
Analysis
R software version 3.4.1 GUI 1.70 El Capitan (Core Team, 2017) was used for all statistical analyses. To asses effects of bumble bee pollination on fruit quality, we analyzed response variables of fruit weight, fruit diameter and number of seeds using contrast analysis for the type of pollinator (i.e., conventional, without nets vs bumble bee hives, with nets) in a linear mixed-effects model (lmer() function) with Satterthwaite correction (Kuznetsova et al., Reference Kuznetsova, Brockhoff and Christensen2016). We combine both bumble bee treatments and we average values of fruit measurements to obtain one number per repetition. The model had an explanatory variable of treatment [1: introduction of a bumble bee hive, under nets; 2: negative control with no pollinators, under nets and 3: agronomic control with nearby bee hives (<50 m), without nets] and had repetition as random effects. To assess effects of bumble bee hives on fruit quality we analyzed response variables of fruit weight, fruit diameter and number of seeds using contrast analysis for the position in the row (i.e., at the end vs in the middle) in a linear mixed-effects model (lmer() function) with Satterthwaite correction (Kuznetsova et al., Reference Kuznetsova, Brockhoff and Christensen2016). We averaged values of fruit measurements to obtain one number per repetition. The model had an explanatory variable of treatment (1: introduction of a bumble bee hive placed at the end of the row and 2: introduction of a bumble bee hive placed in the middle of the row) and had repetition as random effects. We addressed the relationship between fruit weight and the total number of seeds for pollination treatment (i.e., nets vs no net) using a linear model and we compared difference between slope using an analysis of covariance controlling for pollinators. We also analyzed the effect of bumble bee pollination on the distribution of seeds in carpels according to eight categories (A–H) (Supplementary Fig. 3) using an analysis of variance with a post-hoc Tukey's HSD test (glht() function) (Hothorn et al., Reference Hothorn, Bretz and Westfall2008). Finally, we compared total yield per tree in relation to its distance from each bumble bee hive under exclusion nettings system (i.e., for hives located at the end of rows and at mid-row) using a generalized linear mixed-effects model (glmer() function) with a Poisson distribution (Bates et al., Reference Bates, Maechler, Bolke and Walker2017). We decided to perform a separate analysis for each year as the sampling method and the general conditions of the experiment were different. For each analysis, significance level was set at 0.05 and we used standard error of the mean to estimate how far the sample mean is likely to be from the population mean.
Results
Floral visitation rate
For all treatments and years combined, bumble bee workers visited on average 12.03 ± 6 flowers per minute (N = 160 observations). Trees had an average of 299 ± 94 bouquets of five flowers (N = 49 observations). Behavioral observations performed in spring showed that nets do not appear to interfere with bumble bee foraging activity. Upon opening the hives, bumble bees tended to fly upward to probe the nets and find an exit. Approximately 1 h after opening, most bumble bees were observed foraging on apple blossoms. Other field observations by the research team showed that bumble bee workers under nets spend about 15 ± 5 min foraging before returning to their hive (N = 40 observations). Field observations showed that bumble bees experienced no difficulty in flying inside the netted environment or between trees. Bumble bees were often seen flying along the wire placed at the top of the net (Supplementary Fig. 3) and using it as a guideline to circulate from one end of the row to the other instead of flying between tree branches.
Pollination efficacy
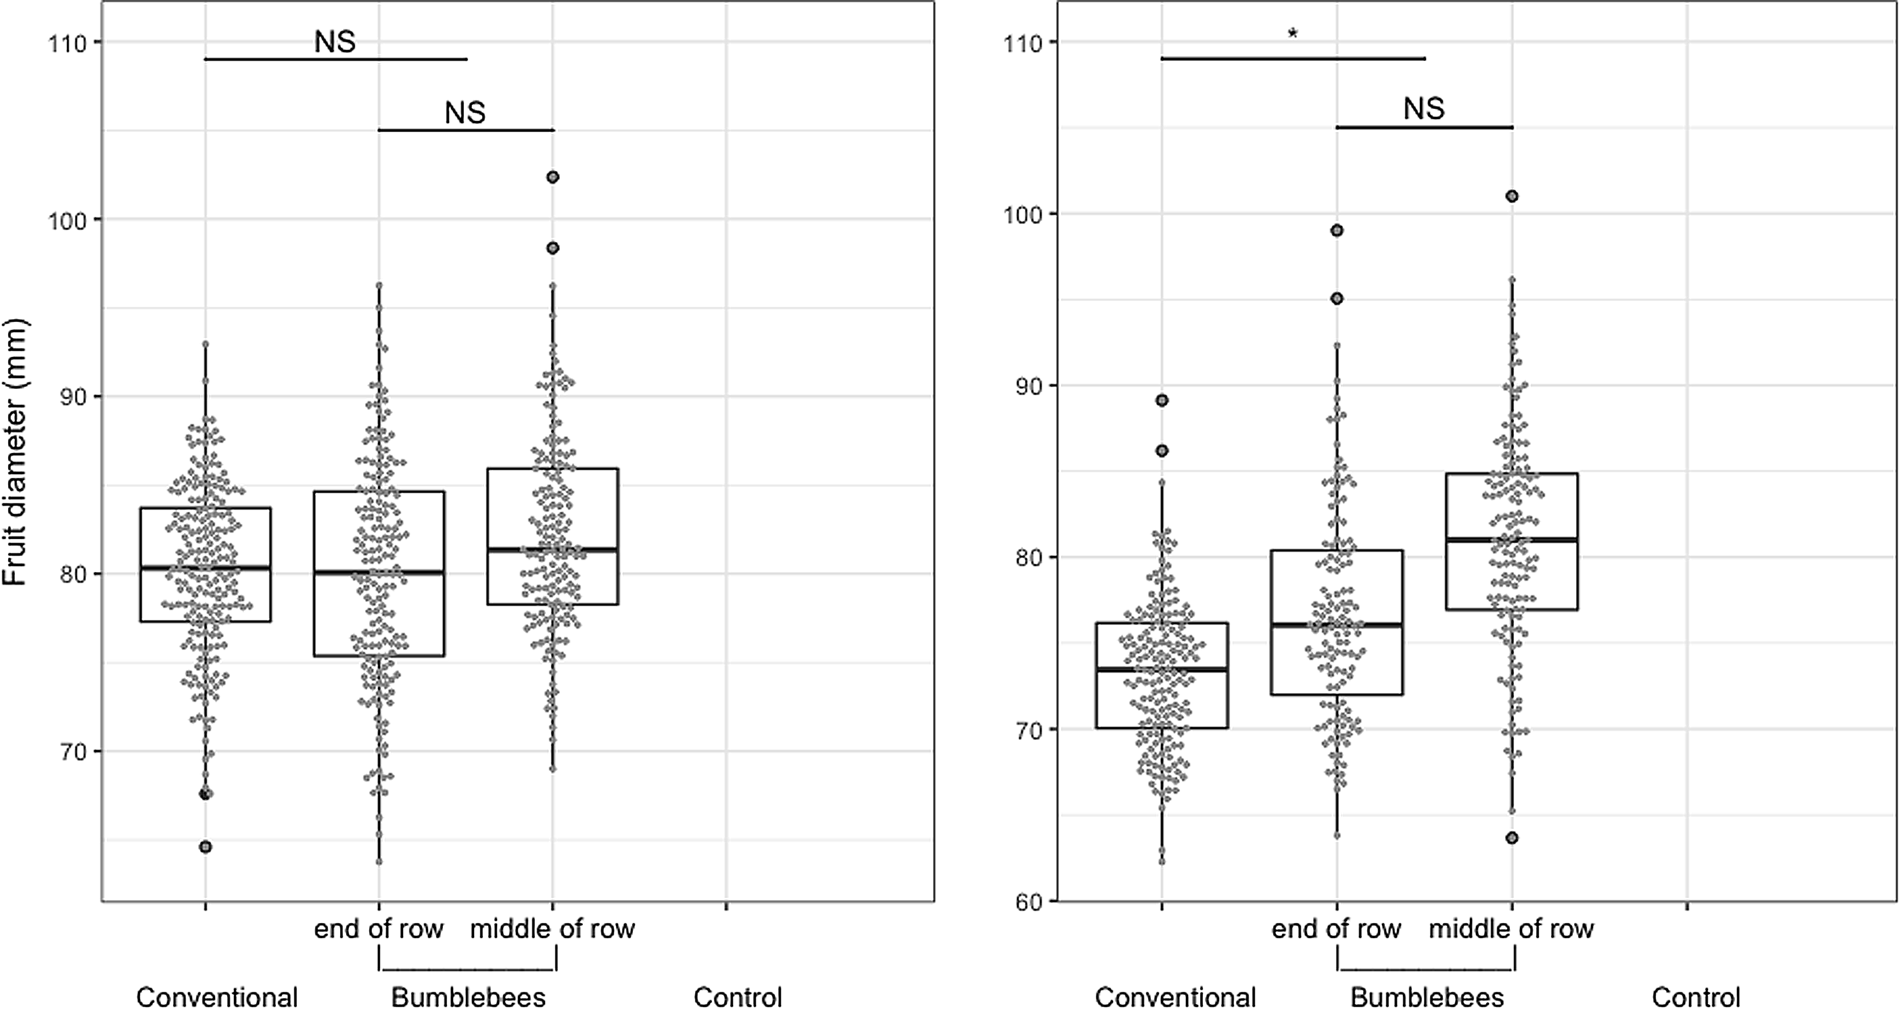
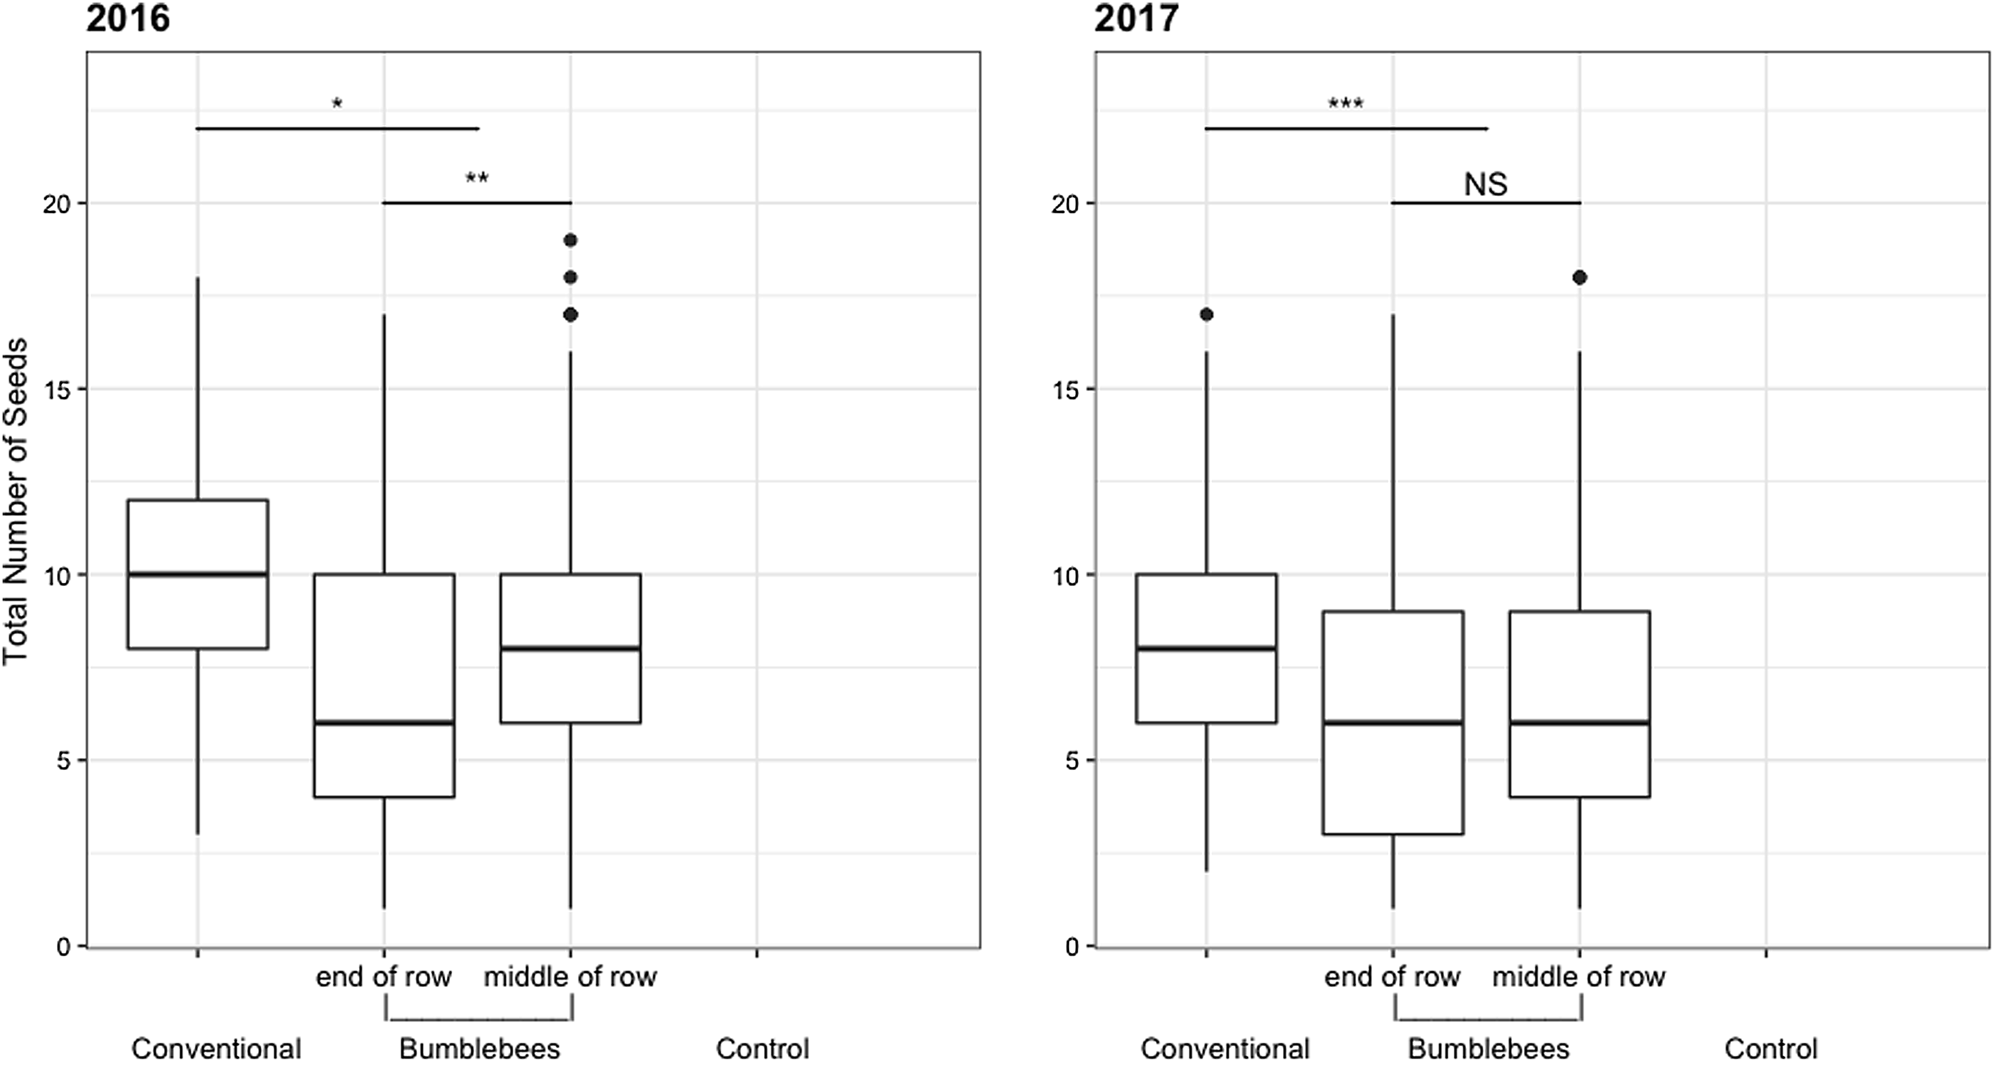
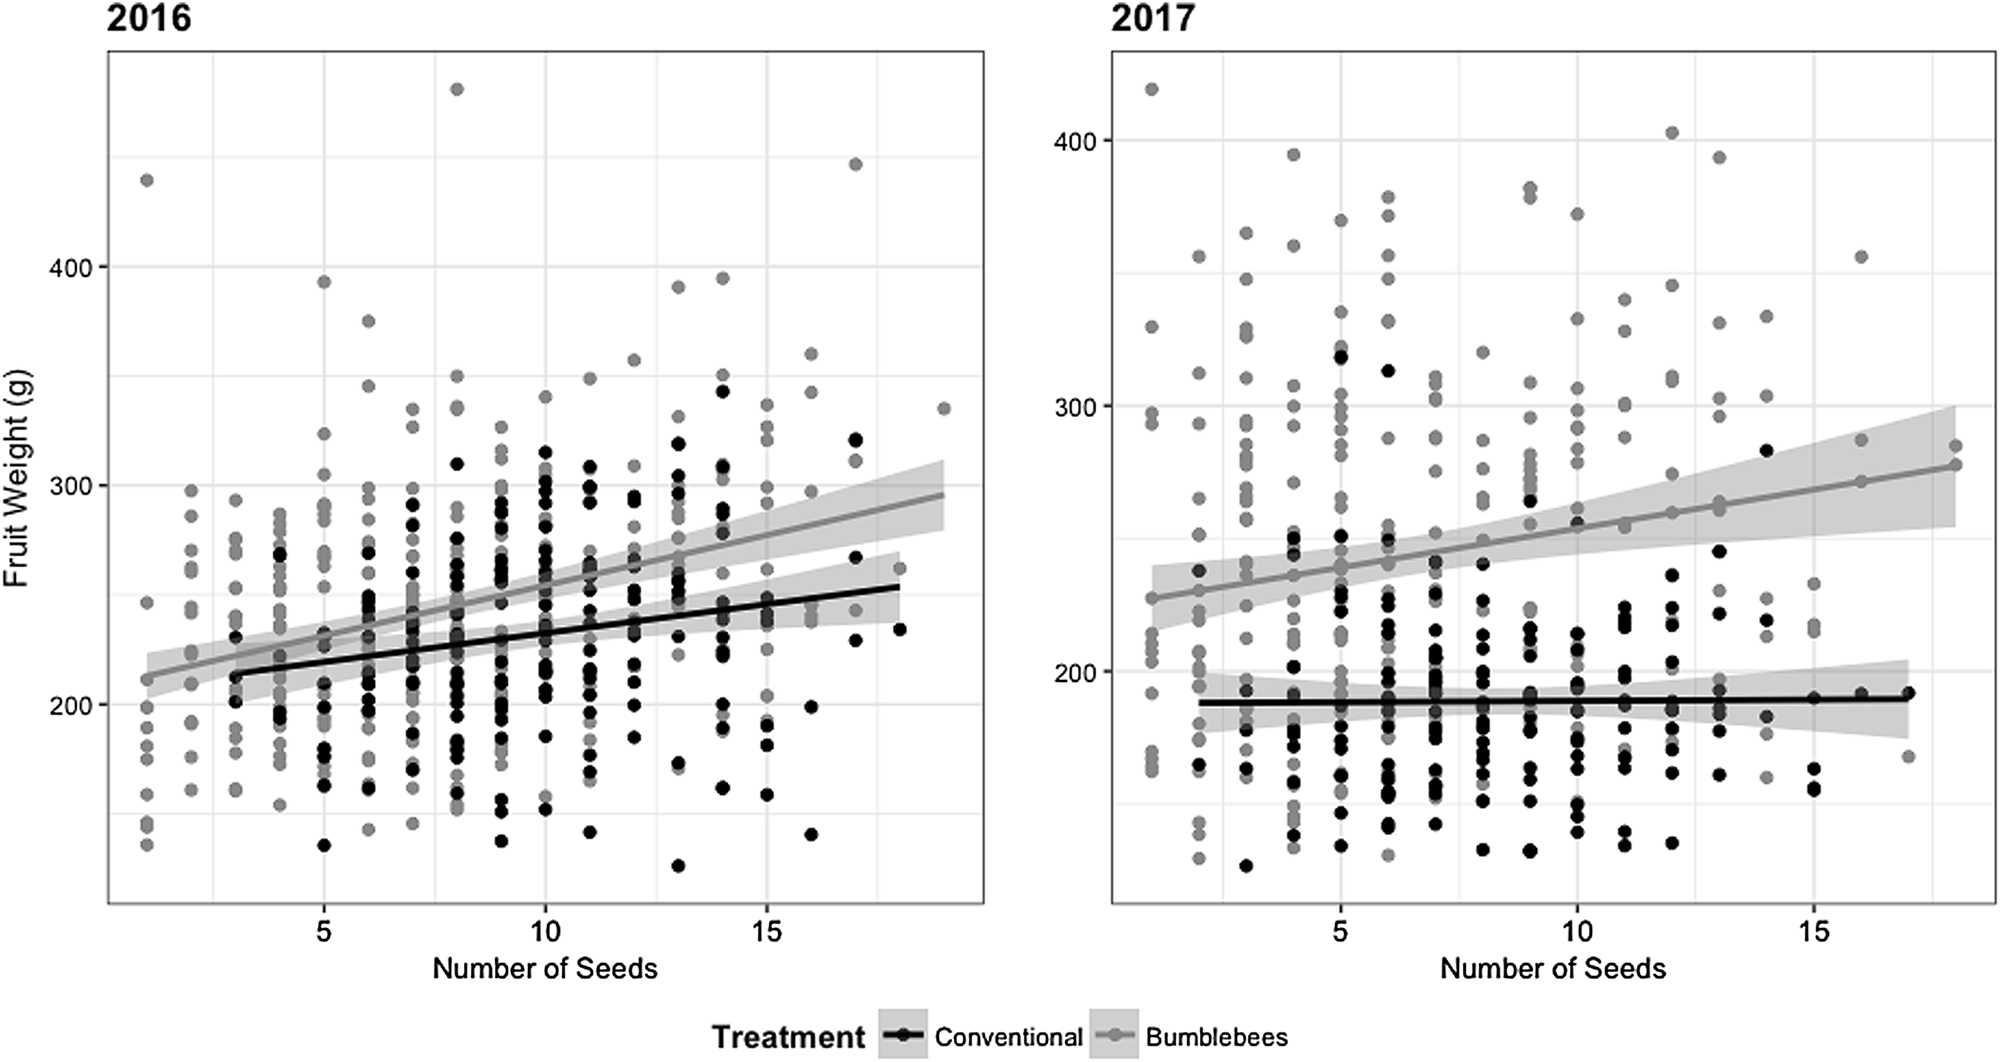
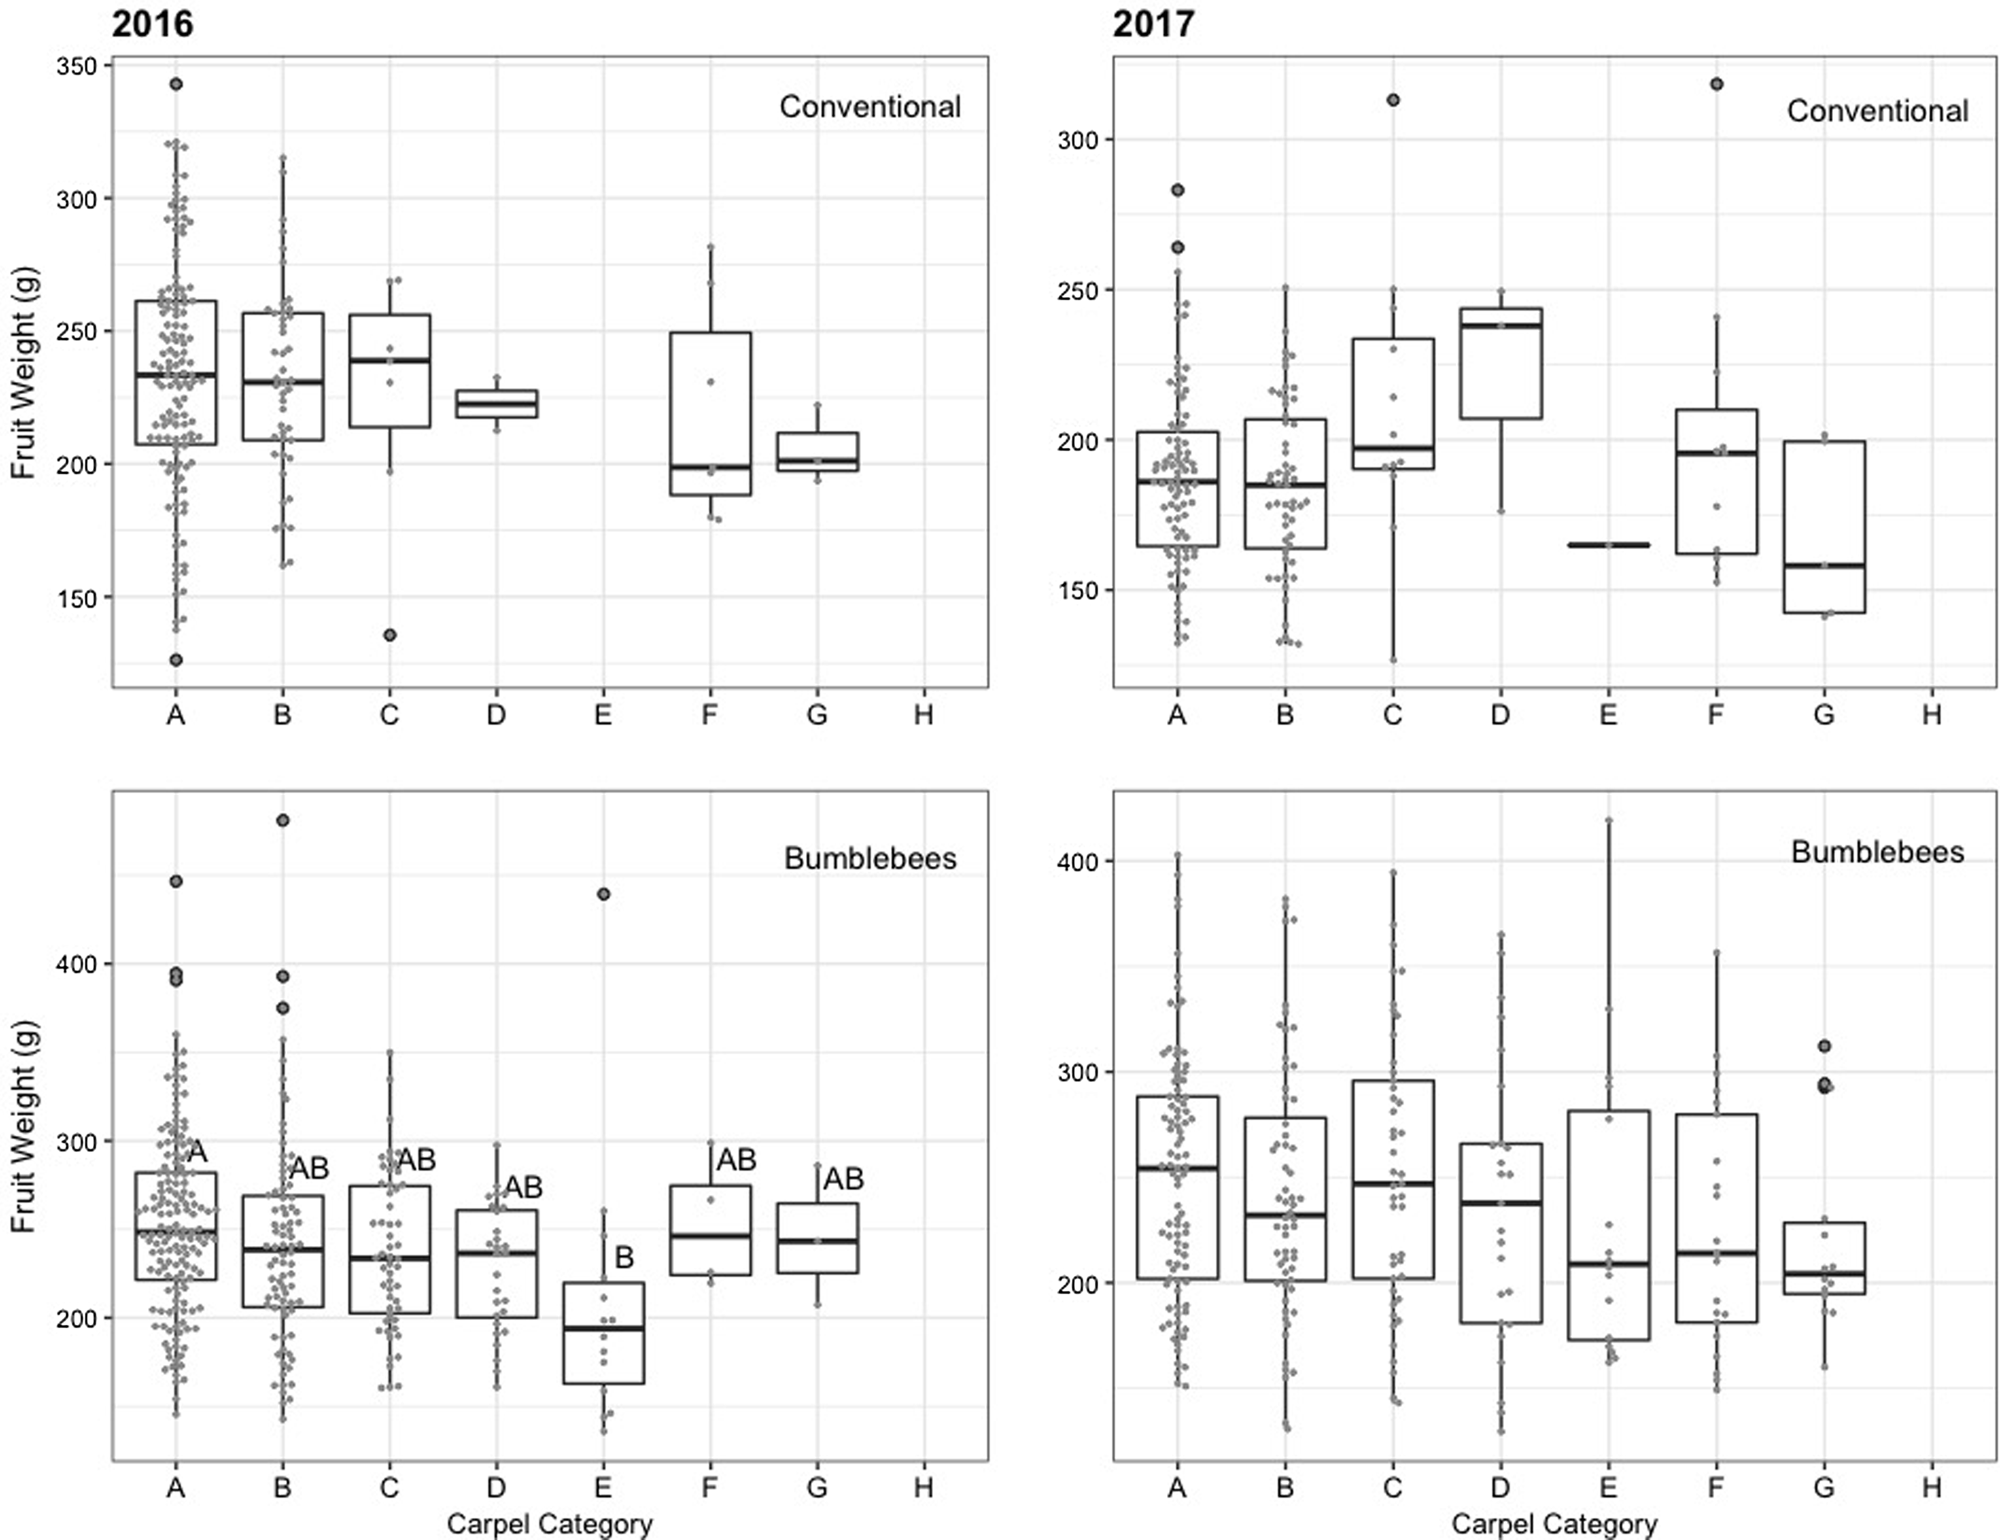
Bumble bees under nets provided equivalent (2016) or greater (2017) fruit quality than bees in the orchard environment (Figs. 1–3). In 2016, sampled fruits weighed 248 ± 11 g and measured 82 ± 1 mm on average when pollinated by bumble bees, compared to 232 ± 12 g and 80 ± 1 mm under conventional pollination. However, fruit weight (t (2.965) = −1.356, P = 0.269) and size (t (2.984) = −1.011, P = 0.387) did not differ statistically in 2016 (Figs. 1 and 2). In 2017, despite the incidence of apple scab, sampled fruits weighed 235 ± 17 g and measured 78 ± 2 mm on average with bumble bee pollination, compared to 188 ± 8 g and 73 ± 1 mm for conventionally pollinated fruit (Figs. 1 and 2). However, fruits produced via conventional pollination were statistically smaller (weight: t (2.971) = −3.879, P = 0.031 and size: t (2.967) = −3.33, P = 0.045). For both years, bumble bee pollination produced a significantly lower number of seeds (t (3.09) = 4.08, P = 0.025, t (30.768) = 5.637, P = 3.55 × 10−06) than experimental plots pollinated by honey bees and wild bees community (bumble bees and other bees) in the orchard environment (Fig. 3). On average, treatment pollinated with bumble bee had 71 ± 6% fruits with more than five seeds compared to 89 ± 7% for treatment pollinated with conventional pollination. For both years, fruit weight increased slightly with the number of seeds per fruit (Fig. 4). In 2016, the correlation between fruit weight and number of seeds was stronger for fruits produced under nets (R 2 = 11.6) than fruits produced following conventional pollination (R 2 = 3.9). A similar pattern was observed in 2017 for fruits produced under nets (R 2 = 3.3) but not for conventional pollination (R 2 = 0.008). However, our results show that there is no significant difference between pollinators, for both years (2016: F (1,5398) = 2.4334, P = 0.1194; 2017: F (1,9125) = 3.3898, P = 0.066269) (Fig. 4). Overall, we did not observe any effect of the seed distribution patterns (Supplementary Fig. 3) on fruit weight in 2016 (F (5,188) = 0.4492, P = 0.8135) and 2017 (F (6,166) = 2.0622, P = 0.06029) for conventional pollination. However, we did observe a difference in fruit weight in 2016 (F (6,329) = 2.5449, P = 0.02013) but not in 2017 (F (6,267) = 1.1129, P = 0.355) for bumble bee pollination (Fig. 5). Categories A and B, which represent well pollinated fruit, were more abundant in all treatments (F (6,970) = 2.1703, P = 0.04365). Also, seeds were more evenly distributed with conventional pollination, while bumble bee pollination resulted in more fruit irregularities (C, D, E and G categories). Overall, there was slightly more asymmetric fruits in treatment pollinated with bumble bee (58 ± 5%) compared to conventional pollination (48 ± 8%).
Apple fruit weight (g) for each treatment for two production years (2016–2017). No data for the control plot as no fruit was produced. NSP > 0.05, *P ≤ 0.05, **P ≤ 0.01, ***P ≤ 0.001. Boxes show interquartile range and the whiskers represent data outside. Gray dots added to show fruit distribution in each treatment.

Apple fruit diameter (mm) for each treatment for two production years (2016–2017). No data for the control plot as no fruit was produced. NSP > 0.05, *P ≤ 0.05, **P ≤ 0.01, ***P ≤ 0.001. Boxes show interquartile range and the whiskers represent data outside. Gray dots added to show fruit distribution in each treatment.
Total number of seeds per fruit for each treatment for two production years (2016–2017). No data for the control plot as no fruit was produced. NSP > 0.05, *P ≤ 0.05, **P ≤ 0.01, ***P ≤ 0.001. Boxes show interquartile range and the whiskers represent data outside.
Apple fruit weight (g) vs the number of seeds per fruit for two production years (2016–2017). Confidence interval (CI) = 95%.
Apple fruit weight (g) vs carpel category (A–H) in each treatment for two production years (2016–2017). Refer to the chart of Sheffield (Reference Sheffield2014) (Supplementary Fig. 3). Boxes sharing the same letters are not significantly different. Boxes show interquartile range and the whiskers represent data outside. Gray dots added to show number of seeds per carpel category.
Bumble bee hive location
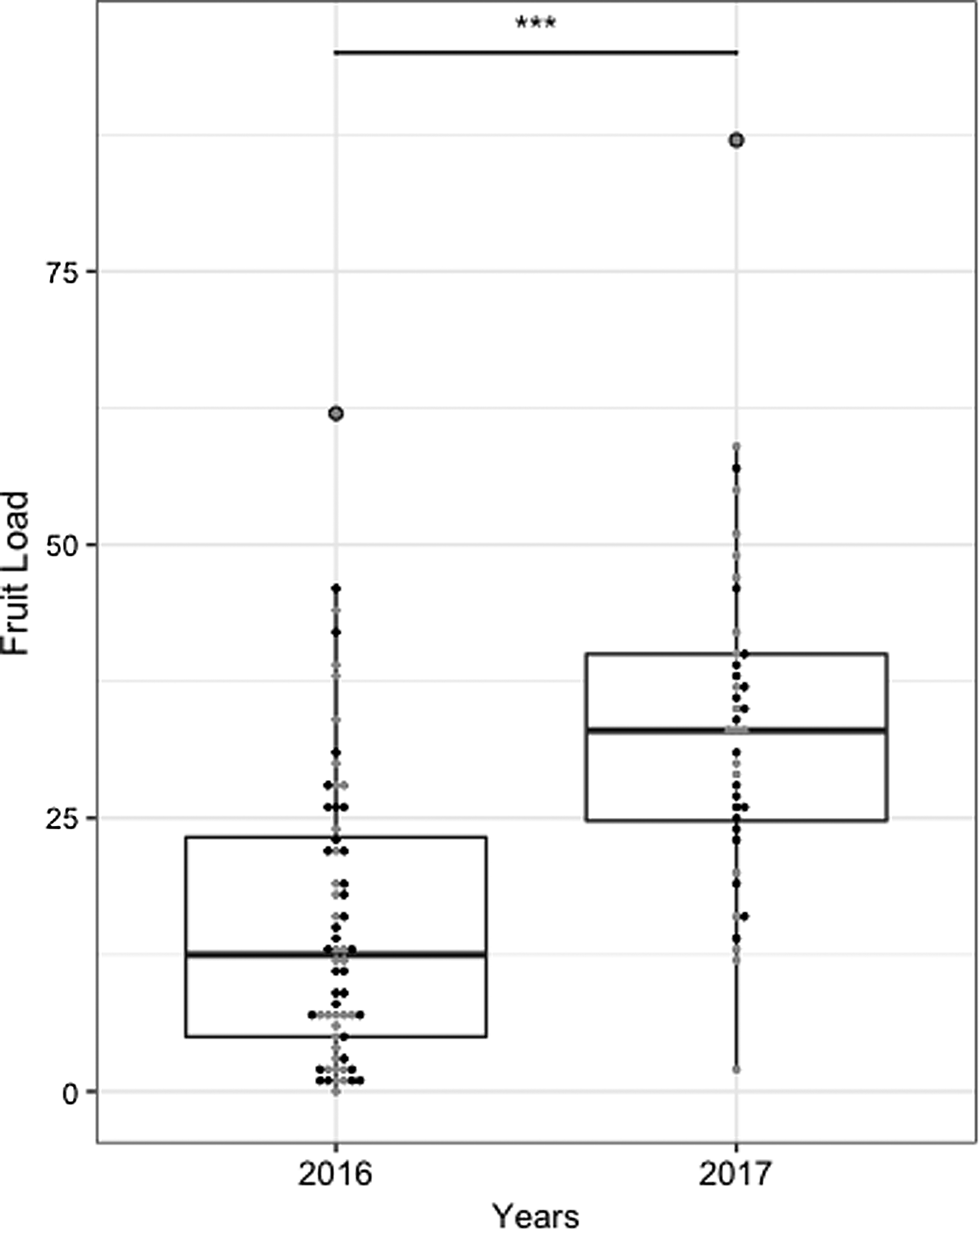
In general, hives placed in the middle of the row resulted in a greater fruit load per tree (Figs. 6 and 7). In 2016, fruit load was more evenly distributed along the row when the hive was placed in the middle (R 2 = 0.2, P = 0.131), while it decreased significantly along the row when the hive was placed at either extremity, as it was higher near the hive and lower at the opposite edge (R 2 = 11.3, P < 0.001). In 2017, fruit load was also slightly more uniform when the hive was in the middle of the row (R 2 = 5.7, P = 0.697) compared to when the hive was at the end (R 2 = 10.7, P = 0.205) (Fig. 6). Overall, fruit load per tree was higher in 2017 (18 ± 3 fruit per tree) than in 2016 (15 ± 1 fruit per tree) (F (1) = 39.482, P = 8.248 × 10−09) (Fig. 7). On average, in 2016, fruits weighed 234.6 ± 9 g and measured 80.1 ± 1 mm when hives were placed at the end of the row, vs 261 ± 13 g and 83.0 ± 2 mm when hives were placed mid-row. In 2017, fruits weighed 220 ± 9 g and measured 77 ± 1 mm, on average, when hives were placed at the end of the row and 251 ± 24 g and 80 ± 2 mm when hives were placed mid-row. For both years, results showed that both within-row hive positions provided equivalent fruit quality (Figs. 1–3). No significant differences were found for either weight (2016: t (2.726) = −1.98, P = 0.151; 2017: t (3.043) = −1.873, P = 0.156) or size (2016: t (2.72) = −1.891, P = 0.164; 2017: t (3.117) = −1.747, P = 0.176) (Figs. 1 and 2). The number of seeds was significantly higher in 2016 (t (14.685) = −3.114, P = 0.00726) when the hives were placed mid-row, but not in 2017 (t (2.852) = −0.261, P = 0.812) (Fig. 3).
Fruit load (i.e., total number of fruits per tree) vs distance (m) for the two locations of commercial bumble bee hives under nets for two production years (2016–2017). CI = 95%.

Fruit load (i.e., number of fruits per tree) for each year. Boxes show interquartile range and the whiskers represent data outside. Black (conventional) and gray (bumble bees) dots added to show number of fruits per tree.
Discussion
The main objective of this study was to test the effectiveness of the bumble bee B. impatiens Cresson (Hymenoptera: Apidae) in commercial hives for pollinating apple blossoms under exclusion netting systems without requiring the nets to be opened. Our results showed that bumble bees were efficient pollinators under these conditions and provided a substantial yield of marketable apples.
Our observations confirmed that bumble bees were attracted to apple blossoms and were not negatively affected by their constrained environment. They demonstrated good mobility throughout the netted space and between apple trees in bloom. Moreover, our observations showed that workers undertook frequent and rapid flights when visiting flowers. Even though time spent on flowers varied among individuals, workers were able to visit an average of 12 flowers per minute under nets, which is similar to the rate found in a natural environment (ten flowers per minute; Jacob-Remacle, Reference Jacob-Remacle1989).
First, our results show that no fruit was produced in the negative control plot. This implies that small insects that might have overwintered on trees or been trapped in the nets at the time of their installation before bloom and even the ants activity, that were observed moving on the apple trees, was not important enough to allow pollination. Many studies assessed that total limitation of insect pollination result in no fruit yield (Finta, Reference Finta2004). Our results showed that the duration of pollination of flowers by insects is important and that it can strongly affect the fruit set of apples.
As hypothesized, we found that bumble bees provided sufficient pollination services which allows adequate yield and fruit quality and that it was equivalent to conventional pollination provided by honey bees and wild bees community. Apple trees pollinated by bumble bees were characterized by fruits of greater weight and size as well as a satisfactory amount of fertilized seed, resulting in a good commercial value. It has been demonstrated that the weight and size of fruit and the number of seeds they contain are directly proportional to pollen load (Mann, Reference Mann1943; Visser and Verhaegh, Reference Visser and Verhaegh1987; Winsor et al., Reference Winsor, Davis and Stephenson1987). This is especially important for cultivated plants, particularly auto-sterile species, for which successful pollination is usually a critical step for ensuring fruit yield. Because bumble bees are larger in size and covered with dense body hair, they can carry heavier pollen loads (Goulson, Reference Goulson2010). It has been shown that bumble bees can deposit more pollen per visit as they make more frequent contact with stigma when visiting flowers than honey bees and are more effective at pollination fruit trees such as apple and pear (Park et al., Reference Park, Raguso, Losey and Danforth2016; Thomson and Goodell, Reference Thomson and Goodell2001; Matins et al., Reference Martins, Gonzalez and Lechowicz2015). Apple flowers need a sufficient amount of pollen to be fertilize but fruit set is usually enhanced if massive quantities of pollen is provided even though only ten pollen grains from another variety is required to set a full complement of seeds (Way, Reference Way1978). According to Dogterom et al. (Reference Dogterom, Winston and Mukai2000) and Javorek et al. (Reference Javorek, Mackenzie and Vander Kloet2002), B. impatiens deposits more pollen grains on average, as a single bumble bee visit is equivalent to three to four visits by A. mellifera. Despite the fact that pollen load was not studied in this research, our results support this, since experimental plots pollinated by bumble bees displayed overall better fruit quality.
Because commercial apple production depends on the success of cross-pollination, it is important to validate the ability of pollinators to cross-pollinate. For pollination success and to prevent early fruit fall and fruit asymmetry (Brault et al., Reference Brault, de Oliveira and Marceau1994; Sheffield, Reference Sheffield2014), six to seven seeds per fruit must be fertilized by a sufficient number of pollen grains (Way, Reference Way1978). Our results suggest that pollination by bumble bee hives under nets is equivalent to conventional pollination, in terms of seed yield. Our results also indicate that fruit pollinated by bumble bees had an adequate number of seeds (71% fruits with more than five seeds). Fruits containing five or more seeds are generally more resistant to bruising, larger, more uniform and display a longer shelf life than those with fewer seeds (Way, Reference Way1978).
Although we did not detect any major problems in flower fertilization, we did observe some limitations inherent in bumble bee pollination under nets. For instance, although our results revealed that fruits produced by bumble bee pollination were overall well-pollinated, they also presented more irregularities in seed distributions (C, D, E and G categories more present) and slightly more asymmetric fruits (58%). Bumble bee workers also tended to forage for more than 15 min per trip within the nets before returning to the hive and stocking up on fresh pollen from the pollinizer that was available only at the entrance of the hive. This illustrates the potential impediment to cross-pollination in plantations where a single cultivar is present under exclusion netting systems, since the chances of ovary fertilization (pollen incompatibility) are greatly reduced when pollen comes from the same cultivar (Janick et al., Reference Janick, Cummins, Brown, Hemmat, Janick and Moore1996). Unfertilized apple flowers almost always dry up and drop off without setting fruit (Way, Reference Way1978), as was observed during both years of the study. To avoid this situation, a sufficiently abundant source of pollen must be available under the net and come into contact with bumble bees for them to cross-pollinate effectively during flower receptivity. The first idea can be to provide pollen directly at the exit of the hive, through hives inserts or pollen dispensers. In this way, workers pass into the receptacle and coat themselves with pollen which can be transferred from one flower to another. Many studies have tested and described these tools in honey bee (A. mellifera) hives but didn't give a consensus on the effectiveness of this method (Legge, Reference Legge1976). However, several studies have demonstrated the effectiveness of bumble bee as a biological control agents that can disseminated fungicides in a culture (Kovach et al., Reference Kovach, Petzoldt and Harman2000; Kevan et al., Reference Kevan, Al-mazra'awi, Sutton, Tam, Boland, Broadbent, Thomson and Brewer2003; Maccagnani et al., Reference Maccagnani, Mocioni, Ladurner, Gullino and Maini2005; Smith et al., Reference Smith, Sampson and Walter2012; Reeh et al., Reference Reeh, Hillier and Cutler2014). Even though we had a pollen dispenser in the hive, the poor seed set and the fruit asymmetry may suggest lots of self-pollen being delivered by bumble bees as they have many flower visits before returning to hive to stock on fresh pollen. More research should be carried out on the development of pollen dispenser for commercial use. The best solution to solve the problem for the time being, is to plant crabapples or different apple cultivars as pollinizers under nets alongside the apple cultivar crop (Williams, Reference Williams1967, Reference Williams, Luckwill and Cutting1970; Way and Paek, Reference Way and Paek1976; Paek, Reference Paek1977; Church et al., Reference Church, Williams and Andrews1983; Williams and Church, Reference Williams and Church1983; Gothard, Reference Gothard1994). Crabapples are suggested as companion species, as they are reported to produce numerous pollen-rich flowers that allow commercial apple cultivars to set fruit (Delaplane et al., Reference Delaplane, Mayer and Mayer2000). This method is very effective, much more convenient and species-specific recommendations are available for ideal pollinizer trees.
In our project, seed set is the only measured outcome that is directly affected by pollination. As mentioned before, full seed set is often correlated with higher yield, symmetry and marketability but is not a direct result of pollination set. To confirm the effects of the bumble bee pollinated treatment, it would have been important to add an open net treatment with conventional pollination. With the current design, we cannot assure that the yield effects are attributed to the pollination, especially since they are decoupled from the seed set. The experiment was conducted using the cultivar GingerGold, which is very productive (40–50 t ha−1) and produces relatively uniform, large fruits (diameter: 70–80 mm). Because this cultivar is relatively new on the market, it is difficult to know if it responded well in the context of our experiment. For example, the high variation observed in fruit size and number of seeds per fruit could be a characteristic of the cultivar itself (some can form up to 18 seeds) (Hancock et al., Reference Hancock, Luby, Brown, Lobos and Hancock2008) or may be evidence of a more serious over-pollination problem (i.e., too many visits). As there is a negative relationship between bee visits and fruit size (higher rates of bee visits produce smaller fruits), over-pollination can have serious consequences for growers as fruit trees produce more, but smaller, fruits with a reduced market value (Proebsting and Mills, Reference Proebsting and Mills1981; Proebsting, Reference Proebsting1990; Schneider et al., Reference Schneider, Stern, Eisikowitch and Goldway2002). Some studies have also mentioned breakage of flowers and fruit abortions and deformations following over-pollination in greenhouse crops such as peppers, tomatoes and strawberries (e.g., Velthuis and Van Doorn, Reference Velthuis and Van Doorn2006). The high rate of visitation of flowers by foragers strongly damage the pollinating parts of flowers or bring a high concentration of pollen which cause pollen tubes to compete for available nutrient between each other to the extent that most pollen tubes fail to reach the ovule. Observing the effect of over-pollination caused by bumble bees under net on a well-known conventional cultivar would be needed to better assess and interpret these tendencies.
As expected, the position of the bumble bee hive along the row did not influence fruit quality (i.e., weight, size or number of seeds) but did affect fruit load. Pollination quality under nets was also influenced by the distance between hives and trees, as the fruit load per tree tended to decrease with distance from the hive. Overall, when placed in the middle of the row, commercial hives allowed a more uniform fruit load per tree across each plot, as it seemed to be easier for bumble bee workers to move from one end of the net to the other as they traveled back and forth to the hive more frequently. Under natural conditions, foragers tend to focus their search on the areas surrounding their nest, within a radius of 1–2 km (Pesson and Louveaux, Reference Pesson and Louveaux1984) but this foraging distance has not yet been calculated for domesticated B. impatiens. As observed in our study, bumble bees were able to fly easily throughout the net and between trees, often using the wire placed at the top of the net as a guideline. Our results suggest that this behavior allowed a better flow inside the net and contributed to a more uniform fruit load across the plot.
Finally, from an economic point of view, it does not cost more to use bumble bee hives rather than honey bee hives during the pollination period. For 3 weeks, per hectare, it will cost roughly $400 CDN for four commercial bee hives with bumble bees containing 800–1000 workers, compared with $450 CDN for three honey bee hives with more than 30,000 workers. However, commercial bumble bee hives have a lifespan of 6–8 weeks and, after the apple bloom, can be install in a floral strip or in a later flowering crop such as raspberries or blueberries while bee hives are only rented for the duration of flowering. Foragers from commercial bumble bee hives will continue to gather crops and flowers over a radius of more than 1 km. In addition, in the fall, the future queens will nest in this same area and increase the populations of wild bumble bees for the following year. This is a significant asset considering the drop in wild bumble bee populations (Colla et al., Reference Colla, Gadallah, Richardson, Wagner and Gall2012).
Conclusion
Overall, our study demonstrated that bumble bees are effective pollinators for apple production under exclusion netting systems. In general, bumble bee workers were very active on apple flowers and did not show signs of net disturbance. The quantity and quality of fruits produced by apple trees pollinated by bumble bees were equivalent to the yield from trees conventionally pollinated by honey bees. Developing pollen dispensers that could be included in commercial hives would allow bumble bee workers easy access to compatible pollen and increase cross-pollination success. We found no difference between the two hive positions in terms of resulting fruit quality, but hives placed in the middle of a net plot offered more homogeneity in fruit load along the row. This position is thus recommended for use with commercial bumble bee hives under exclusion netting systems in commercial orchards. Our results are promising for fruit growers who wish to adopt this strategy. However, more studies are needed to assess efficacy of bumble bee pollination. With growing consumer demand for pesticide-free tree fruit crops, it is expected that exclusion netting systems will increasingly be used on a larger scale in fruit growing regions.
Supplementary material
The supplementary material for this article can be found at https://doi.org/10.1017/S1742170520000095
Acknowledgements
The authors thank the following individuals for their involvement in field and/or lab work during the study: Francine Pelletier, Jonathan Veilleux and Mikael Larose from the Integrated Fruit Production laboratory team of the Research and Development Institute for the Agri-environment (IRDA) and student interns, volunteers and colleagues at Laval University; Frédérique Beaulieu, Catherine Bolduc, Phanie Bonneau, Sandrine Corriveau, Charlotte Farley-Legault, Mathieu Gauvin, Sara Gervais, Marianne Lamontagne-Drolet, Romain LeGléau, Frédéric McCune, Élizabeth Ménard, Stéphanie Patenaude, Olivier Samson-Robert and Charles Sasseville. The authors are also grateful to their suppliers: Thierry Chouffot from Koppert Canada Limited, Brad Moore and Ryan Reisbick from Firman Pollen Inc. as well as Dubois Agrinovation. Finally, the authors thank Madeleine Chagnon and Ève-Catherine Desjardins for their constructive comments on an earlier version of this manuscript.
Author contributions
Research was designed by M. Normandeau-Bonneau and G. Chouinard. Sampling and data analyses were conducted by M. Normandeau-Bonneau. M. N. Bonneau, O. Samson-Robert, G. Chouinard and V. Fournier wrote and edited the manuscript.
Financial support
This research was funded by grants from the Agri-innovation (AAC) (#AIP-CL02-12-B.11.40) and Innov'Action (MAPAQ) (#IA113067) programs to G. Chouinard.


 Open access