Between 1850 and 1920, during the Age of Mass Migration, more than 30 million European immigrants moved to the United States. A large literature has examined the short- and long-run effects of this migration episode on the U.S. economic and political landscape (Abramitzky and Boustan Reference Abramitzky and Boustan2017, Reference Abramitzky and Boustan2022; Sequeira, Nunn, and Qian Reference Sequeira, Nunn and Qian2020; Tabellini Reference Tabellini2020). However, European immigrants likely had other social and demographic consequences for the U.S.-born population. In this paper, we ask how European immigration influenced marriage patterns, fertility, and family formation of U.S.-born men and women between 1910 and 1930.
This period, which coincided with the end of the Age of Mass Migration, was characterized by nation-wide exogenous shocks—World War I (WWI) and the Immigration Acts of the 1920s—that had large and heterogeneous effects on migration patterns of different ethnic groups. Given immigrants’ propensity to cluster geographically in receiving countries (Altonji and Card Reference Altonji, Card, John and Richard1991; Card Reference Card2001), these country of origin specific shocks generate variation in the number and in the composition of immigrants that U.S. cities received during the first three decades of the twentieth century. As in Tabellini (Reference Tabellini2020), we leverage such variation to construct a “leave-out” version of the shift-share instrument (Card Reference Card2001) for immigration at the city-decade level. The instrument combines the geographic distribution of historical settlements of different immigrant groups with time-series variation in national flows from each sending country, net of immigrants who eventually settled in the city’s metropolitan statistical area (MSA). Using this instrument, we estimate stacked panel regressions that account for city invariant and state time-varying unobservable characteristics.
We find that immigration increased both marriage rates and the probability of having children for native men and women.Footnote 1 Our estimates are quantitatively large and imply that a 5 percentage point increase in immigration raised natives’ marriage rates and the children-to-women ratio by 2 and 3 percent, respectively. These results are not driven by native women simply marrying immigrant men. We find similar effects on marriage rates of both native women and native men. Furthermore, at the time, more than 95 percent of U.S.-born women married U.S.-born men. The ethnic segmentation of marriage markets was further reinforced by the 1907 Expatriation Act, which mandated that native women marrying foreign-born individuals would lose their U.S. citizenship and could get it back only when their husband was naturalized. Therefore, native women were also de jure strongly disincentivized to marry an immigrant.
Decomposing the increase in fertility between the intensive (i.e., more children per woman) and the extensive (i.e., more women having at least one child) margin, we document that the latter is quantitatively more important than the former. We also show that the increase in both fertility and marriage was entirely driven by young couples—namely, women (men) aged 18–25 (20–27). Consistent with these findings, immigration induced young natives to leave their parental house and set up an independent family unit earlier.
The key identifying assumption behind our analysis is that, conditional on city fixed and state time-varying characteristics, the factors that attracted immigrants from different countries prior to 1900 were uncorrelated both with post-1900 migration across European countries and with changes in economic and social conditions in U.S. cities. As documented in previous work (Tabellini Reference Tabellini2020; Abramitzky et al. Reference Abramitzky, Ager, Boustan, Cohen and Hansen2023), the nationwide shocks that occurred during this period create a “trend-break” in migration flows that assuages many of the concerns about the validity of shift-share designs recently discussed in the literature (Jaeger, Ruist, and Stuhler Reference Jaeger, Ruist and Stuhler2018; Adao, Kolesàr, and Morales Reference Adao, Kolesàr and Morales2019; Goldsmith-Pinkham, Sorkin, and Swift Reference Goldsmith-Pinkham, Sorkin and Swift2020; Borusyak, Hull, and Jaravel Reference Borusyak, Hull and Jaravel2022). Later, we perform a number of exercises—including testing for pre-trends and allowing cities to have differential trends along many baseline variables—to assess the robustness of our findings.
In the second part of the paper, we explore the mechanisms. We begin by showing that, in line with previous findings in Ager and Hansen (Reference Ager and Hansen2017) and Tabellini (Reference Tabellini2020), immigration increased both the employment and the occupational standing of native men.Footnote 2 In turn, this raised the supply of native “marriageable men” (Wilson Reference Wilson1987; Autor, Dorn, and Hanson Reference Autor, Dorn and Hanson2019), and made it easier for native men and women to marry, set up an independent household, and have children at an earlier stage in their lives. In line with this interpretation, we also document that immigration lowered the share of children from native parents living in a household where the father was unskilled, and increased the share of sons (but not daughters) of native parentage aged 6–14 who were enrolled in school.
Next, we examine additional channels. First, we ask whether our findings are driven by selected in- or out-migration of native-born men and women, induced by the influx of European immigrants. We verify that results are unchanged when focusing attention on men and women born in the same state and when using a linked sample of native-born men who lived in the same city in the previous decade.
Second, we examine the possibility that our results may be explained by changes in sex ratios, which are the relative numbers of men and women. Ex-ante, this is a plausible mechanism, since more than 60 percent of immigrants entering the United States at the time were young men (Angrist Reference Angrist2002). However, as also noted previously, marriage markets were highly segmented along ethnic lines, suggesting that changes in the relative number of foreign-born men and women should have little direct impact on marriage patterns of native-born individuals. Perhaps more importantly, the fact that immigration induced not only native women but also native men to marry more and to have more children suggests that changes in sex ratios alone cannot be driving our main results.
Third, we replicate the analysis, controlling for a measure of linguistic distance, which we take as a proxy for cultural distance brought about by immigration. The effects of immigration on natives’ marriage and fertility remain positive and precisely estimated; instead, we do not detect any relationship between the index of linguistic distance and natives’ outcomes. While only suggestive, this evidence is not consistent with a cultural reaction, which induced natives to marry more often in order to preserve their own race (Bisin and Verdier Reference Bisin and Verdier2000; Bisin and Tura Reference Bisin and Tura2019; Spolaore and Wacziarg Reference Spolaore and Wacziarg2022). We also note that, while cultural incentives may increase endogamous marriage, they can hardly explain the better circumstances of children of native parentage, unless immigration also increased their fathers’ occupational standing.
Finally, we document that direct (negative) effects of immigration on female labor force participation, which might have induced women to first leave the labor force and then get married and have children, are unlikely to explain our findings. Exploiting variation across age groups, we show that the decline in female labor force participation was limited to women whose marriage rates increased in response to immigration. Given the stigma attached to the work of wives outside the home at the beginning of the twentieth century, women were likely to quit their jobs as a consequence of marriage (Goldin Reference Goldin2006).
Our paper is related to the growing literature on the Age of Mass Migration (Lafortune, Lewis, and Tessada Reference Lafortune, Lewis and Tessada2019; Perez Reference Perez2019; Eriksson Reference Eriksson2020; Abramitzky and Boustan Reference Abramitzky and Boustan2022; Collins and Zimran Reference Collins and Zimran2023; Ager et al. Reference Ager, Feigenbaum, Hansen and Tan2024), and to two works in particular. First, Ager and Hansen (Reference Ager and Hansen2017) study the impact of the quotas that were introduced with the Immigration Acts of the 1920s. They find that the quota-induced drop in European immigration slowed down population growth, reduced productivity in manufacturing, and had negative labor market effects for native-born white men. Ager and Hansen (Reference Ager and Hansen2017) also document that the Immigration Acts reduced fertility and marriage rates of first- and second-generation immigrants. Our paper complements this important work by focusing on fertility and marriage patterns of the native-born population, by examining a large set of demographic and social outcomes (such as natives’ residential choices and homeownership), and by exploring the channels driving the effects of immigration on marriage, fertility, and family formation of native-born individuals.Footnote 3 Second, Tabellini (Reference Tabellini2020) finds that, despite its positive economic impact, immigration triggered political backlash within the same set of cities considered in our paper. We expand on Tabellini (Reference Tabellini2020) by shedding light on the consequences that the employment growth generated by immigration had on key social outcomes, such as marriage, fertility, and family formation.
Our analysis is also related to the literature on the effects of sex ratios on the marriage market. Focusing on the same historical context, Angrist (Reference Angrist2002) exploits variation in sex ratios for second-generation immigrants induced by the arrival of individuals from different countries. We complement this paper by showing that immigration can impact marriage rates and fertility in receiving countries not only by altering sex ratios for second-generation immigrants, but also by affecting natives’ employment. The differential effect of immigration on marriage rates of native men—positive for natives with native parents, but close to zero for second-generation immigrants—is also consistent with findings in Abramitzky, Delavande, and Vasconcelos (Reference Abramitzky, Delavande and Vasconcelos2011), who show that in French regions where more men died during WWI, men (women) were better (worse) off in the marriage market.Footnote 4
In addition, our paper speaks to findings in Autor, Dorn, and Hanson (Reference Autor, Dorn and Hanson2019), who study the effects of Chinese import competition on marriage and fertility patterns in the United States today. We complement this paper by showing that a positive (rather than a negative) shock to employment opportunities for men increases (instead of reducing) marriage, fertility, and financial independence for young couples. Despite the difference in the historical context—early twentieth century vs. contemporaneous period—and in the source of the income shock—immigration vs. trade—comparing results in this paper with those in Autor, Dorn, and Hanson (Reference Autor, Dorn and Hanson2019) suggests that some key policy-relevant parameters, such as the elasticity of marriage and fertility to income, can be stable over time. At the same time, while our estimates on fertility are in line with those associated with “fracking booms” in Kearney and Wilson (Reference Kearney and Wilson2018), their paper does not find a positive effect of an employment boom on marriage rates. One possible interpretation for this difference is that the cultural environment might mediate the transmission of income shocks to social outcomes.
Finally, we contribute to the literature on the effects of immigration on female labor force participation, marriage, and fertility. Adda, Pinotti, and Tura (Reference Adda, Pinotti and Tura2025) show that the documented status of immigrants reduces intermarriage and increases separations. Our paper complements their results by focusing on natives’ marriage and fertility. Furtado and Hock (Reference Furtado and Hock2010) and Furtado (Reference Furtado2016) find that the availability of cheaper childcare offered by the inflow of immigrants in recent decades allowed college-educated women to have more children and work longer hours, attenuating the negative correlation between childbearing and labor force participation (Doepke et al. Reference Doepke, Hannusch, Kindermann, Tertilt, Lundberg and Voena2023). In our historical context, the negative effect of immigration on female labor force participation was concentrated among women in the age group that experienced an increase in fertility and marriage. In this respect, our findings are in line with the evidence provided by Goldin (Reference Goldin1990, Reference Goldin2006): at the beginning of the twentieth century, upon getting married, native women quit their jobs or were fired by firms in compliance with marriage bars. Also, most women took care of their own children, and additional childbearing was rarely assigned to immigrant women.
HISTORICAL BACKGROUND
Between 1850 and 1920, during the Age of Mass Migration, more than 30 million Europeans migrated to the United States. In the first wave, from 1850 to 1890, most immigrants came from the British Isles, Germany, and Scandinavia. The second wave, from 1890 to 1920, was characterized by a steady increase in immigration from Southern and Eastern Europe, and was largely due to the decrease in migration costs caused by the introduction of steam technology (Keeling Reference Keeling1999).Footnote 5 Immigrants from new regions were culturally farther from natives and significantly less skilled than those from old sending regions (Hatton and Williamson Reference Hatton and Williamson1998, Reference Hatton, Williamson, Foders and Rolf2006).
Changes in the composition of immigrants and concerns over their assimilation fueled a heated debate on the economic and social consequences of immigration. In response to these concerns, U.S. Congress established a commission that recommended, in 1911, the introduction of immigration restrictions. After several attempts, in 1917, Congress also introduced a literacy test requiring that all immigrants entering the United States be able to read and write (Goldin Reference Goldin, Goldin and Gary1994). Finally, in 1921 and 1924, Congress passed the Immigration Acts to limit the number of immigrants that could enter the United States in a given year by introducing country-specific quotas based on the 1890 immigrant population.Footnote 6 On top of that, European immigration was drastically reduced by the onset of WWI—especially for countries more directly involved in the conflict that did not belong to the Allies, like Germany (Greenwood and Ward Reference Greenwood and Ward2015). As a consequence of these events, immigration from new sending regions was drastically reduced, and the Age of Mass Migration came to an abrupt end in the 1920s.
During this historical period, many prominent scholars expressed concerns not only over the impact of immigration on natives’ employment, but also on their fertility and marriage. The economist Edward Ross was among the first to propose the theory of “race suicide.” According to this theory, not all immigrants were the same, and members of new, inferior races (namely immigrants from new sending regions) would eventually outbreed the “superior national stock” (natives and immigrants from old source countries) because industrial capitalism was conducive to the survival of the unfit (Leonard Reference Leonard2005). Similarly, Francis A. Walker, the first president of the American Economic Association, argued that “the native element failed to maintain its previous rate of increase because the foreigners came in such swarms,” and natives were unwilling not only to engage in competition with “these new elements of the population,” but also, they did not want “to bring sons and daughters into the world to enter that competition” (Walker Reference Walker1899, p. 424).
In contrast to these predictions, the inflow of immigrants might have increased marriage rates and fertility of native women by altering sex ratios (the relative number of men and women). At the time, more than 60 percent of immigrants entering the United States were young men between 20 and 35. Since in the early twentieth century the median age at first marriage was around 21 for women and 25 for men (Online Appendix Figure A.1), even though marriage markets were highly segmented along ethnic lines and native women lost their U.S. citizenship if they were to marry an immigrant, immigration might have made it easier for native women to find a mate and to have children (Angrist Reference Angrist2002).Footnote 7

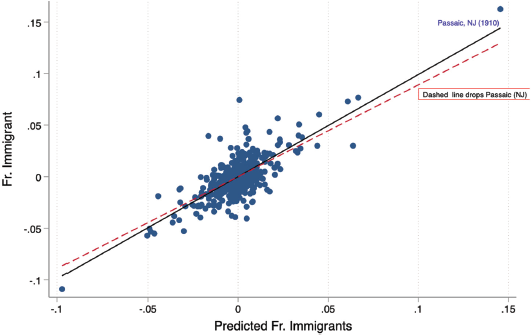
Figure 1 FIRST STAGE
Notes: This graph represents the residual change in a city’s actual and predicted fraction of immigrants after partialling out city and year by state fixed effects. The y-axis (resp. x-axis) reports the actual (resp. predicted) number of immigrants over predicted city population in each of the three Census years: 1910, 1920, and 1930. The predicted number of immigrants is constructed as discussed in Estimating Equation Section of the text. Predicted city population is obtained by multiplying 1900 city population by the average urban growth, excluding that of the Census division where a city is located. The solid line shows the regression coefficient for the full sample (coefficient=0.990, standard error=0.063). The dashed line shows the regression coefficient obtained when dropping the city of Passaic, NJ (coefficient=0.940, standard error=0.068).
Source: Authors’ calculations using IPUMS data.
Yet another possibility is that immigration affected natives’ marriage, fertility, and trends in family formation by altering employment and occupational standing of native men. Historical accounts tend to view immigrants as one of the key determinants of American industrialization and economic development during the Age of Mass Migration. When describing the economic impact of European immigrants, historian Maldwyn Jones wrote that “The realization of America’s vast economic potential has […] been due in significant measure to the efforts of immigrants. They supplied much of the labor and technical skill needed to tap the underdeveloped resources of a virgin continent” (Jones, Reference Jones1992, pp. 309–10). Similarly, John F. Kennedy argued that “every aspect of the American economy has profited from the contribution of immigrants” (Kennedy Reference Kennedy1958, p. 88)
During the Age of Mass Migration, the U.S. economy had large potential for growth. In this context, immigrants provided a cheap and unskilled supply of labor, which could not only be absorbed, but that may have even allowed industries to expand (Foerster Reference Foerster1924), in turn creating new job opportunities for native workers.Footnote 8 It is thus possible that, by increasing the supply of “marriageable men,” immigration raised fertility and marriage rates not only of native women, but also of native men. Moreover, if native men could find a stable job earlier in their working life, they might have been able to leave their parental house and set up their own household earlier. Somewhat ironically, then, immigration might have had exactly the opposite effect relative to what was argued by advocates of the theory of “race suicide.”
DATA
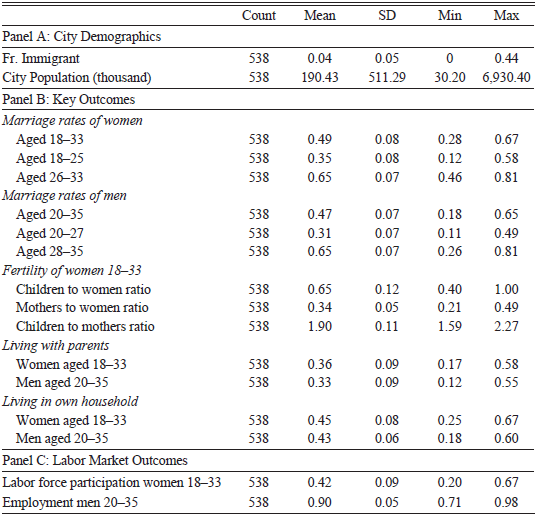
The dataset used in this paper was assembled using the decennial full count U.S. Census of Population, made available by Ruggles et al. (Reference Ruggles, Genadek, Goeken, Grover and Sobek2015). Our analysis is based on a balanced panel of the 180 U.S. cities with at least 30,000 residents in each of the three census years from 1910 to 1930, and where at least some Europeans were living in 1900 (see Online Appendix Table A.1 for the complete list of cities). These places attracted more than 75 percent of the immigrants entering the United States after 1900. From the decennial full count U.S. Census of Population, we collected data on city population, on the number of immigrants by country of origin at the city and at the national level, and on most of the outcomes considered in our analysis, including marital status, relationship to the household head, and the number of children.Footnote 9 To investigate the mechanisms, we also collected data on employment, labor force participation, and occupation of native men and women from the U.S. Census.
Table 1 reports the summary statistics for the main variables used in our analysis. There is wide variation in city size, from almost seven million (New York City in 1930) to around 30,000 (Pasadena in 1910). Also, and importantly, the fraction of immigrants varies substantially both across cities and over time: it was higher in the northeastern states of Connecticut, Massachusetts, New Jersey, and New York, and lower in the U.S. South. As already discussed, WWI and the Immigration Acts drastically reduced immigration: in 1910, the fraction of immigrants over city population was, on average, 0.18, but this number fell to 0.12 in 1930. The decline in the fraction of foreign-born that entered the United States in the previous decade was even starker: for the average city, this number was 0.08 in 1910, but fell to 0.02 in 1930.
Table 1 SUMMARY STATISTICS

Notes: This table shows the summary statistics of the main variables used in this paper for the 180 U.S. cities with at least 30,000 residents in each Census year report. For 1920, Sacramento (CA) and New Bedford (MA) had unreasonably low values for marriage, fertility, and the other demographic outcomes so we excluded them from the main analysis.
Source: Authors’ calculations using IPUMS data.
In Panel B of Table 1, we report the summary statistics of the main outcomes of this paper, namely marriage rates, fertility, and the propensity to leave the parental house for young native men and women. By the age of 33 for women and 35 for men, 65 percent of the native population was married. As shown in Online Appendix Table A.3 for 1910, among native women of native parentage, 73 percent were married to a native husband with both native parents, 20 percent to a husband with one or both foreign-born parents, and only 8 percent to a foreign-born husband. Interestingly, most of the foreign-born husbands arrived in the United States more than ten years earlier. Instead, the probability of being married to a foreign-born husband was as high as 24 percent for second-generation women.Footnote 10
Between 1910 and 1930, among women aged 18–33, the average children to women ratio was 0.65: 34 percent of native women had at least one child, while those who were mothers had, on average, almost 2 children each.Footnote 11 Table 1 also suggests that the decision to leave the parents’ home was strongly correlated with financial independence and with the choice of getting married: the proportion of men and women who were household heads or spouses was close to marriage rates (45 percent and 43 percent for women and men, respectively).
Finally, Panel C presents the summary statistics for the key labor market outcomes considered. In 1910, the average employment to population ratio for native men aged 20–35 in our sample was 91 percent, and it fell to 84 percent in 1930 with the onset of the Great Depression. Average labor force participation for native women was 42 percent, with an increasing trend over time, which was slowed down by the economic downturn in 1930.Footnote 12
Immigration data are available for all 540 city-year observations in our sample. However, for 1920, Sacramento (CA) and New Bedford (MA) had unreasonably low values for marriage, fertility, and the other demographic outcomes considered in our work, probably reflecting misreporting in the original documents. For this reason, in our baseline specification, we drop the 1920 data for these two cities, but our results remain unchanged when all 540 city-year observations are included.
EMPIRICAL STRATEGY
Estimating Equation and Instrumental Variable
To investigate the effects of immigration on natives’ marriage, probability of having children, and family structure across U.S. cities, we stack the data for the three Census years between 1910 and 1930, and estimate
 $${y_{cst}} = {\gamma _c} + {\delta _{st}} + \beta Im{m_{cst}} + {u_{cst}}$$
where y cst is the outcome for city c in state s in Census year t, and Imm cst is the fraction of immigrants over the predicted city population.Footnote 13 In our baseline specification, we consider the stock of European immigrants who arrived in the United States in the previous decade, but results are robust to extending this definition to all immigrants, irrespective of their country of origin or their year of arrival. Since we always control for city and state by year fixed effects (γ c and δ st), β is estimated from changes in the fraction of immigrants within the same city over time, compared to other cities in the same state in a given year. Standard errors are clustered at the MSA level, and MSA boundaries are fixed to 1940 in order to keep geography constant.
When estimating the effects of immigration on natives’ fertility and marriage, we face a key empirical challenge: the location decision of immigrants might be endogenous to local, time-varying conditions. For instance, immigrants might be attracted to cities with stronger labor markets, where marriage prospects for natives are better. This would introduce a positive bias to OLS estimates of Equation (1). Alternatively, because of congestion costs, immigrants might be more likely to settle in otherwise declining cities, where marriage markets for natives are weaker. In this case, OLS estimates would be downward biased.
To deal with these and similar concerns, we closely follow Tabellini (Reference Tabellini2020) and construct a “leave-out” version of the shift-share instrument commonly adopted in the immigration literature (Altonji and Card Reference Altonji, Card, John and Richard1991; Card Reference Card2001). The instrument predicts the number of immigrants received by U.S. cities over time by interacting 1900 settlements of different ethnic groups with subsequent national migration flows from each sending region, excluding individuals that eventually settled in a given city’s MSA. Formally, Imm cst in Equation (1) is instrumented with
 $${Z_{cst}} = {1 \over {\hat P}_{cst}}{{\sum}_j}{\alpha _{jc}}O_{jt}^{ - M}$$
where
 ${{\hat P}_{cst}}$
is predicted city population; α jc is the share of individuals of ethnic group j living in city c in 1900 (relative to all immigrants from group j living in the United States in that year); and
${{\hat P}_{cst}}$
is predicted city population; α jc is the share of individuals of ethnic group j living in city c in 1900 (relative to all immigrants from group j living in the United States in that year); and
 $O_{jt}^{ - M}$
is the number of immigrants from country j that migrated to the United States between t and t −1, net of those that eventually settled in city c’s MSA.Footnote 14
$O_{jt}^{ - M}$
is the number of immigrants from country j that migrated to the United States between t and t −1, net of those that eventually settled in city c’s MSA.Footnote 14
The instrument combines two sources of variation. The first one is the change in the total number of immigrants from any sending country migrating to the United States in a given decade (
 $O_{jt}^{ - M}$
). Two historical episodes contributed to the high variation in the share of immigrants from various European countries over this time period. First, WWI drastically decreased immigration from Europe, especially for countries more directly involved in the war and which did not belong to the Allies. Second, the Immigration Acts of 1921 and 1924 introduced country-specific quotas based on the 1890 immigrant population. The quotas were set to restrict immigration from Southern and Eastern Europe, while favoring that from older sending regions such as the United Kingdom, Germany, and Scandinavia.
$O_{jt}^{ - M}$
). Two historical episodes contributed to the high variation in the share of immigrants from various European countries over this time period. First, WWI drastically decreased immigration from Europe, especially for countries more directly involved in the war and which did not belong to the Allies. Second, the Immigration Acts of 1921 and 1924 introduced country-specific quotas based on the 1890 immigrant population. The quotas were set to restrict immigration from Southern and Eastern Europe, while favoring that from older sending regions such as the United Kingdom, Germany, and Scandinavia.
The second source of variation exploited by the instrument comes from the geographic dispersion in the share of individuals from each ethnic group living in different U.S. cities in 1900 (α jc). Such variation arose from the fact that, upon arrival in the United States, early settlers from different sending countries tended to locate in various U.S. cities, since the timing of outmigration varied widely across European countries, depending on local political and economic conditions (Hatton and Williamson Reference Hatton and Williamson1998). One important predictor of the geographic distribution of immigrants in the United States is the gradual expansion of railroads during the nineteenth century: as documented in Sequeira, Nunn, and Qian (Reference Sequeira, Nunn and Qian2020), places that gained access to the railroad just before an immigration boom received more immigrants in the following decade. As a consequence, before 1900, various U.S. cities were populated by different ethnic groups. For example, in 1900, while Italian communities were present in Boston, Philadelphia, and San Francisco, they were practically non-existent in Minneapolis. On the other hand, almost 4 percent of Swedes were settled in Minneapolis, but less than 1 percent of them were located in northeastern cities like Philadelphia or Boston (see also Abramitzky and Boustan Reference Abramitzky and Boustan2017). Online Appendix B presents a simple example to illustrate graphically how the instrument combines the time-series and cross-sectional variations.
Instrument Validity
Several recent papers discuss the conditions for the validity of shift-share instruments (Jaeger, Ruist, and Stuhler Reference Jaeger, Ruist and Stuhler2018; Adao, Kolesàr, and Morales Reference Adao, Kolesàr and Morales2019; Goldsmith-Pinkham, Sorkin, and Swift Reference Goldsmith-Pinkham, Sorkin and Swift2020; Borusyak, Hull, and Jaravel Reference Borusyak, Hull and Jaravel2022). In our setting, the key identifying assumption can be expressed as follows. Conditional on city and state by year fixed effects, city-specific factors that attracted immigrants from different European countries prior to 1900 must be uncorrelated both with post-1900 patterns of European immigration and with changes in socioeconomic conditions across U.S. cities.
This assumption may be violated if the city-specific characteristics that attracted immigrants from each specific sending country before 1900 had long-lasting effects both on migration patterns of individuals from that specific country and on natives’ marriage prospects. We provide evidence against this possibility in two ways. First, we document that the 1900–1910 change in outcomes is not correlated with the post-1910 change in immigration predicted by the instrument. Second, we allow cities to be on differential trends by interacting year dummies with several 1900 city characteristics—including the fraction of immigrants and proxies for manufacturing activity.Footnote 15
A second threat to identification is that local shocks hit U.S. cities while simultaneously attracting immigrants from countries that had sent more migrants to those same cities before 1900 (Borusyak, Hull, and Jaravel Reference Borusyak, Hull and Jaravel2022). The “trend-break” in immigration flows generated by WWI and the Immigration Acts mitigates this issue (Abramitzky et al. Reference Abramitzky, Ager, Boustan, Cohen and Hansen2023); it also assuages the concern of serial correlation highlighted by Jaeger, Ruist, and Stuhler (Reference Jaeger, Ruist and Stuhler2018). Tabellini (Reference Tabellini2020) presents further robustness checks in the same context as our paper, constructing alternative instruments that predict European immigration by exploiting only the WWI and quota shocks, as well as weather variation across countries in Europe. We describe all the robustness checks later, after presenting the main results.
First-Stage Results
First-stage results for the relationship between actual and predicted immigration are reported in Online Appendix Table A.4, after controlling for city and state by year fixed effects.Footnote 16 In Column (1), the dependent variable is the fraction of immigrants over actual city population, and the independent variable is the baseline instrument constructed in Equation (2). Columns (2) and (3) scale both the actual and the predicted number of immigrants by, respectively, 1900 and predicted population. In all cases, the F-stat is very high, and there is a strong and statistically significant relationship between the endogenous variable and the instrument.
Figure 1 plots the residual scatter plot of the regression reported in Column (3) and confirms visually the strong relationship between actual and predicted immigration.Footnote 17 From Column (3) onward, Online Appendix Table A.4 presents estimates for specifications where both the actual and the predicted number of immigrants are scaled by predicted city population, and explores the stability of the baseline specification to the inclusion of interactions between year dummies and 1900 city characteristics.
First, we augment the specification reported in Column (3) by interacting year dummies with the (log of) 1900 city total and immigrant population (Column (4)).Footnote 18 Next, in Columns (5) and (6), we include interactions between year dummies and, respectively, the 1904 (log of) value added by manufacture and the marriage rate of native women in 1900. Even though the F-stat falls relative to Column (1), it remains well above conventional levels. Also, and importantly, neither the economic nor the statistical significance of coefficients is affected.
MAIN RESULTS
In this section, we present three sets of results. First, immigration had a positive and large effect on marriage rates of both native women and native men. Second, the inflow of immigrants raised the probability of having children for natives by increasing both the average number of children per woman and the share of young women with at least one child. Third, immigration induced young native couples to leave their parental house earlier.
Marriage Rates
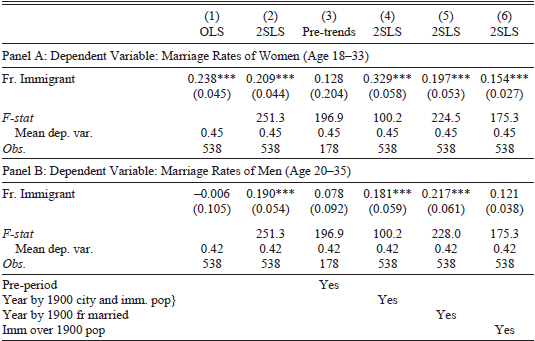
In Table 2, we study the impact of immigration on natives’ marriages, focusing on the age groups with the highest marriage rates, that is, women aged 18–33 and men aged 20–35.Footnote 19 Panels A and B show results for native women and native men, respectively, estimating OLS (Column (1)) and 2SLS (Column (2)) regressions.Footnote 20 Both OLS and 2SLS estimates suggest that immigration increased marriage rates for native women. These effects are not only statistically significant but also economically relevant. According to the coefficient in Column (2), a 5 percentage point (or, one standard deviation) increase in the fraction of immigrants raised marriage rates of native women aged 18–33 by 2.2 percent relative to the 1910 mean. Panel B documents that a similar pattern holds for native men aged 20–35: a 5 percentage point increase in immigration raised men’s marriage rates by 2.1 percent relative to their baseline mean.Footnote 21 Our findings are quantitatively close, with the opposite sign, to those obtained in Autor, Dorn, and Hanson (Reference Autor, Dorn and Hanson2019), who document that, over the last 30 years, a 1 percentage point increase in import competition from China lowered female marriage rates by 1.8 percent.
Table 2 IMMIGRATION AND MARRIAGE OF NATIVES

Notes: This table presents results of OLS and 2SLS for a balanced panel of the 180 U.S. cities with at least 30,000 residents in each Census year reported. For 1920, Sacramento (CA) and New Bedford (MA) had unreasonably low values for marriage, fertility, and the other demographic outcomes so we excluded them from the main analysis. The dependent variable is the fraction of women married in the age range 18–33 in Panel A and the fraction of men married in the age range 20–35 in Panel B. Fr. Immigrants refers to the fraction of immigrants arrived in the previous decade over predicted city population, and is instrumented using the baseline version of the instrument constructed in the Estimating Equation Section. The mean of dependent variables is shown at the bottom of the table. Column (3) is a falsification test (pre-trends). In Columns (4) and (5), we check the robustness of our results in Column (2), by augmenting our baseline specification interacting year dummies with the (log of) 1900 city and immigrants’ population and the 1900 marriage rates, respectively. Finally, in Column (6), we show the robustness of our results scaling both the actual and the predicted number of immigrants by 1900, rather than predicted, population. F-stat is the Kleibergen-Paap F stat for joint significance of instruments. All regressions include city and state by year fixed effects. Robust standard errors, clustered at the MSA level, in parentheses. *p<0.10, **p<0.05, ***p<0.01.
Source: Authors’ calculations using IPUMS data.
Subsequent columns of Table 2 explore the robustness of our baseline results. First, in Column (3), we test for pre-trends by regressing the 1900 to 1910 change in marriage rates on the post-1910 instrumented change in immigration. Reassuringly, in both Panel A and Panel B, the coefficient on immigration is statistically indistinguishable from zero and different from that reported in Column (2). Next, in Columns (4) and (5), we augment our baseline specification by interacting year dummies with the (log of) 1900 city total and immigrant population and the 1900 marriage rates, respectively. This exercise is performed to check that the results in Column (2) are not due to city-specific characteristics that may have simultaneously attracted more immigrants before 1900 and affected the evolution of natives’ marriage rates in subsequent decades. In all cases, the point estimate remains statistically significant and quantitatively close to that estimated in the baseline specification. Finally, in Column (6), we provide evidence that results are robust to scaling both the actual and the predicted number of immigrants by 1900, rather than predicted, population.Footnote 22
As an additional robustness check, we examined whether our results are robust to interacting year dummies with the initial immigrant shares of groups that are particularly important for the variation exploited by the instrument. Following the approach suggested in Goldsmith-Pinkham, Sorkin, and Swift (Reference Goldsmith-Pinkham, Sorkin and Swift2020), we first calculate the Rotemberg weights associated with each of the 16 countries in our sample, and report the standard statistics in Online Appendix Table A.7. Reassuringly, out of the 16 countries (or groups of), only France, Switzerland, and Germany had a negative weight (which was nonetheless quantitatively small). Then, we isolate the five origin country-groups with the largest Rotemberg weights (Austria and Hungary; Portugal, Greece, and Spain; Russia; Italy; and Poland).Footnote 23 We replicate the analysis by interacting year dummies with the initial shares of each of the five groups. Results are reported in Online Appendix Table A.8 for marriage rates of women and men (Panels A and B). In all cases, the estimates are in line with those from the baseline specification (reported in Column (1) to ease comparisons). Reassuringly, the size and the precision of coefficients also remain similar when including the interactions for the five countries simultaneously (Column (7)). These patterns indicate that our results are not driven by the potentially spurious correlation between the settlements of immigrant groups, which drive substantial variation in the instrument, and underlying changes in cities’ economic or demographic structure.
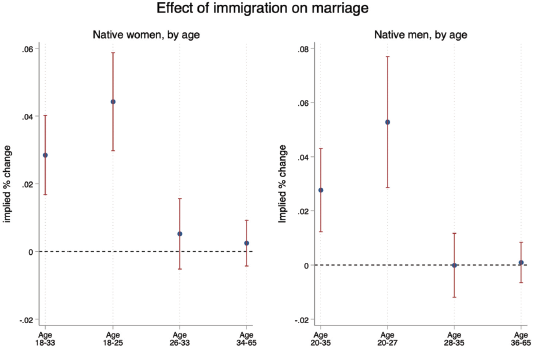
Up to now, we have reported results for the “marriage-relevant” age groups by gender. Figure 2 separately documents the effect of immigration on marriage rates of native men and women for different age groups. The effects estimated in Table 2 are driven by the youngest cohorts: a 5 percentage point increase in the fraction of immigrants raised marriage rates of native women aged 18–25 and men aged 20–27 by 3.4 percent and 4.0 percent, respectively, relative to their baseline means. The effect of immigration is not statistically significant for older cohorts. The point estimates and standard errors related to Figure 2 are reported in Online Appendix Table A.9, where we also consider the probability of being never married for the oldest cohorts (Column (5)). While immigration did not affect the probability of being never married for men, it lowered the likelihood that women aged 34–65 remained unmarried. These patterns thus suggest that, at least for native women, our estimates are not merely capturing an “anticipatory effect” in the timing of marriage.

Figure 2 THE IMPACT OF IMMIGRATION ON MARRIAGE RATES, BY GENDER AND AGE GROUPS
Notes: This graph shows the impact of a one standard deviation increase in the fraction of immigrants on the increase in marriage rates with respect to the mean value in 1910. We report the standardized coefficients by age group and for men and women separately.
Source: Authors’ calculations using IPUMS data.
Probability of Having Children
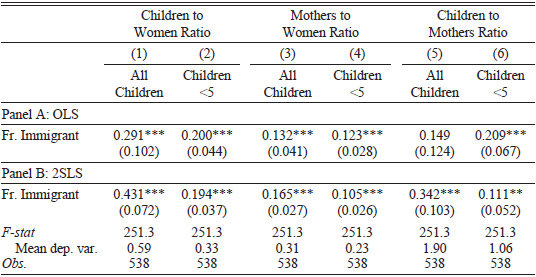
In Table 3, we study how immigration affected the probability of having children for native women. The first two columns focus on the children to women ratio, while in subsequent columns, we separately analyze the effect of immigration on the extensive and intensive margins. We define the former as the share of women with at least one child and the latter as the children to mothers ratio. In odd columns, the dependent variable is the total number of children in the household, while in even columns, the dependent variable is the number of children below the age of 5. Since full-count data allow us to match mothers with children only if they are living in the same household, we restrict the sample to women aged 18–33, whose children are likely to live with their parents.
Table 3 IMMIGRATION AND FERTILITY OF NATIVE WOMEN

Notes: This table presents results of 2SLS for a balanced panel of the 180 U.S. cities with at least 30,000 residents in each Census year reported. For 1920, Sacramento (CA) and New Bedford (MA) had unreasonably low values for marriage, fertility, and the other demographic outcomes so we excluded them from the main analysis. The dependent variable is: in Column (1) (Column (2)), the total number of children (toddlers) with a native mother in the age range 18–33 over the total number of women in the age range 18–33, in Column (3) (Column (4)) the fraction of women in the age range 18–33 who have children (toddlers) and in Column (5) (Column (6)) the average number of children (toddlers) per mother in the age range 18–33. Fr. Immigrants refers to the fraction of immigrants arrived in the previous decade over predicted city population, and is instrumented using the baseline version of the instrument constructed in the Estimating Equation Section. The mean of dependent variables is shown at the bottom of the table. F-stat is the Kleibergen-Paap F stat for joint significance of instruments. All regressions include city and state by year fixed effects. Robust standard errors, clustered at the MSA level, in parentheses. * p<0.10, ** p<0.05, *** p<0.01.
Source: Authors’ calculations using IPUMS data.
Both OLS and 2SLS results, reported in Panels A and B, respectively, document a positive and significant relationship between immigration and the probability of having children for native women. The point estimate in Column (1) of Panel B implies that a 5 percentage point increase in immigration raised the children to women ratio by 3.3 percent relative to its 1910 mean. Decomposing this effect along the extensive and the intensive margins, we note that immigration increased the number of women with children and the average number of children per woman by 2.4 percent and 1 percent, respectively. Said differently, for every ten new babies born to native women, seven were due to the extensive margin, while three were due to the intensive margin. The magnitude of the effect is similar when we restrict our attention to children below the age of 5.Footnote 24
Between the late nineteenth century and the 1930s, the United States experienced a demographic transition, with a reversal of the positive relationship between income and economic growth (Galor and Weil Reference Galor and Weil2000). The fertility rate of the total white population declined substantially, with the birth rate moving from almost 50 per thousand people in 1850 to 20 per thousand in 1930 (Zelnik Reference Zelnik1959). The inclusion of state by year fixed effects takes care of these national trends, since the effect of immigration is estimated from changes in the fraction of immigrants within the same city over time compared to other cities in the same state in a given year. Moreover, as noted by Easterlin (Reference Easterlin1961), the decline in fertility was driven by rural areas; the fertility of the urban native (white) population remained stable during this time period.Footnote 25
In Online Appendix Table A.10, we separately report the effect of immigration on fertility of native women by age groups. As for marriage, the effect is driven mainly by native women aged 18–25, especially on the extensive margin: a 5 percentage point increase in immigration raised the number of women in the younger age cohort with at least one child by 3.1 percent.
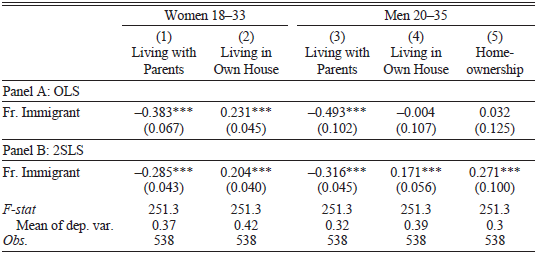
Household Formation and Homeownership
Table 4 provides evidence that immigration induced natives to leave their parental house earlier and set up their own independent family unit. In the first two columns, we focus on women aged 18–33, while in subsequent columns we report the effects of immigration on men aged 20–35.Footnote 26 Coefficients in Table 4 imply that a 5 percentage point increase in immigration raised the probability of living in an independent family unit by 2.4 percent for women and 2.2 percent for men relative to the mean in 1910. This effect is quantitatively close to that estimated for marriage rates, suggesting that the decisions to get married and leave the parental house were part of the same lifetime plan.Footnote 27 As shown in Online Appendix Figure A.2, these results are driven by women aged 18–25 and men aged 20–27: for these age groups, a 5 percentage point increase in immigration raised the probability of setting up their own household by more than 3 percent. Incidentally, these cohorts also experienced the largest increases in marriage and fertility because of immigration.
Table 4 IMMIGRATION AND LIVING CHOICES OF NATIVES

Notes: This table presents results of OLS and 2SLS for a balanced panel of the 180 U.S. cities with at least 30,000 residents in each Census year reported. For 1920, Sacramento (CA) and New Bedford (MA) had unreasonably low values for marriage, fertility, and the other demographic outcomes, so we excluded them from the main analysis. The dependent variables are listed in the top row of the table. Fr. Immigrants refers to the fraction of immigrants arrived in the previous decade over predicted city population, and is instrumented using the baseline version of the instrument constructed in the Estimating Equation Section. The mean of the dependent variables in 1910 is at the bottom of the table. F-stat is the Kleibergen-Paap F stat for joint significance of instruments. All regressions include city and state by year fixed effects. Robust standard errors, clustered at the MSA level, in parentheses. ***p < 0.01, **p < 0.05, p* < 0.10.
Source: Authors’ calculations using IPUMS data.
Consistent with the evidence provided thus far, Column (5) of Table 4 shows that immigration boosted homeownership rates for native men aged 20–35. The point estimate implies that a 5 percentage point increase in immigration raised homeownership rates for natives by 1.3 percentage points, or around 5 percent relative to the 1910 mean. Between 1910 and 1930, homeownership rates for natives in our sample increased, on average, by 10 percentage points, moving from 0.35 to 0.45. Our estimates suggest that the economic expansion induced by immigration can explain at least 10 percent of the increase in homeownership that took place in the cities in our sample from 1910 to 1930.
Stitching together the three sets of results presented in this section, our estimates paint a coherent picture of how immigration affected family formation, marriage rates, and fertility of native men and women in the urban early twentieth-century United States. The inflow of immigrants induced natives to marry more (and, possibly, earlier); this decision was accompanied by the choice to leave the parental house, buy a home, and set up an independent family unit. In a period in which oral contraception was not yet available (Bailey Reference Bailey2006), higher fertility was probably mechanically related to marriage and family formation decisions.
MECHANISMS
In this section, we explore the mechanisms. First, we document that immigration raised employment of native men, in turn increasing the supply of native “marriageable men.” Next, we provide evidence that compositional changes in the native-born population, changes in sex ratios, natives’ cultural responses, and direct effects of immigration on native female labor force participation cannot, alone, explain our results.
Natives’ Employment and the Supply of Marriageable Men
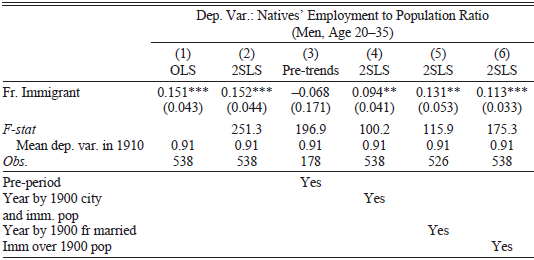
In two important contributions, Wilson (Reference Wilson1987, Reference Wilson1996) argues that the decline in marriage and the rise in the share of single-mother households in the United States since the 1970s have been, at least in part, due to deteriorating employment opportunities in manufacturing. Along these lines, exploiting exogenous variation in exposure to import competition from China across U.S. local labor markets, Autor, Dorn, and Hanson (Reference Autor, Dorn and Hanson2019) find that job losses in manufacturing caused a steep decline in marriage rates and a significant increase in the proportion of single-mother households. In this section, we investigate the possibility that a similar mechanism, with the opposite sign, was at play in our context. Specifically, we advance and empirically test the hypothesis that immigration had a positive effect on natives’ marriages by increasing employment and occupational standing of native men, in turn raising the supply of native “marriageable men.”
In Table 5, we study the effects of immigration on natives’ employment to population ratio, focusing on men in the “marriageable relevant” age range of 20–35. As in Table 2, Columns (1) and (2) estimate the baseline specification with OLS and 2SLS, respectively. In both cases, there is a strong and positive relationship between immigration and natives’ employment. The coefficient in Column (2), which is quantitatively very close to OLS results reported in Column (1), implies that a 5 percentage point increase in immigration raised natives’ employment to population ratio by 0.8 percent relative to its 1910 mean. As documented in Online Appendix Figure A.3, the effect of immigration is slightly larger for men in the age range 20–27, but remains positive and statistically significant for those aged 28–35. The point estimate is positive and quantitatively very similar, albeit not statistically significant, for older natives (aged 36–65).
Table 5 IMMIGRATION AND EMPLOYMENT OF NATIVE MEN

Notes: This table presents results of OLS and 2SLS for a balanced panel of the 180 U.S. cities with at least 30,000 residents in each Census year reported. The number of observations in Column (5) is 526 due to missing data on the (log of) 1904 value added by manufacture per establishment. For 1920, Sacramento (CA) and New Bedford (MA) had unreasonably low values for marriage, fertility, and the other demographic outcomes so we excluded them from the main analysis. The dependent variable is the natives’ employment to population ratio in the age range 20–35 for men. Fr. Immigrants refers to the fraction of immigrants arrived in the previous decade over predicted city population, and is instrumented using the baseline version of the instrument constructed in the Estimating Equation Section. Column (3) is a falsification test (pre-trends). In Columns (4) and (5), we check the robustness of our results in Column (2), by including the interaction between year dummies and, respectively: the (log of) 1900 city and immigrant population and the (log of) 1904 value added by manufacture per establishment. Finally, in Column (6), we show the robustness of our results scaling both the actual and the predicted number of immigrants by 1900, rather than predicted, population. The mean of the dependent variables is shown at the bottom of the table. F-stat is the Kleibergen-Paap F stat for joint significance of instruments. All regressions include city and state by year fixed effects. Robust standard errors, clustered at the MSA level, in parentheses. *p<0.10, ** p<0.05, *** p<0.01.
Source: Authors’ calculations using IPUMS data.

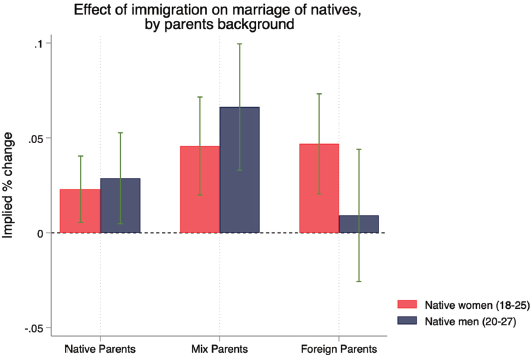
Figure 3 THE IMPACT OF IMMIGRATION ON MARRIAGE RATES, BY PARENTAGE
Notes: This graph shows the impact of a one standard deviation increase in the fraction of immigrants on the marriage rates of men and women by parentage with respect to the mean value in 1910. We report the standardized coefficients, separately by parentage and gender.
Source: Authors’ calculations using IPUMS data.
Subsequent columns of Table 5 test the robustness of these results. First, we verify that there are no pre-trends (Column (3)). Second, we show that results are robust to interacting year dummies with the 1900 log of city total and immigrant population (Column (4)) and log of value added in manufacturing (Column (5)). Third, we check that our estimates are unchanged when scaling both the actual and the predicted numbers of immigrants by 1900, rather than predicted, city population (Column (6)).Footnote 28
Results in Table 5 are somewhat different from those obtained in Abramitzky et al. (Reference Abramitzky, Ager, Boustan, Cohen and Hansen2023), who find that the 1920s Immigration Acts did not have any impact on natives’ employment. We suspect that the different time period (1910–1930 vs. 1920–1930 only) and geography (cities vs. entire country) explain the discrepancy between our findings and those in Abramitzky et al. (Reference Abramitzky, Ager, Boustan, Cohen and Hansen2023). Our estimates are instead consistent with those in Ager and Hansen (Reference Ager and Hansen2017), Tabellini (Reference Tabellini2020), and Price, vom Lehn, and Wilson (2020). Most closely related to our paper, Tabellini (Reference Tabellini2020) shows that immigration induced natives to leave occupations that were more exposed to immigrants’ competition and to take up jobs where immigrants were prevented from entering, because of skill and language mismatch or because of discrimination. By linking individuals across Census years, Price, vom Lehn, and Wilson (2020) also find that such economic gains accrued to young native workers who in-migrated to cities that received more European immigrants, whereas older native workers who were likely displaced by the foreign-born moved elsewhere in the country. These heterogeneous effects do not alter either the validity or the interpretation of our results, since they are still consistent with the idea that, in this historical context, immigration increased the supply of native “marriageable men”—and this, in turn, increased marriage rates, the probability of having children, and family formation among natives.
In Online Appendix Table A.11, we provide additional evidence on the economic effects of immigration for native-born men in the marriageable age range (20–35). After re-stating the main result for employment (Column (1)), we document that immigration increased the share of native-born men holding a high-skilled job (Column (2)).Footnote 29 Consistent with immigrants inducing natives to take on better jobs, we also find that immigration increased the occupational income score of native-born men (Columns (3) and (4)).Footnote 30 Finally, we show that there is a positive relationship between immigration and the share of native-born women who were married to a native-born man who was employed (Column (5)) and held a high-skill job (Column (6)). Note, however, that the point estimate in Column (5) is not statistically significant.
Children, Schooling, and Economic Conditions of Families
The effects documented earlier suggest that immigration affected economic conditions of native families, with potentially long-lasting implications for younger generations. Consistent with this idea, Online Appendix Table A.12 shows that immigration lowered the share of children below the age of 10 born to native parents living in a household where the father was unskilled (Column (1)).Footnote 31 Similarly, even if the coefficient is not statistically significant at conventional levels, there is a positive relationship between immigration and the share of children of native parentage whose fathers were employed. These results suggest that, because of immigration, children of native parentage were likely to grow up in a better environment at home.
Next, in Online Appendix Table A.13, we show that immigration increased the fraction of sons with native parents aged 6–14 who were enrolled in school (Column (1)). Somewhat interestingly, though, we do not find a similar effect for daughters (Column (2)), even if the 1910 average enrollment was very similar for boys and girls. One possible explanation for this pattern is that families were credit constrained and, as more resources became available, parents chose to invest them first in sons rather than in daughters (Parish and Willis Reference Parish and Willis1993; Barcellos, Carvalho, and Lleras-Muney Reference Barcellos, Carvalho and Lleras-Muney2014).
Especially in an urban context, the employment boom generated by immigration might have increased job opportunities for male teens, leading them to drop out of school. In line with this idea, Column (3) of Online Appendix Table A.13 documents that immigration had a negative and statistically significant effect on school attendance for native males aged 15–18.Footnote 32 The 2SLS coefficient in Column (3) implies that a 5 percentage point increase in immigration lowered school enrollment rates for native males of age 15–18 by 0.7 percentage points, or 2 percent relative to the 1910 mean. The decline in school enrollment of native teens reported in Column (3) of Online Appendix Table A.13 is accompanied by a symmetrical increase in their employment probability (Column (4)). Specifically, a 5 percentage point increase in immigration raised the employment to population ratio for native males in the age range 15 to 18 by 1.5 percentage points, or 2.5 percent relative to the baseline mean. It is interesting to note that, for this age group, the percentage increase in employment implied by immigration is almost identical to the percentage decline in school enrollment, suggesting that these two patterns were closely related to each other.
Our interpretation is that, by increasing the opportunity cost of schooling, the economic expansion generated by immigration induced young (native) teens to drop out of school and enter the labor market earlier. As shown in Column (5) of Online Appendix Table A.13, most of the young males pulled into the labor force entered industries that were “not specified” in the U.S. Census, which were unlikely to provide workers with opportunities for skill or occupational upgrading.Footnote 33 These findings resonate with those in Charles, Hurst, and Notowidigdo (Reference Charles, Hurst and Notowidigdo2019) and Cascio and Narayan (Reference Cascio and Narayan2022) for the contemporaneous period. They also suggest that, despite its average benefits for native workers and their families, the economic boom generated by immigration may have had long-lasting, negative consequences for native teens. By entering low-growth industries and by reducing their human capital accumulation, younger generations might have increased their exposure to future economic downturns.
Compositional Changes in the Native-Born Population
Price, vom Lehn, and Wilson (2020) documented that European immigration induced in- and out-migration of native-born men across U.S. cities in this historical context. If such migration response were concentrated within men 20–35, our estimates might partly capture compositional changes. While this would not invalidate our results, it would change their interpretation. In this section, we consider this mechanism using two complementary strategies.
First, we replicate the analysis by focusing on natives born within the same state.Footnote 34 We acknowledge that this is an admittedly imperfect proxy for non-movers, since it misses within-state migrants. Yet, it allows us to consider both men and women, since most standard linking algorithms are unable to follow women over time across U.S. Censuses (Abramitzky et al. Reference Abramitzky, Boustan, Eriksson, Feigenbaum and Perez2021). Moreover, by using data from the full-count Census, we do not need to deal with the potential concern of selection in the linking process, which may increase concerns about the generalizability of results as well as the validity of our estimates (Bailey et al. Reference Bailey, Cole, Henderson and Massey2020).
In Columns (1) to (5) of Online Appendix Table A.14, we consider the main outcomes for native-born men: marriage rates, share living with parents and in own house, home ownership, and employment. In Columns (6) to (8), we consider native-born women, presenting results for marriage rates and living choices. In Online Appendix Table A.15, we consider the six proxies for fertility used in Table 3. The estimates obtained for the sample of individuals born within the same state (Panel B) are remarkably similar to those from the main sample (Panel A), indicating that compositional changes induced by between-state migration are unlikely to influence our results. The only partial exception is the employment to population ratio: in Panel B, the point estimate is positive and statistically significant at the 10 percent level, but the magnitude is smaller. Note, however, that the 1910 mean of the employment to population ratio is also substantially larger for this sample compared to that of the baseline sample.
Second, we use the linked sample of (native-born) men taken from Abramitzky et al. (Reference Abramitzky, Boustan, Eriksson, Feigenbaum and Perez2021), restricting attention to individuals who lived in the same city during the previous decade. While this sample is not fully representative and does not include women (Bailey et al. Reference Bailey, Cole, Henderson and Massey2020), it allows us to consider both within and between state movers. We present results in Columns (1) to (5) of Online Appendix Table A.14, Panel C.Footnote 35 In all cases, results are in line with those presented in Panel A. As for Panel B, the only partial exception is the coefficient for employment to population ratio, which is precisely estimated but smaller than in both Panels A and B. It is worth noting that the 1910 mean of the employment to population ratio in the linked sample is 0.99, suggesting that this is a selected sample of men with higher attachment to the labor force and that there is limited scope for this variable to increase any further.
Taken together, the evidence in this section indicates that compositional changes among the native-born population cannot, alone, explain our results.
Changes in Sex Ratios
The literature has documented that sex ratios, that is, the relative number of men and women, can be an important determinant of marriage and family formation decisions (Angrist Reference Angrist2002; Abramitzky, Delavande, and Vasconcelos Reference Abramitzky, Delavande and Vasconcelos2011; Lafortune Reference Lafortune2013). Since more than 60 percent of immigrants entering the United States at the beginning of the twentieth century were young men, immigration likely altered sex ratios, possibly increasing the availability of potential mates for native women. However, we argue that this channel cannot explain a substantial fraction of our main results.
First, while changes in the relative number of men and women might have contributed to the increase in marriage rates and fertility of native women, they can hardly explain why immigration also raised marriage rates of native men.Footnote 36 Second, as we show in Column (3) of Table 6 (Panel A), only 5 percent of native women had a foreign-born husband; likewise, Column (3) of Online Appendix Table A.16 documents that only 3 percent of native men had a foreign-born wife as of 1910. In addition, the increase in marriage rates for men and women was quantitatively similar (Table 2), suggesting that natives, in most cases, were marrying each other. These observations resonate with the idea that, at the time, marriage markets were highly segmented along ethnic lines (Angrist Reference Angrist2002).Footnote 37
Table 6 IMMIGRATION, MARRIAGE RATES, AND FERTILITY OF NATIVE WOMEN AGED 18–33 (2SLS RESULTS)

Notes: This table presents results of 2SLS for a balanced panel of the 180 U.S. cities with at least 30,000 residents in each Census year reported. For 1920, Sacramento (CA) and New Bedford (MA) had unreasonably low values for marriage, fertility, and the other demographic outcomes, so we excluded them from the main analysis. In Panel A, the dependent variable is the marriage rate of women aged 18–33 by husband parentage. In Panel B, the dependent variable is the children to women ratio by father parentage. We consider only children of women aged 18–33. For example, in Column (2) of Panel B, the dependent variable is the number of children with a native mother aged 18–33 and a father with native parentage over the number of native women aged 18–33. Columns (4)–(6) focus on women who are second-generation immigrants. Fr. Immigrants refers to the fraction of immigrants arrived in the previous decade over predicted city population, and is instrumented using the baseline version of the instrument constructed in the Estimating Equation Section. The mean of the dependent variables is shown at the bottom of the table. F-stat is the Kleibergen-Paap F stat for joint significance of instruments. All regressions include city and state by year fixed effects. Robust standard errors, clustered at the MSA level, are in parentheses. *p < 0.10, **p< 0.05, ***p < 0.01.
Source: Authors’ calculations using IPUMS data.
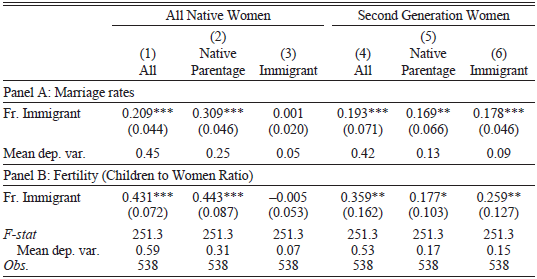
Results reported in Panel A of Table 6 indicate that a 5 percentage point increase in immigration raised the probability of getting married to a husband of native parentage by around 6 percent for all native women, irrespective of their parentage (Columns (2) and (5)). The effect of immigration on the probability of having a foreign-born spouse for native women was indistinguishable from zero (Column (3)). For second-generation women, the impact of immigration on marriage is positive and statistically significant (Column (6)). However, since second-generation women who had a foreign-born husband represented less than 2.5 percent of all native women, focusing on females aged 18–33 implies a negligible effect of immigration on the overall marriage rates of native women.Footnote 38 Panel B documents that these effects were mirrored by a corresponding increase in fertility precisely for couples with higher marriage rates, supporting the idea that immigration raised natives’ fertility by fostering marriage in an era when oral contraception was not yet available (Bailey Reference Bailey2006).
Having established that most of the effects of immigration were not driven by native women marrying foreign-born husbands, in the last part of this section, we study how the inflow of immigrants affected marriage prospects of second-generation men and women. Sex ratios can have important implications for the marriage market of second-generation immigrants, both directly and indirectly through the allocation of bargaining power within the couple. For example, in the same historical context of our paper, Angrist (Reference Angrist2002) finds that a higher relative number of men in their own ethnic group improved marriage prospects of second-generation females.
Figure 3 documents a pattern in line with this idea: because of immigration, marriage rates of second-generation women aged 18–25 increased twice as much as those of women of native parentage. On the other hand, while immigration had a positive and large effect on marriage rates for men of native parentage, it did not have any significant impact on second-generation men. This finding is consistent with the idea that immigration increased competition in the marriage market for second-generation men. In Online Appendix Table A.18, we separately report the effect of immigration on marriage rates of native men and women for different age groups and parentage, and document that all of the effect comes from the youngest cohorts represented in Figure 3 (i.e., women aged 18–25 and men aged 20–27).
To sum up, even though sex ratios were affected by immigration, they can hardly explain the increase in marriage rates of natives with native parentage, a group for which the relative number of men and women in the reference population was not significantly affected. Since U.S.-born individuals of native parentage were by far the largest group among natives, their decisions disproportionately affected natives’ marriage and fertility.
Preservation of “Natives”
Opposition to immigration was widespread during the Age of Mass Migration, with a heated aversion toward individuals coming from non-Anglo-Saxon and non-English-speaking countries (Higham Reference Higham2002; Leonard Reference Leonard2016). Since immigrants from Southern and Eastern Europe were linguistically and culturally far from natives (Hatton and Williamson Reference Hatton, Williamson, Foders and Rolf2006), it is possible that natives reacted to immigration by marrying more and having more children in order to preserve their own race and culture.
The role of culture in affecting marriage and fertility decisions has been stressed by, among others, Bisin and Verdier (Reference Bisin and Verdier2000) and Fernandez and Fogli (Reference Fernandez and Fogli2006), who study the transmission of cultural norms among second-generation immigrants in the United States. More broadly, social interactions can influence the diffusion of cultural norms and might have historically contributed to the convergence of fertility rates, both within and across countries (Spolaore and Wacziarg Reference Spolaore and Wacziarg2022). For instance, Daudin, Franck, and Rapoport (Reference Daudin, Franck and Rapoport2019) find that the demographic transition at the end of the nineteenth century in France was affected by the diffusion of low-fertility norms through internal migration.
To test if native men and women changed their family formation decisions to preserve their own culture, we analyze whether the effect on marriage rates and fertility was stronger when natives were exposed to linguistically farther individuals (which we take as a proxy for cultural distance). Specifically, we construct an index of immigrants’ linguistic distance from English,
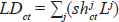 $L{D_{ct}} = {{\sum}_j} (sh_{ct}^j{L^j})$
, where
$L{D_{ct}} = {{\sum}_j} (sh_{ct}^j{L^j})$
, where
 $sh_{ct}^j$
is the share of ethnic group j among the foreign-born population of city c in year t, and Lj is the linguistic distance from English of country j, computed in Chiswick and Miller (Reference Chiswick and Miller2005).Footnote 39 To ease the interpretation of results, which are reported in Online Appendix Table A.19, we standardize our measure of linguistic distance by subtracting its mean and dividing it by its standard deviation.
$sh_{ct}^j$
is the share of ethnic group j among the foreign-born population of city c in year t, and Lj is the linguistic distance from English of country j, computed in Chiswick and Miller (Reference Chiswick and Miller2005).Footnote 39 To ease the interpretation of results, which are reported in Online Appendix Table A.19, we standardize our measure of linguistic distance by subtracting its mean and dividing it by its standard deviation.
The coefficient on the fraction of immigrants remains positive and statistically significant, while that on the index of linguistic distance is close to zero and imprecisely estimated. Even though this evidence should be viewed as suggestive, it is not consistent with the idea that our results are driven by natives’ cultural reactions that might have induced them to marry more often in order to preserve their own race (Bisin and Verdier Reference Bisin and Verdier2000; Bisin and Tura Reference Bisin and Tura2019; Spolaore and Wacziarg Reference Spolaore and Wacziarg2022).
Increased Labor Market Competition for Women
From the end of the nineteenth century to the 1920s, female workers were mainly young, unmarried, and from low-income households (Goldin Reference Goldin2006). Most women were employed as pieceworkers in manufacturing, as private household workers or laundresses, or in clerical jobs. Upon getting married, women typically quit their jobs because of the stigma attached to wives working outside the home (Cherlin Reference Cherlin2014). Goldin (Reference Goldin1990) estimates that, before 1940, more than 80 percent of all married women exited the labor force upon marriage (see Goldin Reference Goldin1990, p. 7). As shown in Online Appendix Table A.20, in our sample of cities, the 1910 average labor force participation of native women aged 18–25 was 0.49, but was substantially lower for older women (0.33 and 0.25 for women aged 26–33 and 34–65, respectively).Footnote 40
Studying the link between immigration, female labor force participation, and fertility, Furtado (Reference Furtado2016) shows that the availability of cheaper childcare opportunities brought about by immigration induced native women to have more children and work longer hours. In contrast to these results, at the beginning of the twentieth century, immigration may have increased competition in the labor market for women, which in turn induced them to first leave their jobs and then, as a consequence, to get married and have more children (Angrist and Evans Reference Angrist and Evans1998). While possible, this interpretation seems to be inconsistent with the historical context studied in our paper: at that time, as already discussed, women most frequently took care of their own children and tended to quit their jobs upon marriage. Moreover, even though immigrants provided a cheap and unskilled supply of labor, which in principle might have displaced women, during the Age of Mass Migration, the U.S. economy had large potential for economic expansion (Higgs Reference Higgs1971). Thus, the displacement of female workers due to immigration seems unlikely, even more so as immigrants were more closely substitutes for men than for women, and we showed earlier that immigration increased natives’ employment.
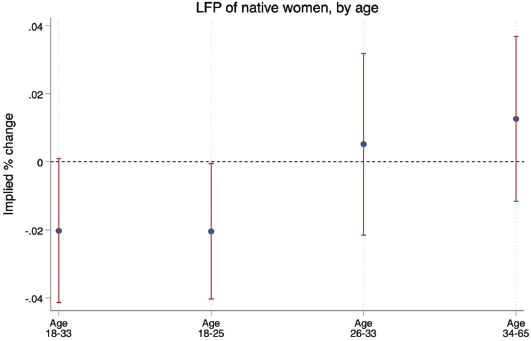
In line with this discussion, Online Appendix Table A.20 documents that immigration lowered labor force participation only for native women in the age group that experienced a significant increase in marriage rates (namely, women aged 18–25). The impact is indistinguishable from zero for all older age cohorts, including women between 26 and 33 years old, one-third of whom are in the labor force.Footnote 41 In Figure 4, we report the implied coefficients for the effect of a 5 percentage point increase in immigration, and show that female labor force participation in the age group 18–25 fell by 1.6 percent relative to its 1910 mean. Incidentally, this effect is only slightly smaller (in absolute value) than the increase in marriage induced by immigration for women in the same age group (Figure 2). Our interpretation of these results is that immigration first induced native women to marry and have children, and then, as a consequence of these two decisions, to leave the labor force.

Figure 4 THE IMPACT OF IMMIGRATION ON LABOR FORCE PARTICIPATION, BY AGE GROUPS OF WOMEN
Notes: This graph shows the impact of a 5 percentage point increase in the fraction of immigrants on the decrease in labor force participation of women with respect to the mean value in 1910. We report the standardized coefficients separately by age group.
Source: Authors’ calculations using IPUMS data.
CONCLUSIONS
Immigration has long been a defining feature of American society, and a large literature has investigated its economic and political effects. In this paper, we consider the effects that immigration has had on important social and demographic outcomes, such as marriage, fertility, and family formation. We focus on the Age of Mass Migration (1850–1920), when more than 30 million Europeans moved to the United States. We use a shift-share design to study the impact of immigration on marriage rates, the probability of having children, and the propensity to leave the parental house for young native men and women living in U.S. cities between 1910 and 1930.
We find that, by promoting economic activity, immigration increased the supply of native “marriageable” men who, because of their better employment prospects, became more attractive spouses. This, in turn, raised natives’ marriage rates for both men and women, and induced young adults to leave their parents’ houses earlier in their lives. Higher marriage rates, in a period when oral contraception was not yet available, raised natives’ probability of having children, mainly by increasing the number of women with at least one child.
In the context studied in this paper, immigrants were beneficial to natives’ economic and social outcomes. However, this does not imply that immigration will always promote fertility and marriage among young natives. In fact, if immigrants increase labor market competition for natives, they may deteriorate, rather than promote, the prospects for family stability as well as the environment where children grow up. Moreover, while we showed that in the early twentieth century, immigration to U.S. cities affected marriage rates and fertility of natives mostly through (positive) income shocks, other channels may be at play in other settings. These observations suggest that one needs to be careful when extrapolating our results to other contexts.
Findings in this paper provide motivation for future work in at least two directions. First, we have not explored how changes in the supply of “marriageable men” affected the quality of the match between husbands and wives. If higher marriage rates were associated with worse matching between partners, this might have increased divorce rates and family instability, in turn lowering children’s well-being (Stevenson and Wolfers Reference Stevenson and Wolfers2007; Lundberg, Pollak, and Stearns Reference Lundberg, Pollak and Stearns2016). Second, it would be interesting to investigate other contexts, where a different set of channels might be at play.