


Since October 2023, the Gaza Strip has endured intense military operations and severe restrictions on circulation of people and goods. During the first 7 months of the war (October 2023 to April 2024), reduced food deliveries caused highly prevalent food insecurity and triggered warnings of impending famine(1,2) . There were consistent media and civil society reports of food scarcity, particularly among people who had remained in the two northern governorates (Gaza City, North Gaza), where food deliveries had been scarcest, and instances of fatal starvation were recorded(Reference McKernan3). From April 2024 onward, an apparent improvement in food security coinciding with re-opened border crossings was noted(4), but objective data were obscured by Israel’s takeover of customs points from which the United Nations had previously tracked the content of incoming truckloads(5).
Acute malnutrition is a short-term consequence of dietary insufficiency and, in crises, disproportionately affects children and pregnant or lactating women(Reference Bhutta, Berkley and Bandsma6). Its population burden is typically measured by cross-sectional surveys in which children aged 6–59 months old (mo) are classified as severely or moderately malnourished based on their weight-for-height Z-score (WHZ) and/or the presence of bilateral pitting oedema(Reference Checchi, Warsame and Treacy-Wong7,Reference Frison, Kerac and Checchi8) . In Gaza, these surveys have been hampered by insecurity; humanitarian actors have instead relied on rapid community-based screening based on middle-upper-arm circumference, an anthropometric index that, while predictive of the risk of death(Reference Khara, Myatt and Sadler9), does not correlate well with WHZ(Reference Schwinger, Golden and Grellety10). These screenings have, to our knowledge, relied on convenience rather than population-representative samples.
In a separate publication, we analysed multiple sources of food to estimate caloric availability over time in both northern Gaza and the south-central governorates(Reference Checchi, Ververs and Jamaluddine11). Here, we introduce a mathematical modelling framework to estimate acute malnutrition prevalence based on caloric availability, whilst accounting for protective or risk factors including malnutrition treatment, incidence of common infectious disease, reduced breast-feeding and disproportionate sharing of food by adults with their children (hereafter ‘caloric sacrifice’), a plausible coping mechanism. We apply the model to the Gaza context and reconstruct the evolution of acute malnutrition prevalence, while also forward-projecting it under alternative scenarios.
Methods
Study population and period
We stratified Gaza into a northern (North Gaza, Gaza City governorates) and south-central region (Deir al Balah, Khan Younis and Rafah). The northern region contained approximately 1 200 000 people pre-war(12) but only about 250 000 by March 2024(13). We sourced Gaza’s age–sex distribution and proportion of pregnant and lactating women from UN projections of the 2017 census(14) and the distribution and mean number of household members from the census itself(15).
Our retrospective analysis period spans from 7 October 2023 to 6 May 2024, when the Israeli Defence Force’s takeover of the southern border crossings meant the UN could no longer collect comprehensive food trucking data(5). We present scenario-based forward projections for the period from 7 May to 31 December 2024.
Overall model description
We simulate an open cohort of children 0–59 months with daily time steps. Each child is attributed a random age, sex and height and weight growth percentiles at birth that determine their anthropometric trajectory through age and time under non-crisis conditions. These percentiles are based on the estimated distribution of growth curves for pre-war Gaza (see below), which are assumed to already reflect exposure to pre-crisis levels of different risk factors and are used to estimate pre-war caloric intake. The cohort is aged up to the crisis’ start date and is then progressed through the retrospective estimation period by exposing it to the estimated caloric availability per day during the crisis, adjusted for the extent of adults’ assumed caloric sacrifice, as well as time-varying factors including excess (i.e. crisis minus baseline) burden of acute respiratory infection and acute watery diarrhoea, excess prevalence of non-exclusive breast-feeding during infancy and the coverage of severe and moderate acute malnutrition (SAM, MAM) treatment. The model then exposes the cohort to one or more forward-projection scenarios in which the values of the above variables are arbitrarily set to explore possible crisis trajectories. Children who age out of the cohort are replaced by newborns with the same sex, breast-feeding exclusivity and height-weight percentiles. Mortality is omitted, and population assumed constant. We adapt a published mechanistic model(Reference Hall, Butte and Swinburn16) to predict children’s weight change over each time step as a function of caloric intake and resulting energy balance. We present model components and inputs below.
Pre-war growth curve estimation
Before the war, the United Nations Relief and Works Agency for Palestine Refugees in the Near East (UNRWA) offered free growth monitoring visits to Gazan children up to age 5 years. We sourced from UNRWA 2 704 336 (1 307 754 female or 48·8 %) individual weight and height observations collected longitudinally between 2019 and 2023 (a median 10 observations per child), reduced to 2 697 477 (99·7 %) after removing children with < 3 observations and implausible values (weight-for-height, weight-for-age and/or height-for-age > ±5 Z-scores as computed using the R anthro package developed to accompany the WHO’s 2006 growth standards(17,18) ). As shown in the online Supplementary Material (Figure S1), observations were mostly spaced 3 months apart and decreased after age 18 months.
We applied to the above data the WHO’s method for constructing a pre-war distribution of sex-specific weight-for-age (WAZ) and height-for-age growth curves (online Supplementary Figures S2–S3), which relies on a generalised additive model for location, size and shape (global acute malnutrition, implemented through the gamlss package(Reference Rigby and Stasinopoulos19)) with a Box–Cox-power-exponential distribution(18). From each model fit, we extracted the predicted 0–99 % percentiles of weight and height at any age.
We assumed that children would remain at the same percentile through life if pre-war conditions persisted. In reality, children exhibit individual heterogeneity in their trajectory, but our simplifying assumption should be appropriate as long as, at the aggregate level, it accurately replicates observed population variability (see Results): this should occur if heterogeneity is random. Accordingly, we allocated an equal fraction of the cohort to each weight percentile. We also attributed a random height percentile, accounting for the observed correlation of height with weight curves (online Supplementary Figure S4). We did this by first fitting (in package mgcv(Reference Wood20)) a generalised additive negative-binomial model to the count of children within each mean weight-height percentile combination, featuring a tensor smoothing product of each child’s mean weight and height percentile as observed over their longitudinal observations, adjusted for sex and with the log of the number of children in each mean weight percentile as an offset (online Supplementary Figure S5). We used the model-fitted counts of height percentile within each weight percentile as a probability distribution from which to sample when attributing a random birth height percentile to each child in the cohort, conditional on weight percentile. We also tried sampling from the empirical weight-height correlation matrix, but this resulted in cohorts with height-for-age variance well below that observed.
Weight sub-model
Hall et al.(Reference Hall, Butte and Swinburn16) have developed a mechanistic model that predicts weight change over time
 $t$
as the sum of change in fat (FM) and fat-free (lean) mass (FFM), given the balance of energy (caloric) intake and energy expenditure (
$t$
as the sum of change in fat (FM) and fat-free (lean) mass (FFM), given the balance of energy (caloric) intake and energy expenditure (
 ${I_t} - {E_t}$
). Briefly,
${I_t} - {E_t}$
). Briefly,
 ${E_t}$
sums requirements due to baseline metabolism, food digestion, physical activity and growth, which vary by sex and age based on set constants. FM and FFM are burnt if intake is insufficient and accrete if intake surpasses expenditure; both processes entail energy costs and gains. Partitioning of energy between FM and FFM is age-dependent and a function of their relative availability. The model, developed to support weight management programmes, has been validated in older children and adults, but to our knowledge not applied widely among young children (see Discussion). We therefore verified that it satisfactorily predicted the expected WHO standards by setting birth weight at the 0 WAZ level as per WHO standards and FM and FFM at birth based on Fomon et al.’s expected median values(Reference Fomon, Haschke and Ziegler21) and running the model to age 60 months (online Supplementary Figure S6). When applying the model to Gaza, we set birth weight percentiles as outlined above, and apportioned birth weight into FM and FFM using the sex-specific regression equations provided by Eriksson et al.(Reference Eriksson, Löf and Forsum22).
${E_t}$
sums requirements due to baseline metabolism, food digestion, physical activity and growth, which vary by sex and age based on set constants. FM and FFM are burnt if intake is insufficient and accrete if intake surpasses expenditure; both processes entail energy costs and gains. Partitioning of energy between FM and FFM is age-dependent and a function of their relative availability. The model, developed to support weight management programmes, has been validated in older children and adults, but to our knowledge not applied widely among young children (see Discussion). We therefore verified that it satisfactorily predicted the expected WHO standards by setting birth weight at the 0 WAZ level as per WHO standards and FM and FFM at birth based on Fomon et al.’s expected median values(Reference Fomon, Haschke and Ziegler21) and running the model to age 60 months (online Supplementary Figure S6). When applying the model to Gaza, we set birth weight percentiles as outlined above, and apportioned birth weight into FM and FFM using the sex-specific regression equations provided by Eriksson et al.(Reference Eriksson, Löf and Forsum22).
Unless a caloric deficit/surplus is specified, the weight model outputs growth under energy balance, that is, its predictions default to the population median no matter which birth weight a child starts out with (online Supplementary Figure S8). This masks the expected variability of WAZ and compromises the model’s application for SAM and global acute malnutrition (GAM) prevalence estimation, which relies on accurately estimating not just the central tendency but also the distribution of WAZ, height-for-age and thus WHZ, so that SAM and GAM cases, who exist at the negative end of the curve, may be modelled accurately(Reference Frison, Kerac and Checchi23). To correctly replicate the weight trajectories corresponding to different growth percentiles, we introduced a sex (
 $s$
)-, age (
$s$
)-, age (
 $a$
)- and weight percentile (
$a$
)- and weight percentile (
 $w$
)-dependent calibration factor
$w$
)-dependent calibration factor
 ${m_{s,a,w}}$
defined by a two-parameter cumulative log-normal function, which seemed suitable for the pattern evident in growth curves, namely rapid weight gain in infancy followed by lower weight gain velocity:
${m_{s,a,w}}$
defined by a two-parameter cumulative log-normal function, which seemed suitable for the pattern evident in growth curves, namely rapid weight gain in infancy followed by lower weight gain velocity:
 \begin{align}{m_{s,a,w}} & = {\delta _c}{\vartheta _{0,s,w}}\left( {1 + {{{1 \over {a\sqrt {2\pi } }}{e^{\left[ { - {1 \over 2}{{\left( {\log a - {\vartheta _{1,s,w}}} \right)}^2}} \right]}}} \over {{1 \over {{a_{{\rm{max}}\;}}\sqrt {2\pi } }}{e^{\left[ { - {1 \over 2}{{\left( {\log {a_{{\rm{max}}\;}} - {\vartheta _{1,s,w}}} \right)}^2}} \right]}}}}} \right) \\& = {\delta _c}{\vartheta _{0,s,w}}\left( {1 + {{{a_{{\rm{max}}\;}}} \over a}{{{e^{\log a( - 0\cdot5\log a + {\vartheta _{1,s,w}})}}} \over {{e^{\log {a_{{\rm{max}}\;}}( - 0\cdot5\log {a_{{\rm{max}}\;}} + {\vartheta _{1,s,w}})}}}}} \right)\end{align}
where
 ${\vartheta _{0,s,w}}$
and
${\vartheta _{0,s,w}}$
and
 ${\vartheta _{1,s,w}}$
are unknown parameters and
${\vartheta _{1,s,w}}$
are unknown parameters and
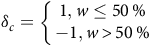 ${\delta _c} = \left\{ {\matrix{ {1,w \le 50\,\% } \cr { - 1,w \gt 50\,\% } \cr } } \right.$
.
${\delta _c} = \left\{ {\matrix{ {1,w \le 50\,\% } \cr { - 1,w \gt 50\,\% } \cr } } \right.$
.
When predicting weight change, we calibrated daily energy expenditure
 $E_t^*$
as
$E_t^*$
as
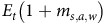 ${E_t}\left( {1 + {m_{s,a,w}}} \right)$
, such that children at low weight percentiles were modelled as less energy efficient, and vice versa. We estimated
${E_t}\left( {1 + {m_{s,a,w}}} \right)$
, such that children at low weight percentiles were modelled as less energy efficient, and vice versa. We estimated
 ${\vartheta _{0,s,w}}$
and
${\vartheta _{0,s,w}}$
and
 ${\vartheta _{1,s,w}}$
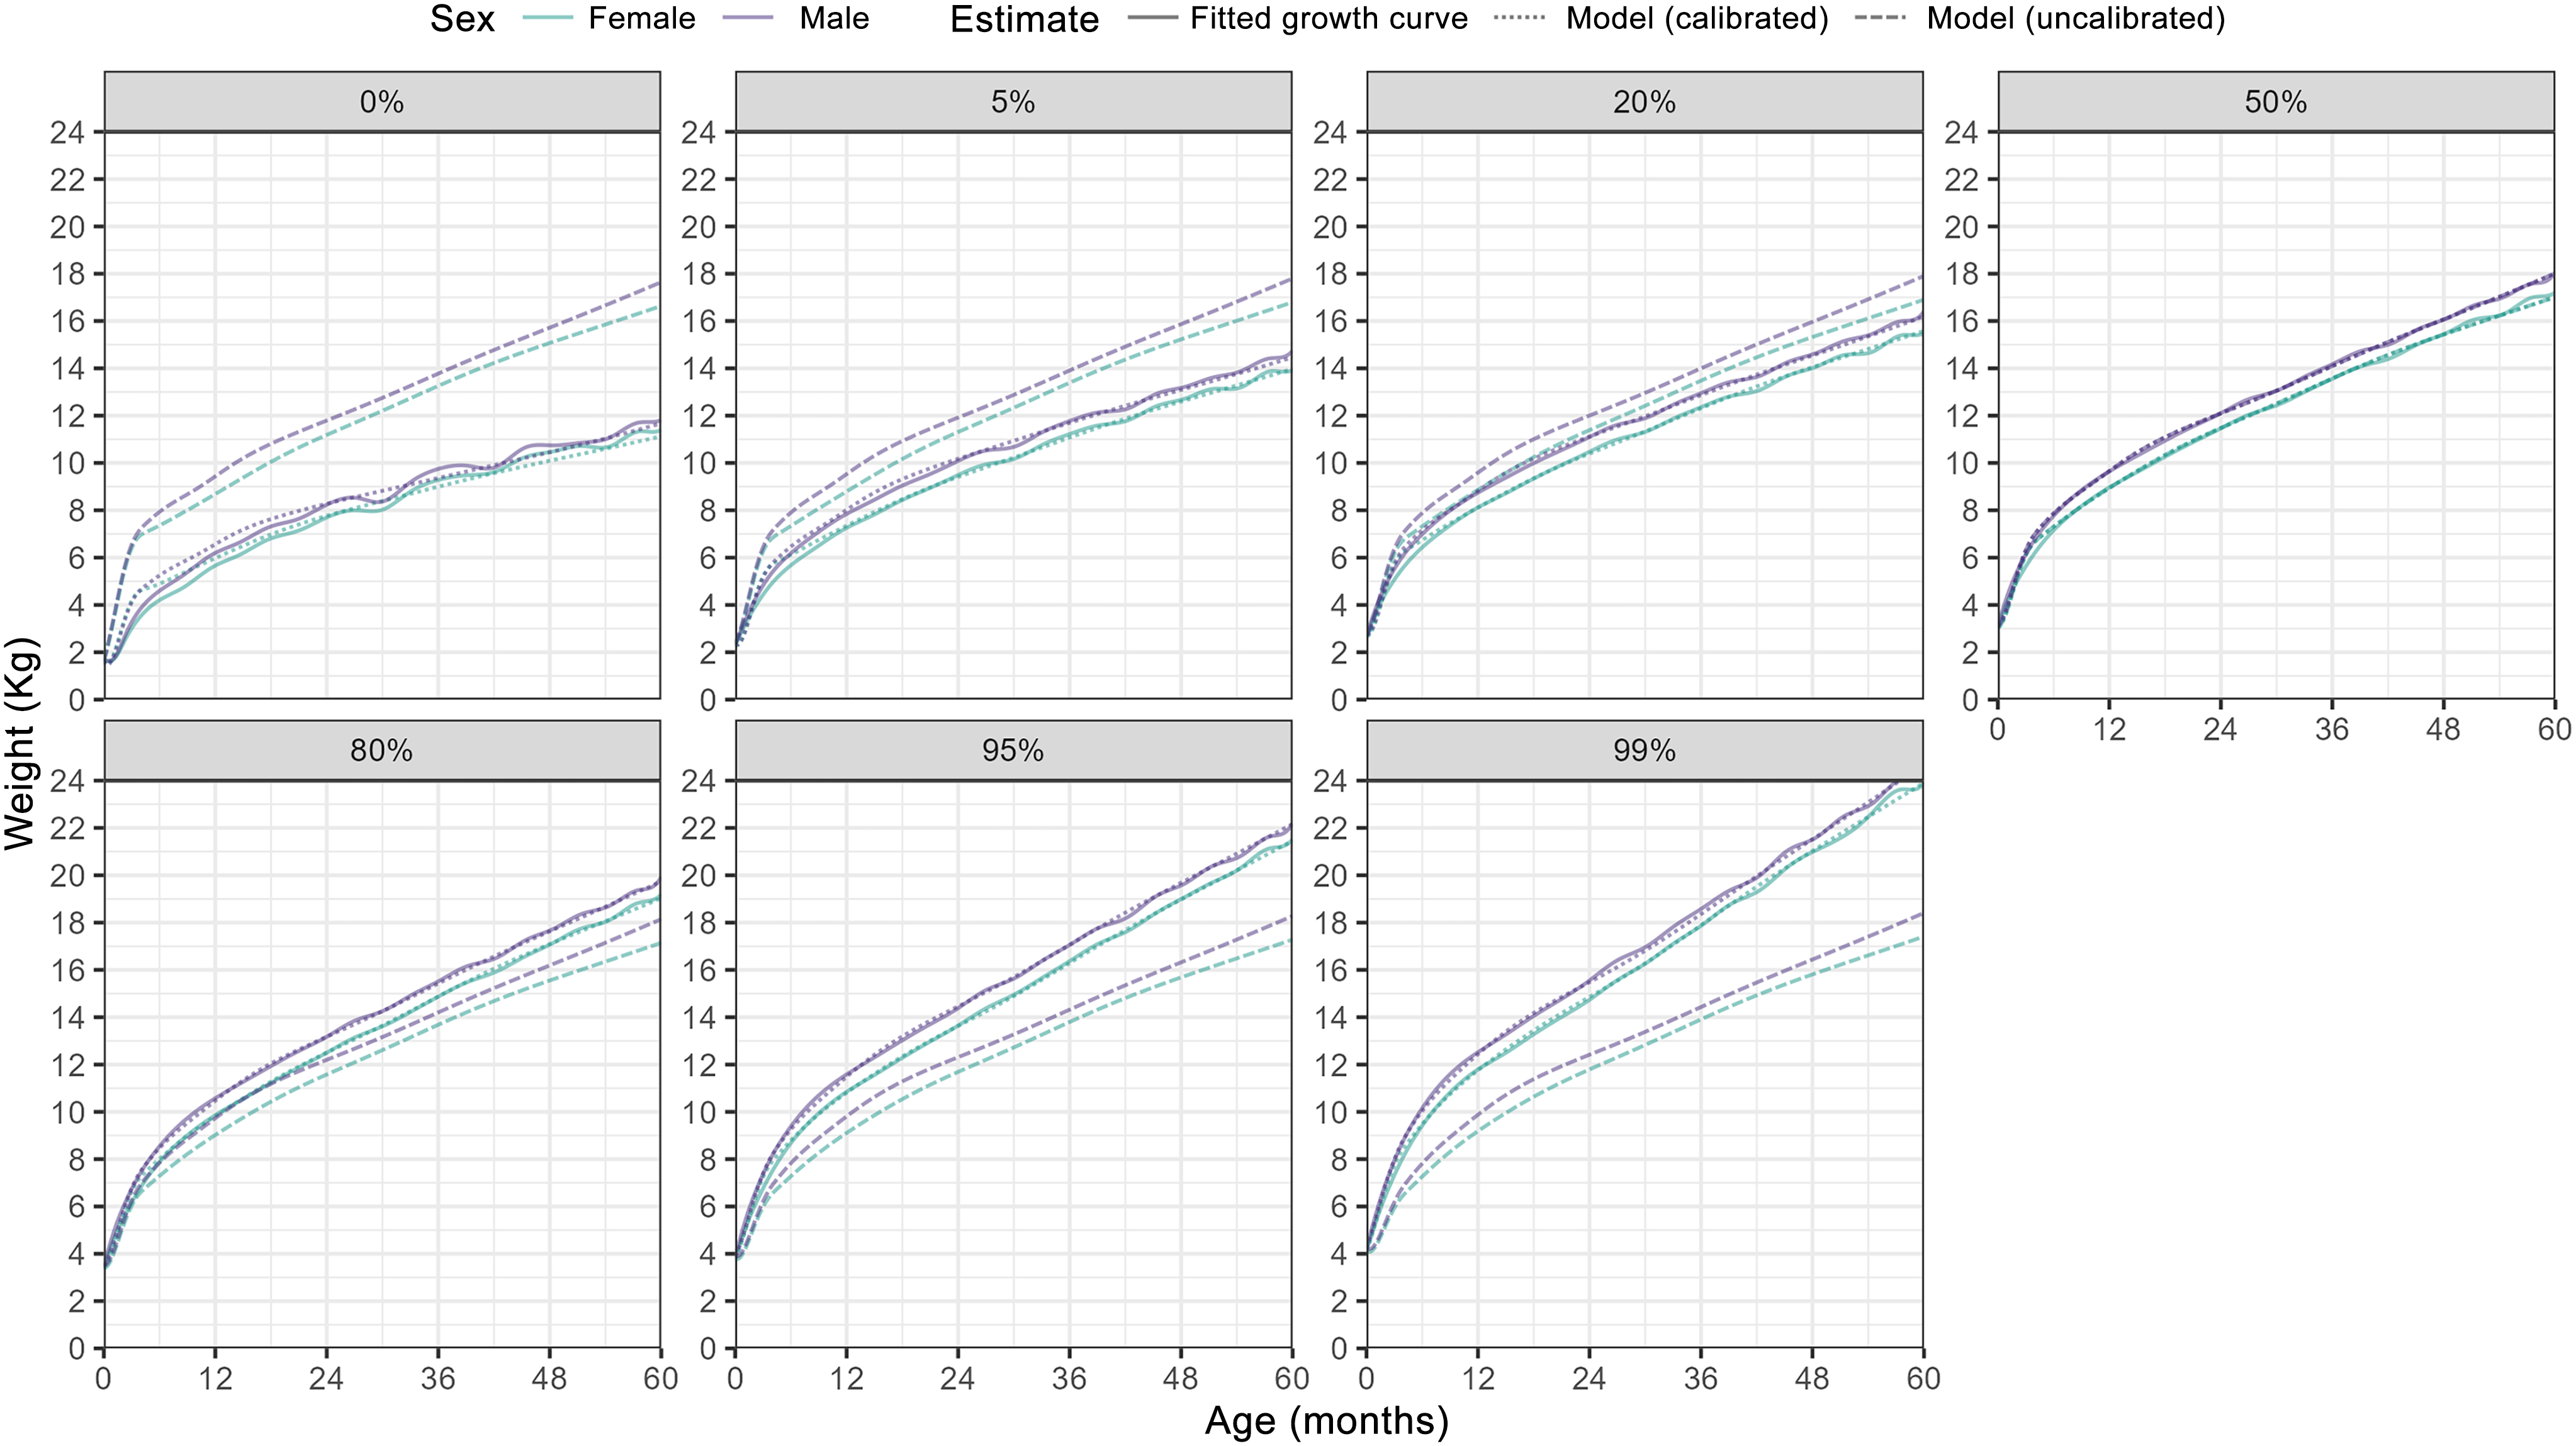
by two-dimensional grid search, minimising the root sum of squares of model-predicted v. global acute malnutrition-fitted weight-for–age curves at each percentile, under each pair of candidate parameter values. Maximum-likelihood values, shown in online Supplementary Figure S9, were then associated with each weight percentile in further model application. As shown in Figure 1 for representative percentiles, the model thusly calibrated closely replicated global acute malnutrition-fitted growth percentiles.
${\vartheta _{1,s,w}}$
by two-dimensional grid search, minimising the root sum of squares of model-predicted v. global acute malnutrition-fitted weight-for–age curves at each percentile, under each pair of candidate parameter values. Maximum-likelihood values, shown in online Supplementary Figure S9, were then associated with each weight percentile in further model application. As shown in Figure 1 for representative percentiles, the model thusly calibrated closely replicated global acute malnutrition-fitted growth percentiles.
Fit of calibrated v. uncalibrated weight model predictions, by age and sex, compared to fitted growth curves, for a selection of weight percentiles.

Other model components
Adult caloric sacrifice
We assumed that, in a situation of scarcity, adults (≥ 20 years old) within each household would sacrifice a proportion of their available food to feed children, as shown in Gaza(1) and elsewhere(Reference Yohannes, Wolka and Bati24,Reference Elolu, Agako and Okello25) . To work out the extent to which this sacrifice would increase children’s intake (as a multiplier adjustment factor
 $f$
), we simulated 1000 households with size randomly sampled from the distribution of pre-war household size in Gaza, comprising of at least one adult and with remaining members’ age and sex allocated randomly based on Gaza’s age–sex distribution, with a Poisson-distributed random number of pregnant and lactating women, based on their population prevalence. We explored how
$f$
), we simulated 1000 households with size randomly sampled from the distribution of pre-war household size in Gaza, comprising of at least one adult and with remaining members’ age and sex allocated randomly based on Gaza’s age–sex distribution, with a Poisson-distributed random number of pregnant and lactating women, based on their population prevalence. We explored how
 $f$
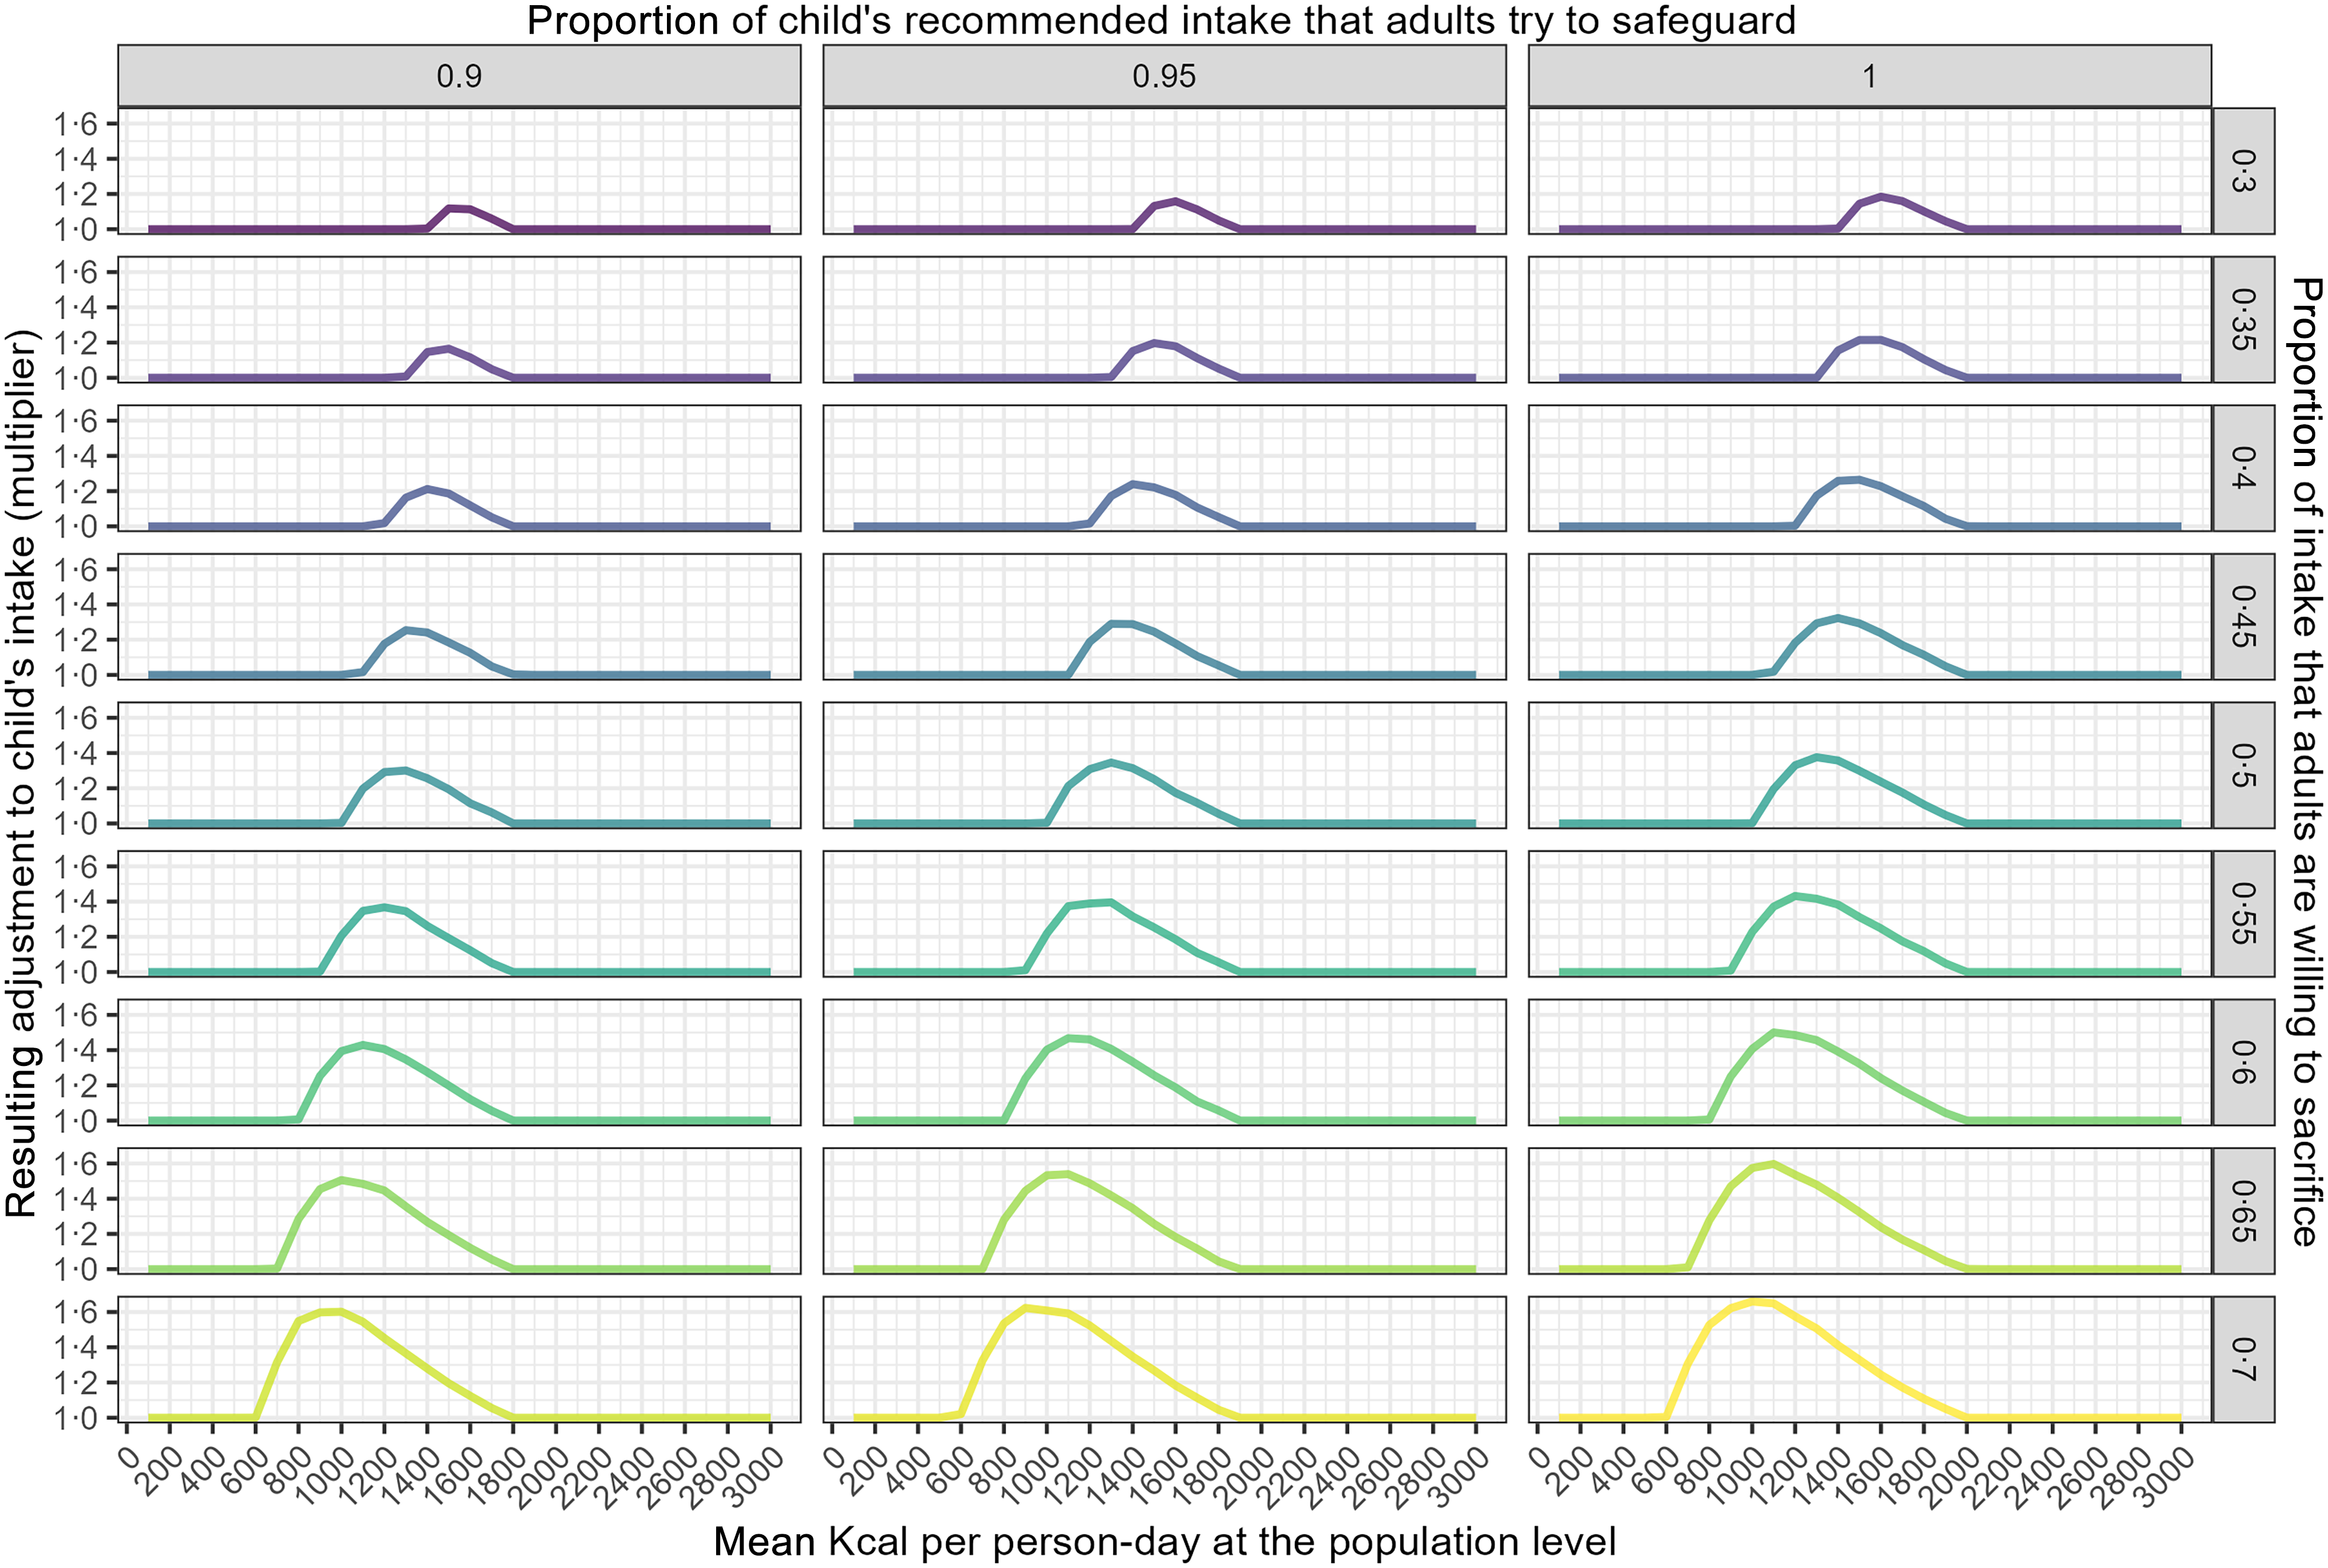
would vary as a function of (i) the proportion of their recommended intake that adults would be willing to sacrifice, (ii) the proportion of children’s recommended intake that adults would try to safeguard and (iii) the mean available per-capita kcal/d. We assumed that food would be distributed equally among households based on their requirement (i.e. the sum of each member’s recommended intake) and that within households food would flow from adults to children until either the former’s sacrifice limit or the latter’s intake target were reached. As shown in Figure 2, a substantial adjustment to children’s intake would only occur when food is scarce yet enough that adults can spare some; below ≈600 kcal/d, adults themselves are unlikely to afford sharing food, as this is already about one fourth of their recommended intake.
$f$
would vary as a function of (i) the proportion of their recommended intake that adults would be willing to sacrifice, (ii) the proportion of children’s recommended intake that adults would try to safeguard and (iii) the mean available per-capita kcal/d. We assumed that food would be distributed equally among households based on their requirement (i.e. the sum of each member’s recommended intake) and that within households food would flow from adults to children until either the former’s sacrifice limit or the latter’s intake target were reached. As shown in Figure 2, a substantial adjustment to children’s intake would only occur when food is scarce yet enough that adults can spare some; below ≈600 kcal/d, adults themselves are unlikely to afford sharing food, as this is already about one fourth of their recommended intake.
Adjustment (multiplier) to child’s daily caloric intake resulting from different levels of mean caloric availability at the population level (x-axis), maximum proportion of adult intake sacrificed (rows) and proportion of children’s recommended intake that adults will try to safeguard (columns).

Effect of infectious disease
We modelled the effect of common endemic infectious diseases as a reduction in daily caloric intake applied over each disease episode’s duration. After a non-systematic key word search of Medline, we identified five cohort studies of children with acute watery diarrhoea(Reference Molla, Molla, Sarker, Chen and Scrimshaw26–Reference Molla, Molla, Sarker, Chen and Scrimshaw29) and one of children with acute respiratory infection (ARI)(Reference Martorell, Yarbrough, Chen and Scrimshaw27), both conditions broadly defined according to WHO syndromic definitions, in which intake was also measured; we averaged these studies’ estimates of the ratio of intake when ill to intake when healthy.
To simulate disease episodes, we adapted Schmidt et al.’s method(Reference Schmidt, Genser and Chalabi30), whereby children are attributed a random annual incidence drawn from a gamma distribution whose shape parameter is the average local incidence and whose scale parameter captures expected heterogeneity. Children are also attributed a random episode duration (in days), itself drawn from a γ distribution but adjusted (i) for observed positive correlation of duration and incidence based on a linear regression coefficient and (ii) for individual variability, based on a random normal deviate. We sourced the scale parameter of incidence, the shape and scale parameters of duration and the regression coefficient of duration by incidence from studies reviewed by the same authors(Reference Schmidt, Genser and Chalabi30).
Because incidence is rarely if ever measured in crisis settings, we worked out its correspondence with more survey-amenable indicators (point prevalence or period prevalence based on caregiver recall of symptoms over the previous 2 weeks) at various levels within a realistic range (online Supplementary Figure S10) by running a simulation of 1000 children over 2 years, with a burn-in period of one year to achieve steady state, in which for different incidence levels we computed corresponding prevalences.
Within the main model cohort, we set a daily point prevalence of ARI and diarrhoea and worked out how many children would newly fall ill to make up this prevalence, after subtracting prevalent cases. We attributed new cases based on individual probabilities equal to zero if children were already ill (this prevented episode overlap) and the ratio of the child’s incidence to the mean incidence otherwise (to reproduce heterogeneity). As mentioned above, prevalence was specified as an excess level (crisis – baseline). The model does not currently accommodate a reduction from pre-crisis levels.
Effect of incomplete breast-feeding
We represented the effect of non-exclusive breast-feeding as an increase in the energy requirement of infants below 6 months, reflecting the lower caloric efficient of formula v. breastmilk; multipliers were taken from the Food and Agriculture Organisation(31) (online Supplementary Figure S11). As above, the excess prevalence of non-exclusive breast-feeding was specified.
Acute malnutrition treatment
While various protocols for SAM and MAM management exist, we simulated the simplified outpatient version with weekly follow-up common in acute emergency responses(32), whereby SAM cases receive 1000 kcal/d (reduced to 500 if they improve to and stay at MAM over 2 consecutive weeks), while MAM cases receive 500 kcal/d, treatment ends for both SAM and MAM if cases maintain a WHZ ≥ –2 over two consecutive weeks. We assumed that children would experience a delay before accessing treatment, sampled from a lognormal distribution with mean 15 d and standard deviation equal to half the mean. We also assumed that children on treatment would continue to consume non-therapeutic food. We ignored additional therapeutic food that may be given in inpatient settings (e.g. specialised milk), as most SAM cases are usually treated on an outpatient basis; we also omitted middle-upper-arm circumference and oedema (an infrequent and geographically clustered presentation of acute malnutrition(Reference Frison, Checchi and Kerac33)) as alternative admission and discharge criteria, since the model cannot estimate these anthropometric indices. Whenever the actual number of children admitted to treatment was known, we calculated the daily mean number of admissions given the cohort size relative to the total population and attributed these among as-yet untreated SAM/MAM cases in the cohort based on a random Poisson process. The model also allows for treatment coverage (proportion) as an input, obviating the need for population data; this option is implemented as a random binomial probability. For simplicity, we assumed 100 % adherence to the treatment protocol and no defaulting.
Crisis-specific data sources
Recommended and actual caloric intake
Recommended intake by age–sex, with additions for pregnant and lactating women, was sourced from WHO guidelines(34). Hall et al.,(Reference Hall, Butte and Swinburn16) however, offer an analytic solution for the recommended intake by age–sex, given an expected age- and sex-dependent FM to FFM ratio among healthy children. We applied this solution to compute recommended intakes among children 0–10 years old (online Supplementary Figure S7) and used them in lieu of WHO’s. Among girls and boys aged 0–4 years old, a mean 1117 and 1284 kcal-day were predicted by Hall et al. compared with 1250 and 1320 recommended by WHO, with corresponding figures among 5–9 years old being 1629 and 1725 v. 1730 and 1980.
We estimated pre-war actual intake per capita by doing a grid search over a range of candidate values of the ratio of actual to recommended mean caloric intake and finding the value of this ratio (and thus the actual intake) that minimised the root mean square error of weight model predictions, compared with the median WAZ growth curve. While the estimated actual mean intake was only 2 % less than the recommended value (online Supplementary Figure S12), this small adjustment graphically improved model fit to the median pre-war growth curves (online Supplementary Figure S13). Intake during the war is estimated in a separate paper(Reference Checchi, Ververs and Jamaluddine11) and introduced here as an empirical distribution of 1000 simulation run outputs per day for both northern and south-central Gaza, from which we sample over the retrospective analysis period.
Other factors
We sourced the number of MAM and SAM treatment admissions from a Nutrition Cluster dashboard(35): these are available from January 2024, prior to which we assume that no MAM/SAM treatment was occurring. ARI and diarrhoea two-week period prevalences were estimated by the Multiple Indicator Cluster Survey before the war(36); during the war, rapid surveys(37–39) also estimated this indicator intermittently(40) but with a simpler questionnaire compared to Multiple Indicator Cluster Survey, so we crudely assumed that only half of cases identified were indeed ARI and acute diarrhoea (i.e. 50 % positive and 100 % negative predictive values). Further disease assumptions are in online Supplementary Tables S1–S2. The Multiple Indicator Cluster Survey estimated a 58 % prevalence of complete or partial formula feeding among infants < 6 months, which we assumed to have risen to 70 % by 1 February 2024 in line with observed deteriorations in exclusive breast-feeding across crises in the Middle East(Reference Diwakar, Malcolm and Naufal41–44). We assumed that adults would seek to safeguard 100 % of children’s caloric requirement and sacrifice up to 80 % of theirs on any given day. Lastly, we sourced population estimates by region from the Palestinian Central Bureau of Statistics(45), the Food Security Cluster(46), the United Nations Office for Coordination of Humanitarian Affairs, United Nations Office for Coordination of Humanitarian Affairs(47) and UNRWA(48) and interpolated these linearly to fill in periods of missingness.
Scenario assumptions and implementation
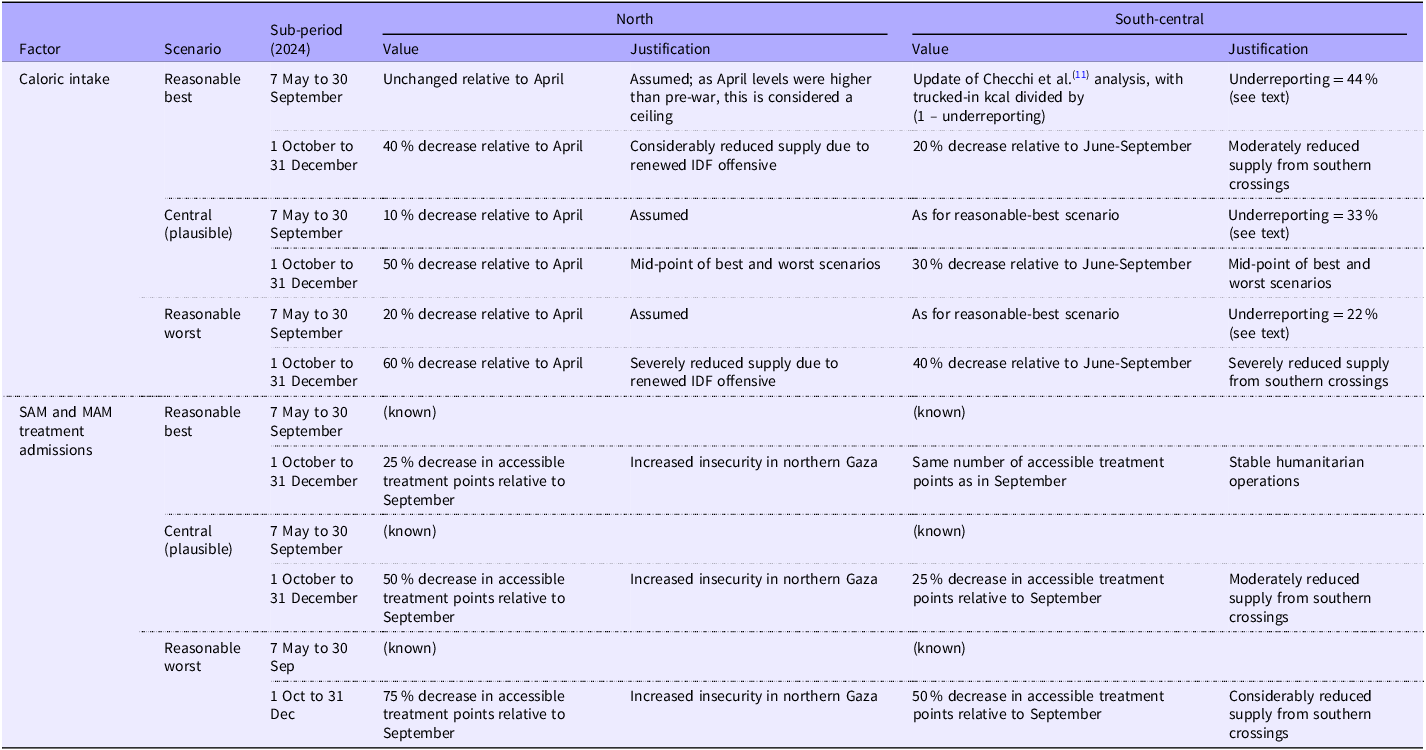
Table 1 details values and assumptions for central (most plausible), reasonable-best and reasonable-worst scenarios. For simplicity, we assumed that during the projection period (May to December 2024) only intake (online Supplementary Figure S14) and malnutrition treatment would vary by scenario, with ARI and diarrhoea prevalence as observed in the previous season (online Supplementary Tables S1–S2) and all other factors at their April 2024 level.
Scenarios for projection, by factor, sub-period and region of Gaza

IDF, Israeli Defence Force; SAM, severe acute malnutrition; MAM, moderate acute malnutrition.
We had actual MAM/SAM treatment admissions up to 30 September 2024(35). Thereafter, we crudely calculated total treatment capacity as the number of functional outpatient and inpatient MAM/SAM treatment points(35) times up to five MAM and five SAM admissions/d, reducing this total by a certain percentage for each scenario.
From 7 May onward, UNRWA was unable to comprehensively monitor food truckloads into Gaza, particularly those from the commercial sector, and appeared to capture only truckloads into south-central governorates: accordingly, for the south-central region, we updated our published caloric availability estimates up to 30 September, but upward-adjusted trucked-in amounts from 7 May by assuming underreporting fractions corresponding in the reasonable-best scenario to the proportion of food coming from commercial sources during May–September 2024, namely 44 % as reported by United Nations Office for Coordination of Humanitarian Affairs(49), and in the reasonable-worst scenario to half that level, closer to the proportion of commercial deliveries before May. For northern Gaza, we assumed a level of caloric intake relative to April 2024. From early October, Israel intensified attacks on northern Gaza, halting civilian supplies(50): this suggested a qualitatively different trajectory for this sub-period and region (Table 1).
We implemented 1000 runs of the model: during each run, a cohort of 1000 children is simulated, and the following sources of uncertainty are propagated through to the results: variability in the modelled correlation between weight and height percentiles; heterogeneity in individual incidence and duration of ARI and diarrhoea, given a population average; the child’s probability of being exclusively breastfed; the probability of being treated if affected by SAM or MAM; the delay between onset of SAM or MAM and accessing treatment for either and the estimated empirical distribution of caloric availability during the retrospective period.
The following parameters, on the other hand, are modelled deterministically, i.e. without any uncertainty propagation: baseline weight and height by age as a function of the child’s corresponding growth percentiles (as noted above, this should not result in unrealistically low variability); recommended caloric intake, given age and sex; relationship between energy balance and weight change (i.e. the Hall et al.(Reference Hall, Butte and Swinburn16) set of equations and source parameters); the calibration factor
 ${m_{s,a,w}}$
; the relationship between adult sacrifice, target intake to be safeguarded and caloric availability, on the one hand, and adjustment factor
${m_{s,a,w}}$
; the relationship between adult sacrifice, target intake to be safeguarded and caloric availability, on the one hand, and adjustment factor
 $f$
for children’s intake; the ratio of intake when ill with diarrhoea or ARI, to intake when healthy; the effect of incomplete breast-feeding; the effect of SAM/MAM treatment.
$f$
for children’s intake; the ratio of intake when ill with diarrhoea or ARI, to intake when healthy; the effect of incomplete breast-feeding; the effect of SAM/MAM treatment.
Results
Model testing
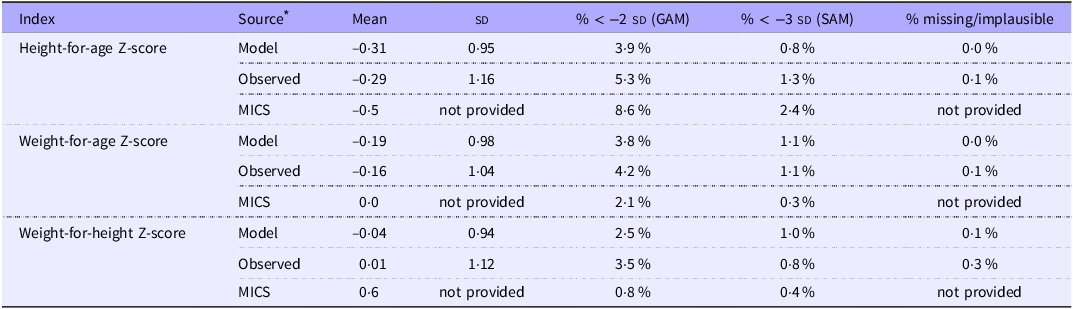
Table 2 and online Supplementary Figure S15 compare the model’s simulated pre-war distributions of height-for-age, WAZ and WHZ to those obtained from the UNRWA growth monitoring dataset and the 2019–2020 Multiple Indicator Cluster Survey, indicating reasonable concordance, albeit with a lower modelled-than-observed variance. Online Supplementary Figure S16 compares the model to a pre-war survey done among children < 2 years old by Albelbeisi et al.(Reference Albelbeisi, Zinszer and El Bilbeisi51).
Model-Predicted v. observed (growth monitoring) pre-war anthropometry, by index and source

SAM, severe and moderate acute malnutrition.
* Model: 20 000 simulated children. Observed: 260 895 growth monitoring observations during 2019–2023 (one per child, selected randomly). Multiple Indicator Cluster Survey (MICS): 2534 children measured cross-sectionally in 2019.
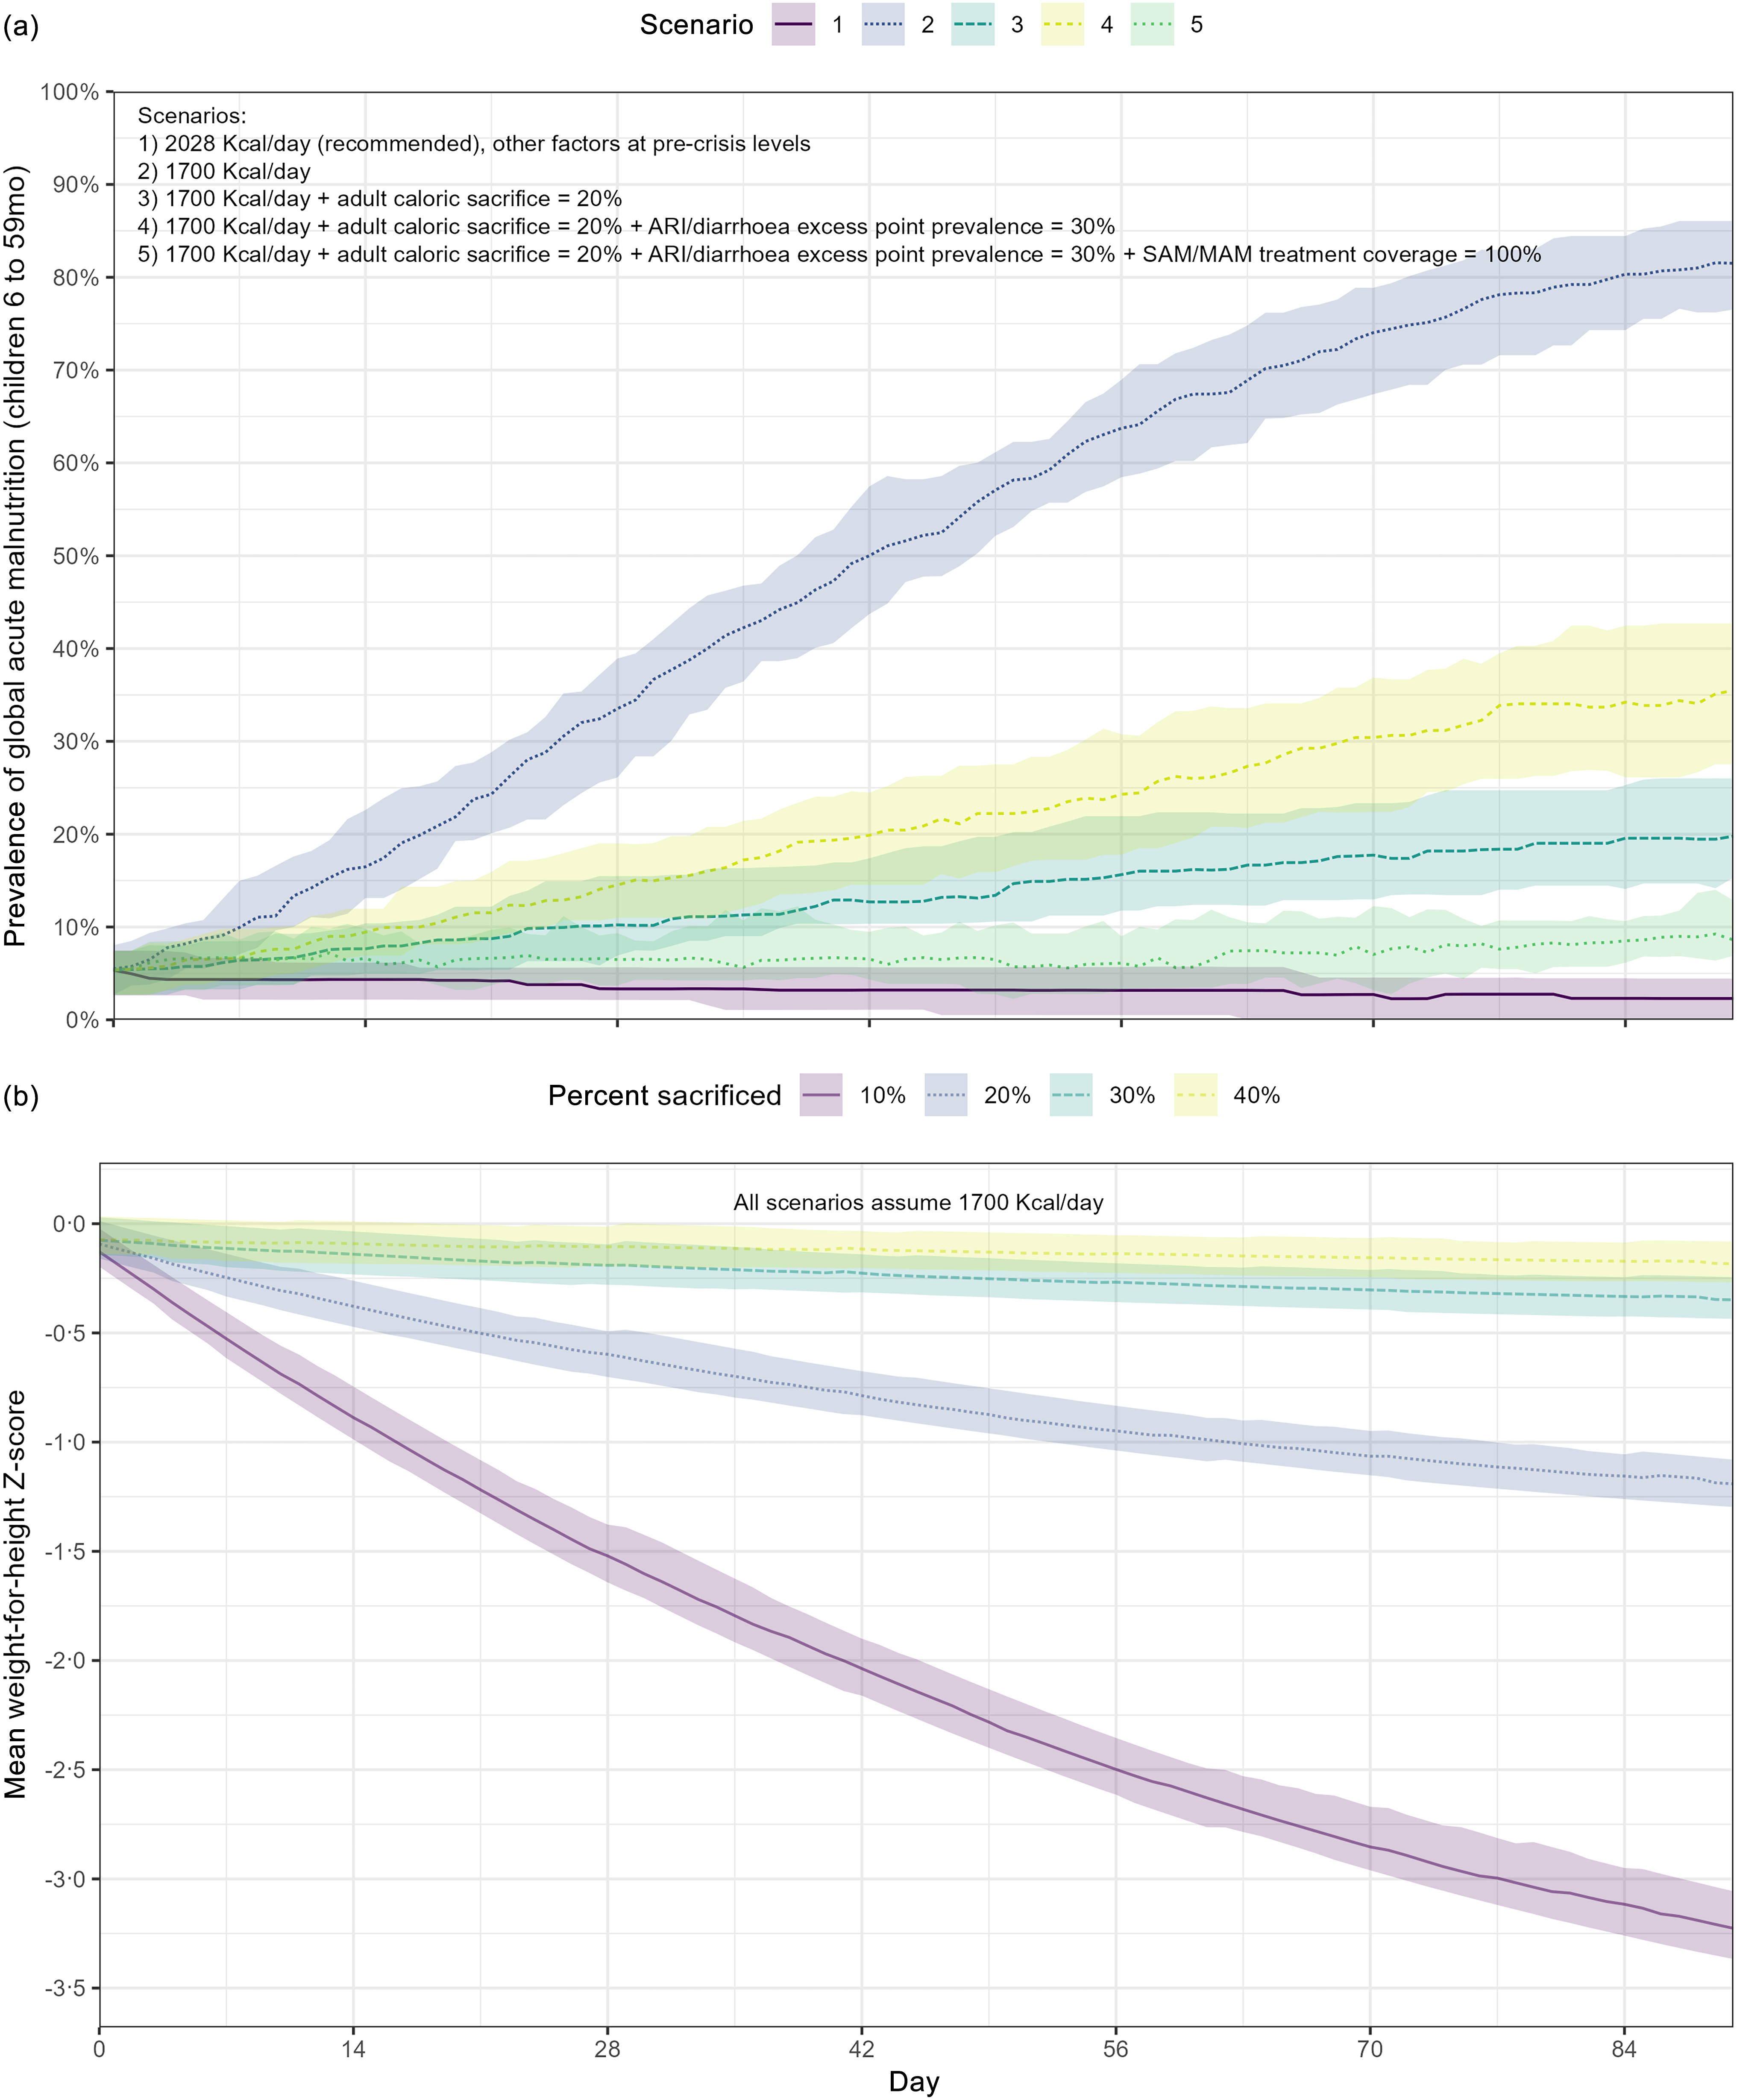
As shown in Figure 3(a), the model exhibits the expected behaviour as hypothetical scenarios progress from caloric requirements being exactly met (stable GAM prevalence) to unmitigated caloric insufficiency (steep increase), insufficiency with adult sacrifice, excess infectious disease and finally partial treatment coverage. Figure 3(b) illustrates the strong influence of adult caloric sacrifice in model dynamics (see Discussion).
(a) Modelled evolution of GAM prevalence under different scenarios. (b) Modelled evolution of mean WHZ under different values of adult caloric sacrifice, assuming mean intake 1700 kcal/d and pre-crisis levels of all other factors. All scenarios comprise 20 simulated cohorts (runs) of 100 children and assume the same demographic characteristics as pre-war Gaza. Shaded areas denote 95 % percentile intervals. GAM, global acute malnutrition; WHZ, weight for height Z-score.

Crisis estimates
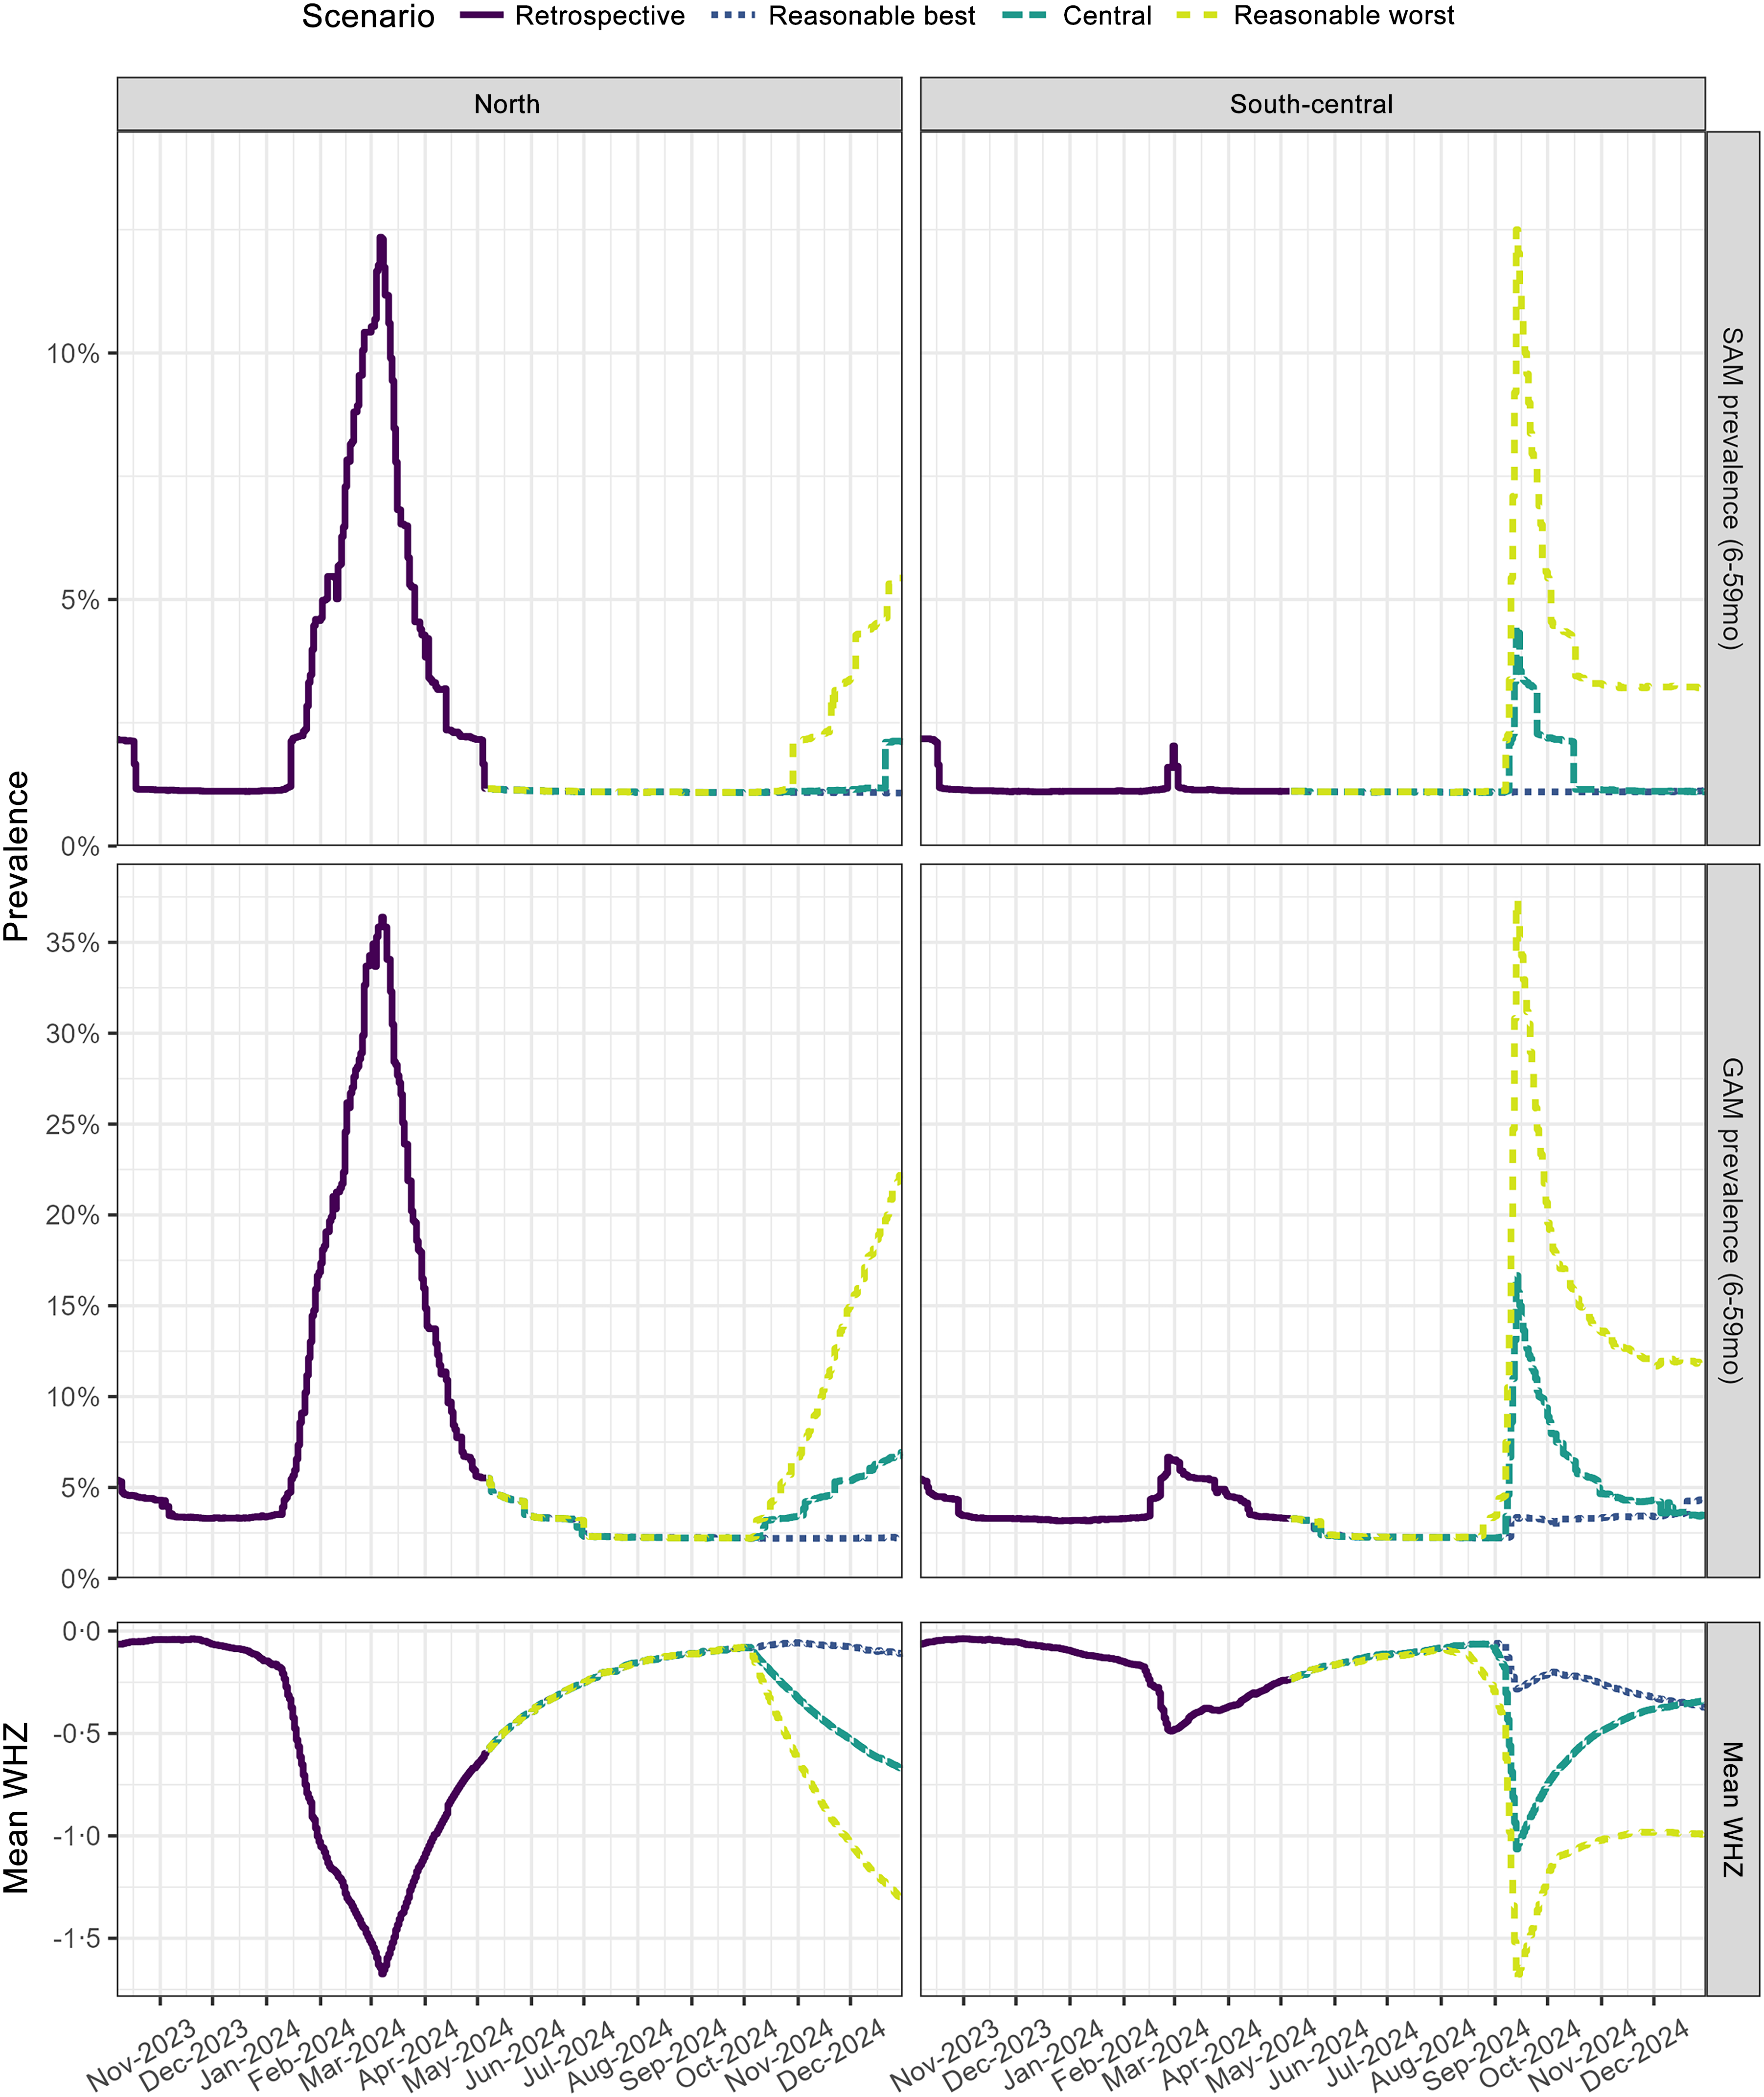
As shown in online Supplementary Figure S17, the model generally yielded wide uncertainty intervals, especially for the retrospective period, during which uncertainty in food intake is propagated from our prior analysis. For easier readability, Figure 4 only reports point estimates. We estimated that acute malnutrition peaked around March 2024 in northern Gaza, with GAM prevalence considerably increased from its ≈ 4 % pre-war modelled level (Table 2). Under the reasonable worst-case scenario, we projected that GAM and SAM prevalence would reach serious levels in both regions by December 2024, with a relatively higher increase in northern Gaza.
Retrospective estimates and scenario projections of SAM and GAM prevalence (children 6–59 months), GAM prevalence (6–23 months) and mean WHZ (6–59 months), by region and scenario, after simulating 100 cohorts of 100 children each. GAM, global acute malnutrition; SAM, severe acute malnutrition; WHZ, weight for height Z-score.

Discussion
Main findings
To our knowledge, this is the first instance of a mechanistic model that estimates expected acute malnutrition burden on the basis of caloric intake while accounting for obvious modulating factors. As such, our paper should mainly be viewed as introducing the model and reporting on its first application in a real-life crisis, thereby showcasing its current potential and limitations (see below).
The model accurately predicts the median WHO growth standard if parameterised with recommended caloric intake and, calibrated to pre-war data, reproduces expected distributions of anthropometric indices, albeit with a possible, small underestimation of variance and thus SAM/GAM prevalence. It suggests a strong role for adult caloric sacrifice as a coping strategy during periods of food scarcity. Some 95 % of households in Rafah governorate employed food security coping strategies with caretakers often skipping meals to feed their children(39).
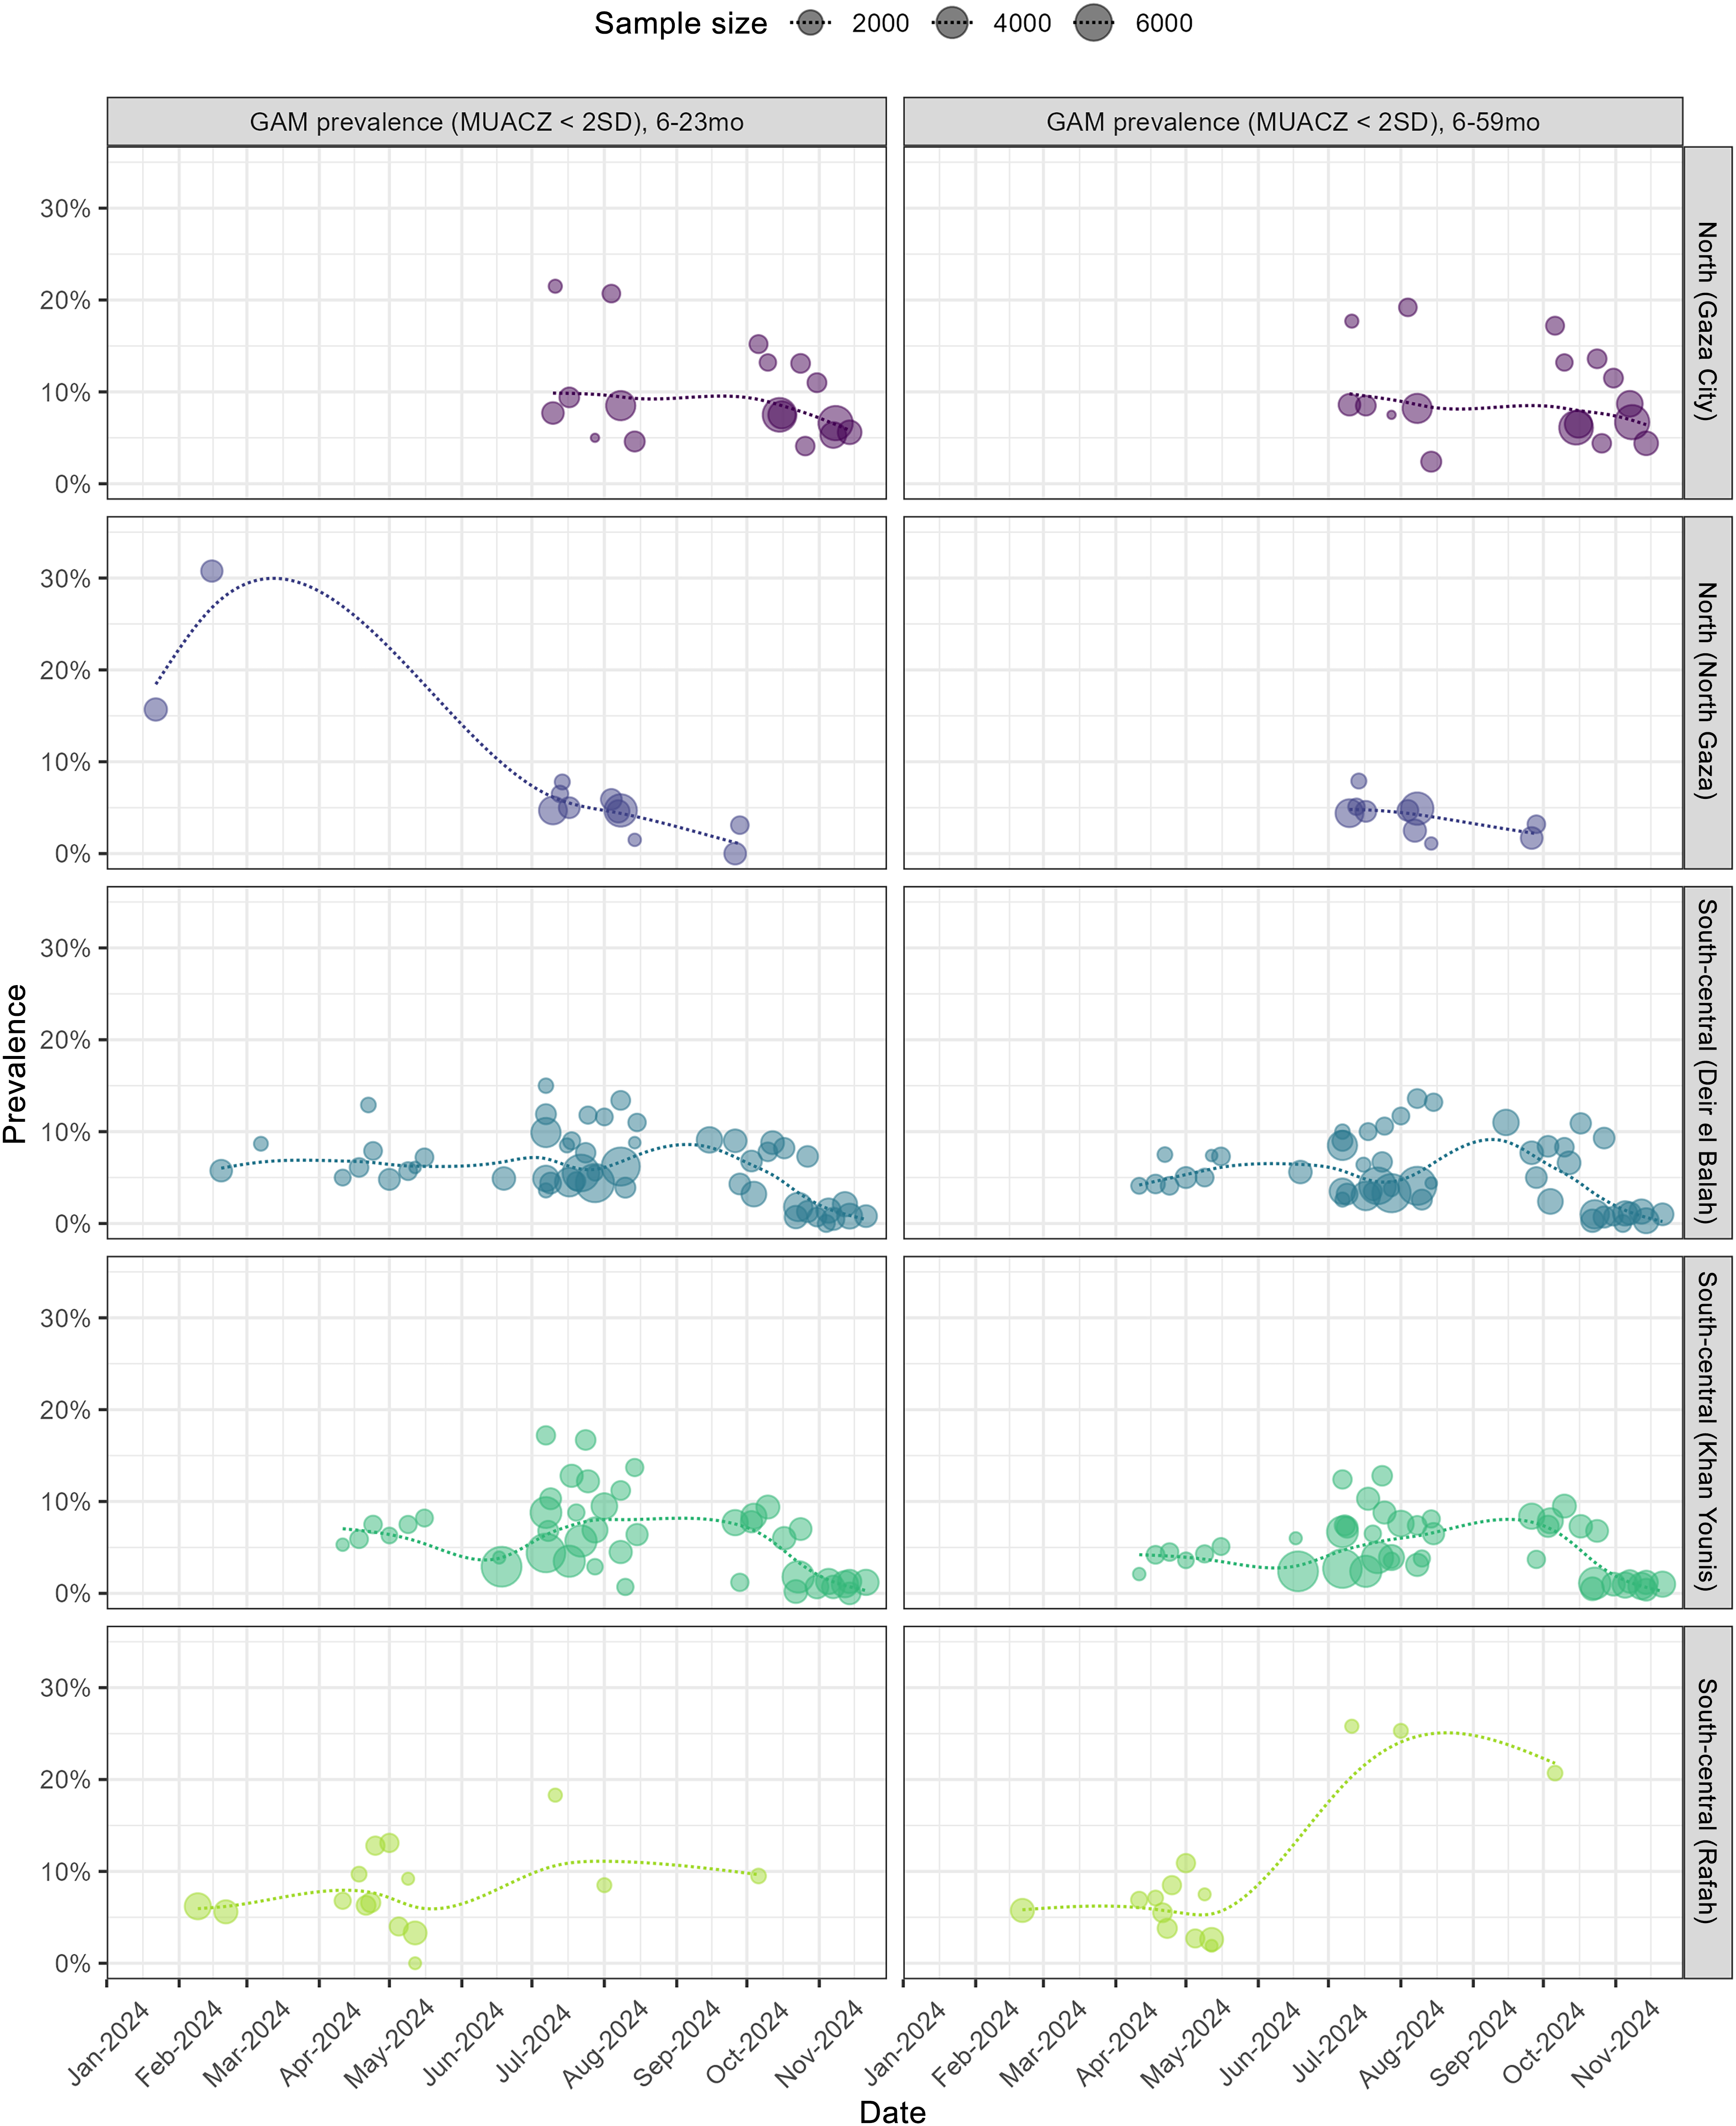
The model suggests that in northern Gaza, food scarcity during January–March 2024 caused a rapid increase in acute malnutrition, reversed by May likely thanks to improved food availability(Reference Checchi, Ververs and Jamaluddine11). These retrospective estimates for Gaza seem broadly in line with available ground data (Figure 5), but the latter are not a suitable dataset for validation as they do not arise from representative sample surveys and rely on middle-upper-arm circumference-based measurement; moreover, ground data from northern Gaza during the first half of 2024 are particularly scant. Retrospective model estimates also feature wide uncertainty. Scenario projections suggest that, in both northern and south-central governorates, a substantial decline in food availability (unlike at the war’s outset, not mitigated by pre-existing stores(Reference Checchi, Ververs and Jamaluddine11)) could result in a serious nutritional emergency.
Point estimates of GAM prevalence (based on MUAC Z-score < 2 sd) from ground screenings, by age group (some screenings targeted children 6–23 months only). Each data point is centred at the mid-point of the data collection period (usually spanning 2–3 weeks) and its size is a function of the number of children screened. To better visualise trends, we fitted a smooth spline, weighted by number screened, to periods covered by data. GAM, global acute malnutrition; MUAC, middle-upper arm circumference.

Limitations
In addition to being computationally intensive, the model has several limitations, of which the most important are emphasised here. Upstream, the model ignores food waste and access inequity, which would plausibly result in greater heterogeneity in acute malnutrition, i.e. pockets of high GAM prevalence; adult caloric sacrifice is modelled statically, but may in fact be a function of how long adults have already been depriving themselves and/or of children’s nutritional status at the time; adding a sub-model of adult weight(Reference Hall, Sacks and Chandramohan52) while tracking its evolution through primary data would help improve this model component and result in a more dynamic, less threshold-dependent relationship between intake and malnutrition prevalence. The model’s calibration to represent inter-individual variability may not successfully replicate growth curves outside Gaza and is unlikely to be biologically plausible, though its performance can be tested on new growth monitoring data.
Our treatment of risk factors is incomplete. We only feature half of the known vicious cycle of infection and malnutrition (infection leading to malnutrition, but not the reverse), omit epidemic and other endemic infections and the energy cost of infection through symptoms such as fever. We also ignore the higher risk of infection (especially diarrhoea) among formula-fed v. breastfed infants, e.g. due to contaminated water or bottles and the increased frequency of low birth weight, thereby probably under-estimating infant malnutrition. Overall, these omissions would result in under-estimating GAM and SAM prevalence. Lastly, in a protracted crisis, our model would eventually deviate from reality because it does not predict changes in height, i.e. stunting.
The specification of model inputs for Gaza also suffers from considerable uncertainty. We made strong assumptions about caloric intake since May 2024, the extent of adult caloric sacrifice and other factors such as ARI and diarrhoea prevalence, observed values of which may have suffered from some misclassification. The retrospective analysis is at least not grossly inconsistent with ground-observed malnutrition prevalence, but the latter is based on MUAC measurements, which typically deviate considerably from prevalence based on WHZ, as yielded by our model. Therefore, empirical data should not be considered a basis for inferring model validity in this case. More cautiously, we can conclude that our model, if populated with reasonable inputs, can reconstruct a plausible trajectory of nutritional status in Gaza.
Conclusions
An accurate model to project malnutrition in humanitarian responses on the basis of various input data, available or assumed, would complement nutritional surveillance based on primary data collection and could considerably enhance situational awareness by enabling near-real-time estimation including for populations that are hard to access and thus survey. In Sudan, we are currently adapting the model to generate projections for besieged areas where food is scarce and anthropometric surveys unfeasible. The model could also complement global information systems such as the Integrated Phase Classification by providing an alternative quantification of GAM and SAM prevalence when ground measurements are unavailable, thereby supplying the Integrated Phase Classification with one of the key metrics used to classify levels of food insecurity and malnutrition.
Additionally, the model’s forward projections can potentially support decision-making by exploring the consequences of worsening food security, hostile actions such as obstruction of food delivery and humanitarian interventions to improve food access and support child nutrition. Projections can also support planning, e.g. by quantifying the expected incidence of SAM and MAM requiring treatment.
While the model presented here appears to accurately replicate both the WHO growth standards and pre-war anthropometry in Gaza, further validation of its predictions against primary data from other settings is warranted. Further model development should, at a minimum, seek to represent food inequity and a more dynamic relationship between scarcity and caloric sacrifice than featured so far; account for the synergy between infection and malnutrition and better specify neonatal and infancy factors including low birth weight and incomplete breast-feeding. Parameter values (e.g. effect of infectious disease on intake) should be informed by more thorough literature review. Data on the evolution of adult weight during the crisis could, in particular, help to validate the adult sacrifice sub-model.
As regards Gaza, the model suggests that past periods of food scarcity resulted in sizeable increased in malnutrition prevalence. Scenario projections indicate that, during the last quarter of 2024, the population was on the brink of a serious nutritional emergency, with the balance between moderate and severe deteriorations in nutrition potentially resting on small differences in caloric availability and adults’ ability to deprive themselves so as to feed children. These estimates, combined with the Integrated Phase Classification’s own classification of famine in 2025, may also help to illuminate patterns in Israel’s conduct of the war and provide an evidentiary basis for war crimes prosecutions.
Supplementary material
For supplementary material/s referred to in this article, please visit https://doi.org/10.1017/S0007114525105564
Acknowledgements
We are grateful to UNRWA for sharing growth monitoring data and to Mija-Tesse Ververs (Center for Humanitarian Health, Johns Hopkins University) for technical advice.
This research was conducted with the support of the UK Humanitarian Innovation Hub (UKHIH) and its donor, the UK Foreign, Commonwealth & Development Office (FCDO). The funders had no role in the design, analysis or writing of this article.
F. C.: Conceptualisation, data curation, formal analysis, funding acquisition, methodology, software and writing – original draft. Z. J.: Conceptualisation, data curation, methodology, resources, supervision and writing – review and editing.
The authors declare no conflicts of interest.
Data and code for implementation in R(17) are publicly available on https://github.com/francescochecchi/nut_cal_model_gaza
The study was approved by the Ethics Committee of the London School of Hygiene and Tropical Medicine (ref. 29926).https://github.com/francescochecchi/nut_cal_model_gaza


 Open access