

Introduction
Sea cucumber fisheries for the dry product or trepang have a long history, as the Chinese have sought them for a thousand years or more in India, Indonesia, and the Philippines (Conand, Reference Conand1986, Reference Conand1989, Reference Conand1990). During the eighteenth and nineteenth centuries, traders gathered them from a large area, as illustrated in a lithograph by LeBreton in 1839 from the Durville expedition, that shows a processing plant with boiling and smoking equipment in Northern Australia (Conand and Byrne, Reference Conand and Byrne1993). The Japanese and Koreans also enjoy sea cucumbers, either raw or prepared with minimal cooking. Choe (Reference Choe1963) conducted a comprehensive investigation of Stichopus japonicus, the primary commercial sea cucumber species in Japan. This study not only explored the species’ morphological characteristics and biological and ecological parameters but also offered a detailed analysis of various initiatives aimed at sustaining and enhancing its population.
By the end of the nineteenth century, holothurian fishing for trepang production had been described in various regions: Semper (Reference Semper1868) and Seale (Reference Seale1911) described this activity in the Philippines, Saville-Kent (Reference Saville-Kent1893) on the Australian Great Barrier Reef, Koningsberger (Reference Koningsberger1904) in the Dutch East Indies (Indonesia), and Hornhell (Reference Hornhell1917) in India. In the ‘Industria del Trepang’, Sella and Sella (Reference Sella and Sella1940) presented the statistics for the main markets, described the fishing grounds of Eastern Africa and recorded attempts to produce an ‘Italian’ trepang using Mediterranean species. Panning (Reference Panning1944) described the industry and the species exploited in Die Trepang Fischerei.
More recently, the fishing activities from 1978 to 1983 in the tropical Indo-Pacific region have expanded from 10 860 tonnes (t) fresh weight to 14 450 t fresh weight, with the Central Pacific region and Hong Kong markets playing a pivotal role (Conand, Reference Conand1989, Reference Conand2006).
International interest has progressively grown and fuelled research at regional and global scales. Studies at a global scale have been presented and published from International Conferences and Food and Agriculture Organization (FAO) symposium publications (Conand, Reference Conand, L and Canicatti1992, Reference Conand1997, Reference Conand, In Carpenter and Niem1998, Reference Conand and Barker2001, Reference Conand2017; FAO, 2004, 2008, 2013; Bruckner, Reference Bruckner2006; Purcell et al., Reference Purcell, Samyn and Conand2012, Reference Purcell, Lovatelli, González-Wangüemert, Solís-Marín, Samyn and Conand2023; Conand et al., Reference Conand, Desurmont, Eeckhaut and In Mercier2024a, Reference Conand, Purcell, Hamel, Mercier, Di Simone, Horellou, Friedman and Lovatelli2024b).
At a regional scale, the main publications include Conand and Muthiga (Reference Conand and Muthiga2007, Reference Conand and Muthiga2010); FAO (2008, 2013, 2023); González-Wangüemert et al (Reference González-Wangüemert, Conand, Uthicke, Borrero-Pérez, Erzini and Serrao2011); Muthiga and Conand (Reference Muthiga and Conand2014); Purcell (Reference Purcell2014); Eriksson et al. (Reference Eriksson, Österblom, Crona, Troell, Neil, Wilen and Folke2015b); Conand (Reference Conand2017); Conand et al. (Reference Conand, Claereboudt, Dissayanake, Fernando, Godvinden, Lavitra, Leopold, Mmbaga, Mulochau, Naaem, Shea, Vaitilingon, D and Friedman2022a); and Mercier et al. (Reference Mercier, Penney, Ma, Lovatelli and Hamel2023).
The recent book of major interest The World of Sea Cucumbers (Mercier et al., Reference Mercier, Hamel, Suhrbier and Pearce2024) covers, in 51 chapters and with inputs from over 100 experts, sea cucumber biology, ecology, fisheries, aquaculture, and trade, while also bringing forward novel cultural, socioeconomic, and scientific topics related to commercial and noncommercial species worldwide. The chapters covering northern European, Mediterranean, North American, and Mexican fisheries clearly show that sea cucumber fisheries are now occurring globally. A very recent paper by Mercier et al (Reference Mercier, Purcell, Montgomery, Kinch, Byrne and Hamel2025) ‘emphasizes that the plight of sea cucumbers is urgent, now echoing across the globe, while paradoxically still not being fully heard’. The authors conclude on the need for action, giving with nine very useful recommendations.
A significant amount of literature also exists on key individual species, such as Holothuria scabra (Hamel et al., Reference Hamel, Conand, Pawson and Mercier2001, Reference Hamel, Eeckhaut, Conand, Sun, Caulier and Mercier2022), Apostichopus japonicus (Liu Jinxian, Reference Mercier2015; Yang et al., Reference Yang, J-F and Mercier2015), and the dendrochirotid Cucumaria frondosa (Gianasi et al., Reference Gianasi, Hamel, Montgomery, Sun and Mercier2020; Dvoretsky and Dvoretsky, Reference Dvoretsky and Dvoretsky2021; Mercier et al., Reference Mercier, Penney, Ma, Lovatelli and Hamel2023). At a local, country scale, many contributions are published in the yearly SPC Bêche-de-mer Bulletins (https://www.spc.int/fame/en/fame-digital-library).
The present paper presents three geographical scales: (1) the world scale following previous studies (Conand and Sloan, Reference Conand, Sloan and Caddy1989; Conand and Byrne, Reference Conand and Byrne1993; Conand, Reference Conand and Baine1999, Reference Conand, Lovatelli, Conand, Purcell, J.-F and Mercier2004, Reference Conand2017; Conand et al., Reference Conand, Lovatelli, Shea and Wolfe2022b); (2) the scale of different marine regions (or fishing areas), which correspond to the ecology of the resource species; and (3) the country level, which corresponds to socio-economy and politics for management; both Canada and the USA have fisheries in two different fishing areas of Atlantic and Pacific (Mercier et al., Reference Mercier, Hamel, Suhrbier and Pearce2024; Mercier and Juinio-Meñez, Reference Mercier and Juinio-Meñez2025).
The importance of Hong Kong has long been cited for the market of sea cucumbers (Sella and Sella, Reference Sella and Sella1940; Conand, Reference Conand1993, Reference Conand and Baine1999; Jaquemet and Conand, Reference Jaquemet and Conand1999; To and Shea, Reference To and Shea2012; Conand et al., Reference Conand, Shea and To2014; To et al., Reference To, Shea and Conand2018). The very recent paper by Purcell et al. (Reference Purcell, Shea and Gray2025) analyses the changes in the value of dried sea cucumbers. It remains a very important hub in sea cucumber trade, with nowadays different categories of products.
The paper gives an update for the last decade on the holothurian fisheries and trade at global, regions and main countries level and on the importance of the recent Hong Kong holothurian market.
Material and methods
The data used to analyse the characteristics of fisheries in different areas for the decade 2013–2022 come from the FAO yearly statistics on capture fisheries, in fresh weight (FAO, 2024a). These data allow to present the sum of the captures for each FAO major fishing area; their sum for the decade gives a rank for each region and allows a global view for the decade. For each region, the number of countries involved is also presented. Then the captures have been ranked by country and the countries with captures over 10 000 t for the period, presented as most significant.
FAO statistics, concerning the trade, globally and by country have been recently detailed for five categories or commodities, and used for 2019–2021 (FAO, 2024b). They allow to present the global imports and exports, by quantity and by value, for each category, dried, fresh, frozen, prepared, and other. For each year, the detailed data, their sum and their rank are presented by main countries. A synthesis has been prepared to show the main characteristics for the different marine regions and the problems encountered during the last few years. The relevant regulations in different countries have also been compiled where this information is available.
The Hong Kong market statistics detail the quantities and values, for imports and exports from 2019 to 2021, and for 2022 the main countries of origin and destinations are ranked (Hong Kong, Reference Hong Kong2024).
Results
Captures by fishing areas and country
From the FAO yearly statistics by countries, the capture figures are presented in Table 1 in tonnes of fresh weight, by major FAO fishing regions for the studied period. Each fishing region is presented with the corresponding number of countries within it.
Yearly captures for decade 2013–2022, in tonnes fresh weight, by fishing area and rank (FAO statistics)

The Pacific North-West is now ranked first, with more than 150 000 t of sea cucumbers landed, while the Atlantic North-West ranks second with 80 000 t for the decade. The traditional Pacific Western Central with 10 countries ranks third. The Western Indian Ocean with seven countries ranks eighth, which might be an underestimation as some data is reported in dry weight. The Mediterranean region ranks eleventh while the Pacific South-West, with two countries only, ranks last.
During the last decade, there has been an increase in landings from 2013 to 2018 followed by a slight decrease in 2020–2021, probably due to the COVID-19 pandemic. Statistics for 2022 have only recently been compiled and will be checked when available, as the number of captures could be higher.
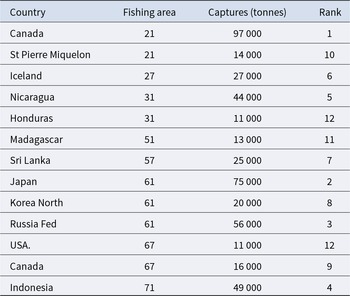
From the same statistics, for the decade 2013–2022, the captures by countries over 10 000 t are presented by fishing zones in Table 2. Twelve countries contribute to more than 50% of the total captures. Canada in Atlantic North-West is ranked first, with the fishery for the Cucumaria frondosa (Gianasi et al., Reference Gianasi, Hamel, Montgomery, Sun and Mercier2020; Mercier et al., Reference Mercier, Penney, Ma, Lovatelli and Hamel2023) and Canada Pacific North-East ranks in position 9. Japan is ranked second, the Russia Federation third, while Indonesia, which was previously preponderant, only ranks fourth.
Captures in tonnes, by country (over 10 000 tonnes), by fishing area and rank (FAO statistics)

Trade from FAO statistics
The trade statistics from FAO (2024b) give the yearly quantities and values for the products coming from holothurians. They are now (from 2019 to 2021) more detailed than before, and presented in the following five categories, or commodities:
1. Sea cucumber dried, salted or in brine, smoked
2. Sea cucumber live, fresh or chilled
3. Sea cucumber frozen
4. Sea cucumber prepared or preserved
5. Sea cucumber other
It is important to remember that processing sea cucumbers into a dried product significantly reduces the overall weight. Also, the smoked product is less than 10% of the fresh weight and this value varies according to species (Conand, Reference Conand1989, Reference Conand1990; Purcell, Reference Purcell2014).
- Imports: Quantity and value
Figure 1 presents the imports quantities (in tonnes) and values (in US$) of the five product categories for the years 2019–2021. As observed for the capture landings, the imports in 2020 were lower as the COVID-19 pandemic certainly impacted trade. The imports by categories show that the traditional dried product (product category 1) is no longer preponderant; frozen products (category 3) are currently the most important; the fresh (2) and prepared (4) categories remain significative. Given the weight differences due to processing, the values of (1) are preponderant and (4), which increased in 2021, deserves more attention.
Imports in quantities (tonnes) and values (US$.103), for years 2019–2021, by categories, from FAO data.

The main countries for the trade, quantities (in tonnes) and values (US$), by commodity are ranked in Table 3. For quantities (Table 3a), China ranks first with the frozen products, ranks third with other products, and ranks sixth for prepared products. More surprisingly, Saudi Arabia is now an important country for the imports, at rank 2 for the dried products, rank 4 for the frozen, and rank 7 for fresh ones. Malaysia is at rank 5 for the dried product and 9 for the frozen, following Hong Kong at rank 8 and the USA is at rank 10 with less than 1000 t per year of fresh product. For the trade values (Table 3b) by commodity (values, over US$10 000 for the sum for the years 2019–2021), the ranking is slightly different than in Table 3a. Hong Kong is ranked first for dried commodity, ranked third for frozen and ranked sixth for prepared. China is at rank 2 with others, at rank 4 with prepared and at rank 5 with frozen. Malaysia, Taiwan, the USA, and Singapore follow from 7 to 10 with dried products. Saudi Arabia is ranked 14 with dried and 15 with frozen.
- Exports: Quantity and value
Imports by commodity, from the main countries, for years 2019–2021 and rank (FAO statistics). A: Quantities in tonnes; B: Values in US$

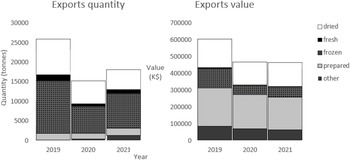
The exports (or re-exports) quantities (in tonnes) and values (in US$) for the five categories of products are presented for the years 2019–2021 in Figure 2.
Exports in quantities (tonnes) and values (US$.103), for years 2019–2021, by categories, from FAO data.

After the strong decrease in 2020 due to the COVID-19 pandemic, the exports are growing again.
The importance of frozen products is noticeable, but differences in weights due to the processing largely diminish the weight of dried sea cucumbers (category 1). More experiments are needed to better compare the different categories of products.
The main countries for the trade quantities by commodity (in tonnes) are ranked in Table 4.
Export from the main countries, for years 2019–2021 and rank (FAO statistics). A: quantities in tonnes; B: Values in US$

Regarding the exports (or re-exports) by commodity (Table 4a): Canada is first with 7400 t of frozen products (category 3), mostly from the species Cucumaria frondosa and sixth for other products.
Hong Kong is second for products other than frozen, where it is at rank 11. Iceland is third with frozen products, also from C. frondosa. Malaysia is fourth for diverse product except frozen, where it is at rank 12. Turkiye that did not appear previously is now ninth for frozen. Japan that exports prepared or preserved (category 4) is only at rank 10.
The main countries for the trade values by commodity (Table 4b) (values, over US$10 000 for the sum for the years 2019–2021) are ranked from 1 to 27. Japan that was rank 10 only for tonnage is now ranked first with over US$500 000, given the high prices paid for the category 4. Hong Kong is ranked second for the dried products and at rank 15 for the frozen products. Malaysia is ranked third for the dried product and 23 for the frozen products. Canada ranks 4 for other products (category 5) and ranks 6 for frozen products. Turkiye is at rank 5 for frozen and 14 for dried products. Nicaragua is at rank 7 for other products. Australia is at rank 8 for dried products. China is at rank 9 for preserved (category 9) and last, at rank 27, for other, while Korea is at rank 12 for this category and ranks 18 for dried products. Taiwan, at rank 10, and Indonesia, at rank 11, have close values for dried products. For dried products, Yemen is at rank 16, the Philippines at rank 17, Korea at rank 18, and Singapore at rank 19. Iceland is at rank 20 and Russia 21 for frozen products. Papua New Guinea is at rank 22, the Seychelles at 24, and the USA at 25 for dried and 26 for frozen products. Sri Lanka is at rank 13 for other products (category 5).
Hong Kong market
Recent changes deserve special attention and the statistics for the years 2019–2022 (Hong Kong, Reference Hong Kong2024) are analysed here. Figure 3 shows some of the categories proposed; the weight unit is given in grams, or in kan (one HK catty is around 0.6 kg) and the current exchange rate is 1 HKD for US$0.13. H. scabra’s expensive products are shown, with 1380 HKD for 500 g (Figure 3A); various low-value products are presented (Figure 3B); Apostichopus japonicus with prices going up to 3600 HKD per catty (Figure 3C); dried products soaked by the seller (Figure 3D).
Hong Kong market. (A) Shop; (B) high-value products; (C) high-value H. scabra; (D) high-value A. japonicus; (E) low-value products; (F) dried products soaked by seller (photos J. Cornet).

In the recent statistics (Hong Kong, Reference Hong Kong2024), the quantities are in tonnes and classified in five commodities (dried, fresh, frozen, prepared, other), as in the FAO statistics. Figure 4 shows the imports and exports in quantities, with an expected decrease due to COVID-19 in 2020. The imports in 2021 are nearly at the level from before COVID-19, but this is not the case for the exports, which are only starting to increase again. Frozen products are the dominant commodity, and there are more imported fresh products than prepared ones.
Hong Kong imports and exports quantities (tonnes), for years 2019–2021, by commodity (HK Statistics).

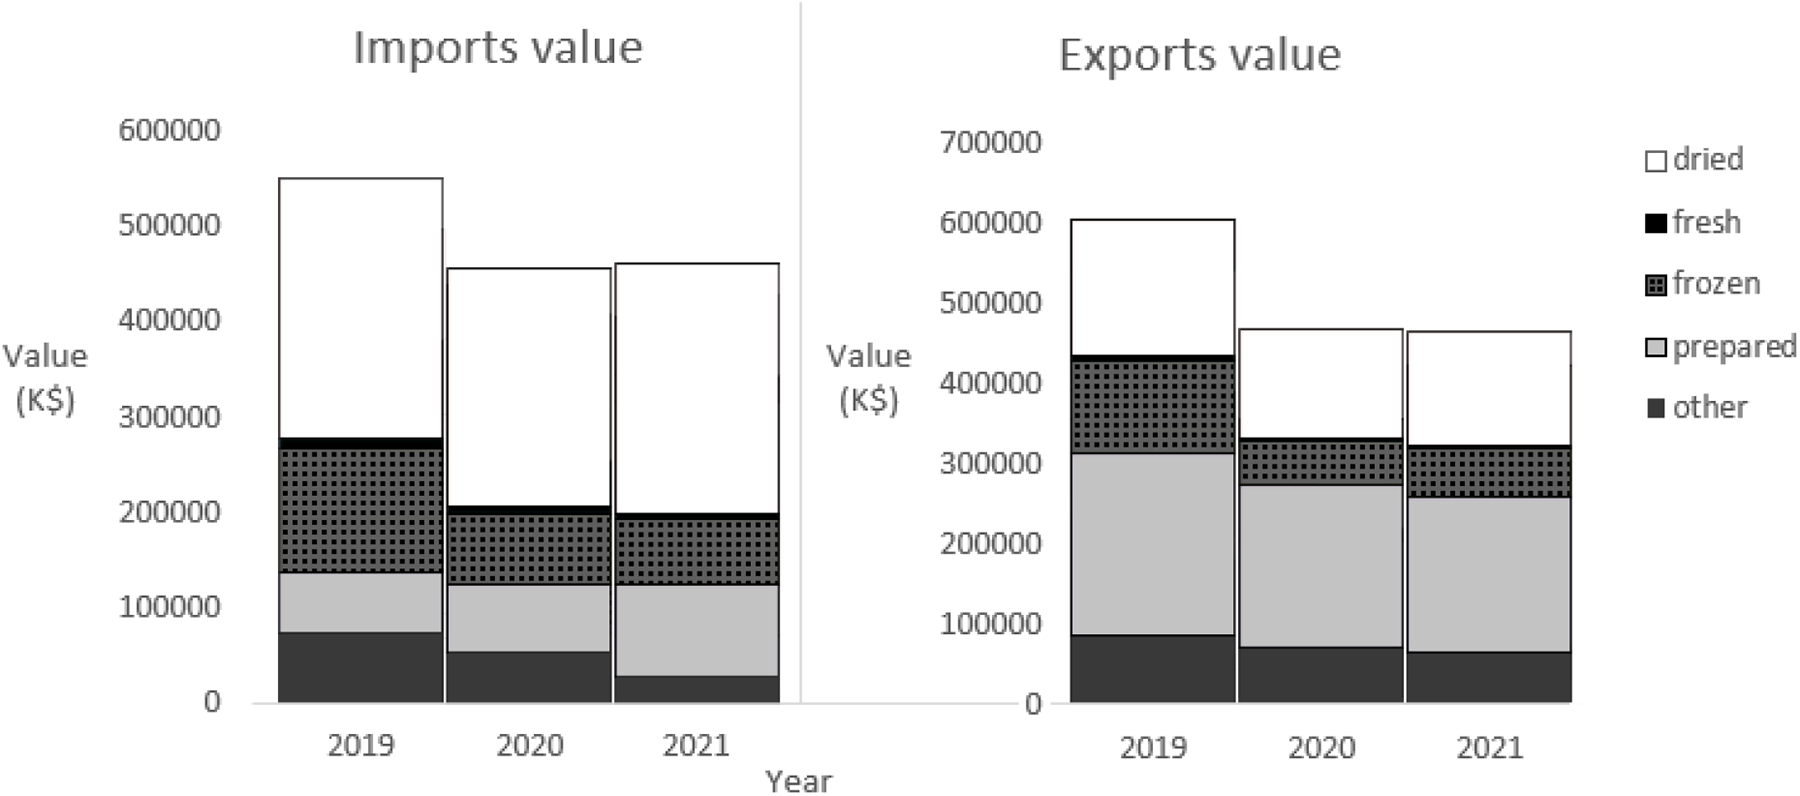
Regarding the values in HKD, Figure 5 shows several trends: in the imports, dried products are predominant, frozen and prepared products are important, whereas fresh products are not significant. In the exports, dried products are less than the prepared ones which are the larger category and will therefore need more information.
Hong Kong imports and exports values (HKD), for years 2019–2021, by commodity (HK Statistics).

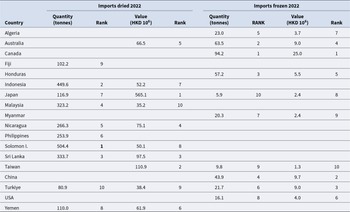
The details of the 10 main countries involved in 2022 in the imports of the dried and frozen categories are presented for the quantities (in tonnes) and values (million HKD), with their respective rank, in Table 5. Regarding dried products, the first rank for the quantities is the Solomon Islands, followed by Indonesia, Sri Lanka, Malaysia, Nicaragua, and the Philippines. For the values, despite only at rank 7 of the quantities, Japan is ranked first, followed by Taiwan, Sri Lanka, Nicaragua, Australia, and Yemen. For the frozen products, the first rank for the quantities is Canada, then Australia, Honduras, China, Algeria, and Turkiye. For the values, Canada is also first, followed by China, Turkiye, Australia, Honduras, and the USA.
Imports into Hong Kong in quantity (tonnes) and value (HKD 106), for year 2022, of dried and frozen products, from main countries, with rank (HK Statistics)

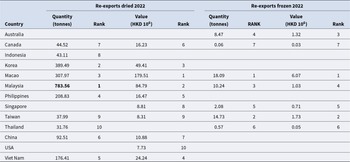
Similarly, the 10 main countries involved in 2022 in the re-exports of these two categories of products are given for the quantities and values, with their respective ranks in Table 6. Regarding dried products, the first rank for the quantities is Malaysia by far, followed by Korea, Macao, the Philippines, Viet Nam, and China. For the values, Macao is first, followed by Malaysia, Korea, Viet Nam, the Philippines, and Canada. For frozen products, the first rank for the quantities is Macao, then Taiwan, Malaysia, Australia, Singapore, and Thailand. For the values, Macao is also first, followed by Taiwan, Australia, Malaysia, Singapore, and Thailand.
Exports from Hong Kong in quantity (tonnes) and value (HKD 106), for year 2022, of dried and frozen products, from main countries, with rank (HK Statistics)

The dried products are much more important than the frozen ones, in the imports as well as the re-exports.
Discussion
The problem of capture statistics
Sea cucumber capture landings in tonnes of fresh weight reported by FAO by country and by fishing area are analysed here for the decade 2013–2022. In previous studies (Conand and Sloan, Reference Conand, Sloan and Caddy1989; Conand and Byrne, Reference Conand and Byrne1993; Conand, Reference Conand and Baine1999, Reference Conand, Lovatelli, Conand, Purcell, J.-F and Mercier2004), the catches were evaluated from the dry weights for the tropical Pacific and Indian oceans, then converted into approximate fresh weights, whereas fresh weights were used for temperate fisheries. The mean annual tonnage for the period 2009–2014 was presented in dry weights, using a conversion of 8% from fresh to dry for Pacific North West and North East, Atlantic North West, North East, and Central West (Conand, Reference Conand2017). These conversion rates do not take the species differences into account. For the data in the present study, it remains possible that some tropical countries do not give the statistics in fresh weights. Some control and homogenisation of data is therefore still needed.
Recent trade statistics
The diversification of the world trade commodities (FAO, 2024b) into five categories, since 2019, offers a more detailed overview of the imports and exports, from different countries within the different fishing areas.
Regarding the imports in quantities, the ‘frozen’ commodity has increased, mostly in more recent exploitation. The ‘dried’ commodity is overall important, although there are differences between countries. Despite the decrease due to COVID-19, the values are globally high and the ‘prepared’ category is especially important in Japan, China, and Korea. It is also the case for the exports from these countries.
Regarding the exports, the ‘frozen’ category has increased in quantity and value.
It is necessary to evaluate the equivalent in fresh weight of the different commodities obtained from the different species collected. The large differences in characteristics of the fisheries (Conand, Reference Conand2017; Mercier et al., Reference Mercier, Purcell, Montgomery, Kinch, Byrne and Hamel2025) make this evaluation difficult to make.
Hong Kong statistics (Hong Kong, Reference Hong Kong2024) show the importance of this market in the world trade, for imports and re-exports transiting through the territory. This market is also under the influence of the world situation, as shows by the impact the COVID-19 crisis. Regarding the different commodities, the ‘dried’ is preponderant, the ‘frozen’ is also very important; however, the ‘fresh’ and the ‘prepared’ commodities would need more detailed information. From tests in other markets, such as New York City (Rodenbiker et al., Reference Rodenbiker, Therkildsen, Ruan and Su2024), it appears that genetic markers are required to better label and trace the origins of the products.
Globalisation
In recent years, both small-scale and industrial-scale fisheries have expanded globally (Lovatelli et al., Reference Lovatelli, Conand, Purcell, Hamel and Mercier2004; Toral-Granda et al., Reference Toral-Granda, Lovatelli and Vasconcellos2008; Conand, Reference Conand2017; Mercier et al., Reference Mercier, Purcell, Montgomery, Kinch, Byrne and Hamel2025). More countries than ever before have sea cucumber fisheries present in most fishing areas.
The regional importance (see Table 1) is now as follows: Pacific NW (61) WC (71) NE (67), Atlantic NW (21) WC (31) NE (27) and Indian Ocean EI (57) WI (51). The other regions have small fisheries.
Globally, the captures by year were more or less regular at around 80 000 t between 2012 and 2015; then declined during COVID-19 in 2020–2021 and the recent increase needs to be monitored.
Management and conservation
Management is needed at three levels: country level, regional level (Conand and Muthiga, Reference Conand and Muthiga2007; Purcell, Reference Purcell, Lovatelli, Vasconcellos and Yimin2010, Reference Purcell2014; Purcell et al., Reference Purcell, Mercier, Conand, Hamel, Toral-Granda, Lovatelli and Uthicke2013, Reference Purcell, Lovatelli and Pakoa2014a; Eriksson et al., Reference Eriksson, Conand, Lovatelli, Muthiga and Purcell2015a; Conand, Reference Conand2018a; Conand et al., Reference Conand, Claereboudt, Dissayanake, Fernando, Godvinden, Lavitra, Leopold, Mmbaga, Mulochau, Naaem, Shea, Vaitilingon, D and Friedman2022a, Reference Conand, Lovatelli, Shea and Wolfe2022b, Reference Conand, Desurmont, Eeckhaut and In Mercier2024a), and international level (Friedman et al., Reference Friedman, Eriksson, Tardy and Pakoa2011; Purcell et al., Reference Purcell, Polidoro, Hamel, Gamboa and Mercier2014b; Eriksson et al., Reference Eriksson, Österblom, Crona, Troell, Neil, Wilen and Folke2015b; Conand, Reference Conand2018a; Conand et al., Reference Conand, Claereboudt, Dissayanake, Fernando, Godvinden, Lavitra, Leopold, Mmbaga, Mulochau, Naaem, Shea, Vaitilingon, D and Friedman2022a, Reference Conand, Lovatelli, Shea and Wolfe2022b, Reference Conand, Purcell, Hamel, Mercier, Di Simone, Horellou, Friedman and Lovatelli2024b; Mercier et al., Reference Mercier, Hamel, Suhrbier and Pearce2024; Conand et al., Reference Conand, Desurmont, Eeckhaut and In Mercier2024a; Mercier et al., Reference Mercier, Purcell, Montgomery, Kinch, Byrne and Hamel2025). The FAO uses an ecosystem approach of fisheries for a regional management, as shown by the workshops for the Pacific and the Indian oceans (FAO, 2012, 2013).
The illegal fisheries and trade (IUU) are an important problem, present in all regions, but very critical when a new fishery develops (Conand, Reference Conand2018b; Ong and Chin, Reference Ong and Chin2022; Phelps Bondaroff and Morrow, Reference Phelps Bondaroff, Morrow, Mercier, J.-f, Suhrbier and Pearce2024; Mercier et al., Reference Mercier, Purcell, Montgomery, Kinch, Byrne and Hamel2025).
In addition to management actions, conservation actions are also needed and need to be coordinated at the same three levels. Recent progress at the international level are being undertaken by the International Union for Conservation of Nature (IUCN) (Polidoro et al., Reference Polidoro, Tognelli, Harwell, Elfes, Cepeda, González-Maya, Zárrate-Charry, Alvarado, Benavides, Conand, Ortiz, Gamboa, Hamel, Mercier, Purcell and Toral-Granda2011; Purcell et al., Reference Purcell, Polidoro, Hamel, Gamboa and Mercier2014b; Conand et al., Reference Conand, Desurmont, Eeckhaut and In Mercier2024a) with the creation in 2022 of the Sea Cucumber Specialist Group in the IUCN Species Survival Commission; its very recent report (Mercier and Juinio-Meñez (Reference Mercier and Juinio-Meñez2025) details the targets, actions and achievements for the group. The Convention on International Trade in Endangered Species of Wild Fauna and Flora (CITES, 2023a, 2023b) where several species have recently been added in Annex II (Conand et al., Reference Conand, Desurmont, Eeckhaut and In Mercier2024a) will also meet in 2025.
Acknowledgements
The authors would like to thank FAO for the fisheries Statistics.
Author contributions
Chantal Conand: Investigation, analysis of data, conceptualization, writing, review and editing. Julie Cornet: investigation in Hong Kong, photos of the market, review. Alessandro Lovatelli: providing FAO statistics, review.
Funding
This study was not supported by a funding.
Ethical standards
The authors followed all applicable international, national, and institutional guidelines.
Competing interests
The authors declare no conflict of interests.


 Open access