


Introduction
A growing body of research has examined behavioural biases affecting insurance adoption; however, there remains a limited understanding of how ambiguity aversion, myopia and distrust in insurance policies influence insurance uptake. These behavioural factors play a crucial role in shaping insurance demand, and exploring their interactions provides deeper insight into why people often prefer policies with clearly defined terms over those with ambiguous or uncertain coverage (Shepard and Wagner, Reference Shepard and Wagner2022; Keith et al., Reference Keith, Tubaldi, de Angelis, Stripajova and Douglas2023). Recognising the interdependence of these biases underscores the need for a holistic approach, as addressing them in isolation may not yield the desired outcomes (Baillon et al., Reference Baillon, O’Donnell, Quimbo and van Wilgenburg2022). For example, if distrust drives ambiguity aversion toward complex insurance products, a more effective strategy would be to build trust before simplifying product designs (Cai et al., Reference Cai, de Janvry and Sadoulet2020).
The human preference for certainty often influences the tendency to purchase insurance, particularly in developing countries (Feng et al., Reference Feng, Du and Hennessy2020). Behavioural biases and market characteristics, such as high issuance costs and initial premium payments, collectively hinder insurance uptake in these economies (Aloysius and Boateng, Reference Aloysius and Boateng2019). According to expected utility theory, insurance adoption would significantly decline if subsidies were removed, as price, income and risk aversion affect insurance demand. Some developing countries exhibit low insurance adoption rates due to these behavioural biases. For example, only 5% of Nigerians have health insurance, while India’s life insurance penetration rate is 3% (Owolabi et al., Reference Owolabi, Shahra and Basurra2023; Agrawal et al., Reference Agrawal, Kumar, Agarwal and Gupta2024). These patterns illustrate the insurance puzzle – the phenomenon whereby economic growth does not necessarily lead to increased insurance adoption. Although economic growth can enhance financial stability, it may not increase insurance uptake if high premiums, risk perceptions and trust issues persist.
Limited trust in service providers contributes to individuals’ reluctance to purchase insurance (Cynthia, Reference Cynthia2025). When people doubt the ability and reliability of insurance providers to fulfil promised benefits, such as risk protection and claim payouts, they hesitate to invest in insurance policies (Cai et al., Reference Cai, de Janvry and Sadoulet2020). In many cases, policyholders may cancel their insurance policies when facing financial difficulties, despite the long-term advantages of maintaining coverage (Kahneman and Tversky, Reference Kahneman and Tversky1979). This behaviour is explained by prospect theory, which emphasises that people tend to focus more on immediate losses than on future gains, leading them to make decisions that are misaligned with their long-term financial interests (Hwang, Reference Hwang2016; Feng et al., Reference Feng, Du and Hennessy2020).
Existing research on insurance uptake in developing economies has focused on direct interventions, such as subsidies or product design, often examining the effects of initial exposure and observed outcomes on insurance demand (Hwang, Reference Hwang2016; Feng et al., Reference Feng, Du and Hennessy2020). While valuable, previous research has not fully elucidated the underlying behavioural mechanisms and their interactions that shape insurance decisions. A key lacuna exists in moving beyond the mere identification of behavioural biases – such as ambiguity aversion, myopia and distrust – to understanding their synergistic and causal relationships. There is limited research that rigorously models how these distinct biases might amplify or mitigate each other’s effects on insurance uptake. To our knowledge, this is the first cross-continental study to model the synergistic effects of ambiguity aversion, myopia and distrust on insurance uptake in developing countries. To our knowledge, this is the first cross-continental study to examine how the behavioural constructs of ambiguity aversion, myopia and distrust are reflected in, and shaped by, institutional and regulatory conditions associated with insurance uptake in developing countries. We contribute to the literature by employing a configurational (crisp-set Qualitative Comparative Analysis, csQCA) approach to uncover how these behaviourally relevant institutional features combine differently across contexts – a critical insight for designing targeted interventions. While behavioural research in insurance markets is well established, configurational approaches remain rare. By using csQCA, we provide a new lens for analysing complex, multi-causal environments typical of developing countries, showing how diverse institutional pathways may hinder or enable the preconditions necessary for insurance uptake. This approach offers actionable insights for development policy and practice.
Excerpts from QCA analyses can provide a new lens to inform development policies and practices, especially in complex multi-causal environments in developing countries. csQCA analyses help identify the necessary combination of policies, institutions, or social conditions for successful policy interventions, such as reducing poverty and improving insurance uptake. By embracing contextualised policy solutions, csQCA analyses align with Sustainable Development Goal (SDG)-driven development, which avoids a one-size-fits-all approach. Second, the lack of broad-based comparative studies constrains the generalisability of existing behavioural insights. These studies would account for variations in institutional frameworks and socioeconomic conditions across various developing countries. Our research directly addresses this gap by developing a conceptual framework for the interplay between biases within institutional frameworks and socioeconomic conditions, and by conducting a multi-continental comparative analysis.
Insurance uptake in developing countries: current state and challenges
Due to behavioural and institutional constraints, insurance remains underutilised in many developing countries despite its potential to support economic development. Evidence shows that the structure and timing of premium payments significantly influence uptake. For example, in the agricultural sector, delayed or post-harvest premium payments increase participation in insurance schemes (Casaburi and Willis, Reference Casaburi and Willis2018; Belissa et al., Reference Belissa, Bulte, Cecchi, Gangopadhyay and Lensink2019; Liu et al., Reference Liu, Hou, Li, Min and Mu2021). In contrast, health insurance enrolment tends to decline when upfront costs are high or when incentives are weak. These patterns are reflected in the high lapse rates reported across several emerging economies, where insured individuals drop out due to affordability issues, mistrust or delays in benefits. Consequently, high-lapse rates have been observed in developing countries across Africa, Asia and the Americas. These patterns are evident in countries such as Nigeria (15.7%), Kenya (12.3%), Zambia (17.2%) and Zimbabwe (19.8%) (Chanda and Phiri, Reference Chanda and Phiri2019; Mugabe and Dube, Reference Mugabe and Dube2020; Mwangi et al., Reference Mwangi, Chen and Njoroge2020). In developing African countries, lapse rates have been attributed to behavioural factors such as loss aversion, present bias and status quo bias (Zulu and Dlamini, Reference Zulu and Dlamini2020).
While lapse rates are generally higher in African countries, parts of Asia present a more nuanced picture. In Asia, developing countries exhibit lower insurance lapse rates, with India reporting a lapse rate of 10.5%, Malaysia at 8%, and the Philippines at 12.4% (Santos and Mendoza, Reference Santos and Mendoza2019). China, recognised as one of the fastest-developing countries in Asia, recorded a 7% lapse rate. The lapse rates in developing Asian countries are marginally lower than those in Africa; however, they still highlight the issue of low insurance uptake in these regions. In countries like the Philippines, individuals often display hyperbolic discounting – favouring immediate financial needs over long-term coverage – especially during economic downturns (Abdullah and Ismail, Reference Abdullah and Ismail2020).
Countries in the Americas have also experienced high insurance-policy lapse rates. As of 2021, Mexico reported a lapse rate of 9.3%, primarily due to inconsistent premium payments. These developing countries across various continents highlight issues related to insurance lapse rates stemming from behavioural barriers. While some countries emphasise trust issues – manifested as inconsistent premium payments – and hyperbolic discounting (myopia), others identify loss aversion as a key factor influencing lapse rates. Given that insurance policies play a crucial role in promoting economic growth and achieving the SDGs on poverty reduction (SDG 1) and good health and well-being (SDG 3), it is important to address the issue of low insurance uptake in developing countries. Tackling behavioural biases that affect insurance retention is essential for market expansion, broader social protection and improved development outcomes.
Literature review
Key theories and empirical evidence: conceptualising behavioural bias to insurance uptake
Discussions on behavioural biases in insurance uptake have sparked important academic debates, highlighting the significance of ambiguity bias, myopia and distrust as key factors in insurance adoption. The core ideas behind these behavioural influences have developed through recent cross-country and country-specific research, focusing on the ambiguity in insurance contracts and the uncertainty of claim outcomes. Central to this theoretical discussion are ambiguity aversion, hyperbolic discounting, prospect theory and expected utility theory.
Ambiguity aversion and insurance uptake
Ambiguity aversion theory suggests that, even when the expected value is the same, people tend to prefer choices with known probabilities (risky) over those with unknown or unclear probabilities (Ali et al., Reference Ali, Abdulai, Goetz and Owusu2021; Lambregts et al., Reference Lambregts, Van Bruggen and Bleichrodt2021). This study adopts a Multiple Priors Expected Utility (MEU) framework to model decision-making under ambiguity (Gilboa and Schmeidler, Reference Gilboa and Schmeidler1989). In this model, individuals evaluate decisions based on the worst-case expected utility across a set of subjective beliefs:
 \begin{equation}
\upsilon \left(f\right) = min_{p \in P} \smallint {u}\left(f\right){dP}\end{equation}
\begin{equation}
\upsilon \left(f\right) = min_{p \in P} \smallint {u}\left(f\right){dP}\end{equation} Where  $\upsilon \left( f \right)$is the decision-maker’s utility, $u\left( f \right)$is the standard Von Neumann–Morgenstern utility over outcomes, P is the set of subjective prior distributions over outcomes and $P \in P$ is one possible probability belief (reflecting perceived ambiguity over outcomes). The MEU framework (equation 1) explains how people manage uncertainty by focusing on the least favourable outcome across all plausible beliefs (Gollier, Reference Gollier2014). The decision-maker evaluates insurance options based on the worst-case expected utility, opting for the belief that reduces perceived utility (Di Cagno and Grieco, Reference Di Cagno and Grieco2023; Cecchi et al., Reference Cecchi, Lensink and Slingerland2024). This helps explain why people may hesitate to purchase insurance due to distrust of insurance payouts and poorly framed policies.
Individuals may also be less likely to purchase insurance when uncertainty about losses affects demand (Bradley, Reference Bradley2016; Bi et al., Reference Bi, Zhao, Tong, Feng and Ventre2025). They might prefer to save money (self-insurance) to mitigate the impact of a financial loss – even if this approach is less efficient than buying insurance – because they believe they have more control over the outcome (Snow, Reference Snow2011; Zhang et al., Reference Zhang, Zhou, Li and Chen2024). Both insurers and policyholders are also subject to behavioural bias in the form of ambiguity aversion. Ambiguity aversion affects the insurance market as insurers or policymakers may struggle to assess risks, while potential buyers may demand higher premiums or avoid insurance altogether when faced with uncertainty.
Given the uncertainty surrounding insurance uptake, research has examined the role of behavioural factors in different countries. Studies emphasise that behavioural biases play a key role in insurance uptake decisions, with ambiguity bias among the most prominent. Previous research found that ambiguity aversion influences farmers’ willingness to participate in crop insurance programmes (Ali et al., Reference Ali, Abdulai, Goetz and Owusu2021). The authors revealed that insurance markets exist because individuals trade off production risks in anticipation of indemnification, as the probabilities of occurrence under ambiguity are unknown, unlike those of known probabilities. Belissa et al. (Reference Belissa, Bulte, Cecchi, Gangopadhyay and Lensink2019) similarly found that greater ambiguity aversion delays the uptake of index-based insurance (IBI), whereas greater risk aversion increases IBI adoption.
These findings indicate that ambiguity aversion intensifies overall risk aversion, creating a reinforcing effect. In contrast, other recent studies suggest that decision-makers who are ambiguity-averse tend to buy more insurance than ambiguity-neutral individuals when aiming to maximise expected utility (Hong, Reference Hong2022; Ndawula et al., Reference Ndawula, N. and I.2024; Obiki-Osafiele et al., Reference Obiki-Osafiele, Ikwue, Eyo-Udo and Daraojimba2023; Guan and Gong, Reference Guan and Gong2024; Rapi et al., Reference Rapi, Priyarsono, Jahroh and Bakhtiar2025). Given these mixed results – and the fact that ambiguity aversion has not been widely examined as a causal condition – this study explores it as a behavioural bias that interacts with other biases, such as myopia, to jointly influence insurance adoption and explain variations across different developing contexts.
Myopia and insurance uptake
Hyperbolic discounting is a theory that explains how individuals are likely to value immediate rewards over delayed rewards. This theory states that individuals frequently choose smaller rewards instead of larger ones, even though the delayed outcomes are objectively better. Laibson (Reference Laibson1997) introduced the quasi-hyperbolic discounting model to capture this phenomenon. This model incorporates present bias into standard discounting utility:
 \begin{equation}{{\mathbf{U}}_0} = {\mathbf{u}}\left( {{{\mathbf{c}}_0}} \right) + {\boldsymbol{\beta }}\mathop \sum \limits_{{\boldsymbol{t}} = 1}^{\boldsymbol{T}} {{\boldsymbol{\delta }}^{\boldsymbol{t}}}{\boldsymbol{u}}({{\boldsymbol{c}}_{\boldsymbol{t}}}){\boldsymbol{\,}}\end{equation}
 Where  ${U_0}$ is total utility, $\beta $ is the present bias parameter (where $0 \lt \beta \lt 1$), $u.({c_t})$ is utility from consumption $({c_t})$ at time t, ${\delta ^t}$ is the geometric standard discount factor and T is the time horizon. This framework (Equation 2) explains why people often intend to delay purchasing insurance, contributing to underinsurance. This behaviour can lead individuals to make decisions that may not be in their long-term best interests. People tend to undervalue future rewards, with the discounting effect decreasing as the time-frame approaches the present. The difference in perceived value between a reward received in one week and one received in two weeks may be minimal; however, the contrast between a reward obtained today and one received in one week can be significantly greater.
Early research on hyperbolic discounting (Barro, Reference Barro1999; Luttmer and Mariotti, Reference Luttmer and Mariotti2003; Grenaider and Wang, Reference Grenaider and Wang2007) demonstrated that individuals’ preference for immediate rewards results in dynamically inconsistent preferences. Subsequent studies conducted simulations on hyperbolic discounting and found that time-inconsistent individuals exhibit a lower demand for life insurance (Marín-Solano and Navas, Reference Marín-Solano and Navas2010; De Paz Monfort, Reference De Paz Monfort2012). More recent research has extended hyperbolic discounting models to account for multiple shifts in time preferences (Koo and Lim, Reference Koo and Lim2021), emphasising the significant influence of hyperbolic discounting on insurance decisions (Zhang et al., Reference Zhang, Purcal and Wei2021). However, these studies have paid less attention to the causal pathways leading to insurance uptake, particularly those involving behavioural factors such as myopia (hyperbolic discounting). This study addresses this gap by exploring the equifinality of insurance uptake to determine whether myopia is an important and necessary condition driving the path to insurance acquisition.
Distrust and insurance uptake
Distrust in insurance providers can stem from past experiences in failed claim settlements, lack of transparency and perceived unfair treatment. This occurrence exacerbates the effects of prospect theory on insurance uptake. People may not see the need to purchase insurance due to mistrust, causing them to avoid taking it. Prospect theory emphasises that people are more sensitive to losses than gains, leading them to suboptimal decisions about insurance policies. This assumption is defined as:
 \begin{equation}{U}\left( {x} \right) = \left\{ {\begin{array}{*{20}{c}}
{{{{x}}^{a}},\,\,\,\,\,\,\,\,\,\,\,\,\,\,\,\,\,\,\,\,\,\,\,\,\,\,if\,\,x \geqslant 0\,\left( {for\,gains} \right)} \\
{ - {\boldsymbol{\lambda }}{{\left( { - {{x}}} \right)}^{\boldsymbol{\beta }}},\,\,\,\,\,\,\,\,\,\,\,\,\,if\,x \lt 0\left( {for\,losses} \right)}
\end{array}} \right.\end{equation}
\begin{equation}{U}\left( {x} \right) = \left\{ {\begin{array}{*{20}{c}}
{{{{x}}^{a}},\,\,\,\,\,\,\,\,\,\,\,\,\,\,\,\,\,\,\,\,\,\,\,\,\,\,if\,\,x \geqslant 0\,\left( {for\,gains} \right)} \\
{ - {\boldsymbol{\lambda }}{{\left( { - {{x}}} \right)}^{\boldsymbol{\beta }}},\,\,\,\,\,\,\,\,\,\,\,\,\,if\,x \lt 0\left( {for\,losses} \right)}
\end{array}} \right.\end{equation} The value function in Prospect Theory is defined as piecewise for gains and losses. In terms of gains,the function is  $\textstyle U=x^{\alpha}$, where $0 \lt \alpha \lt 1$. For losses, the function is $U(x)=-\lambda{(-x)}^\beta$ , where $0 \lt \beta \lt 1$ and $\lambda \gt 1$. The Prospect Theory value function models human decision-making under risk by incorporating diminishing sensitivity (through α and β) and loss aversion (through λ). These parameters explain why individuals are more sensitive to losses than to equivalent gains and why they value additional gains or losses less as the amount increases. Regarding premiums, even a small premium feels larger than a significant but uncertain gain. Kahneman and Tversky (Reference Kahneman and Tversky1979) also introduced the concept of probability weighting, where individuals tend to overweight small probabilities of losses and underweight small probabilities of gains.
Studies have found that despite the benefits of insurance for developing countries, insurance uptake remains low due to distrust in insurance policies (Cheston et al., Reference Cheston, De Filippo, Han, Newman-Martin and Zeckhauser2014). A series of experiments has been conducted to examine the effect of trust on insurance adoption. These experiments were divided into two groups. The first group tested whether individuals’ time preferences for payments depended on their trust in the insurer (Alary et al., Reference Alary, Gollier and Treich2013; Koo and Lim, Reference Koo and Lim2021). The second group examined whether people’s reluctance to purchase insurance would change if it were offered by a trusted provider (Cai et al., Reference Cai, de Janvry and Sadoulet2020; Baillon et al., Reference Baillon, O’Donnell, Quimbo and van Wilgenburg2022). The first group of studies suggests that individuals’ willingness to delay payment or pay on time depends on their trust in the insurance provider. Findings from the second group highlight that offering insurance through trusted sources may increase uptake and that familiarity plays a key role in identifying the most trusted organisations. These studies primarily draw inferences from experimental and conceptual literature, often giving limited attention to the causal pathways through which behavioural factors, such as trust, influence insurance uptake. While experiments provide valuable insights through inductive reasoning, they may not fully capture the broader implications of behavioural biases in real-world contexts. Moreover, even when the effects of behavioural biases are acknowledged, a critical question remains unanswered: Which specific combination of conditions should be addressed to improve insurance uptake effectively? This study aims to explore trust as one of the key conditions influencing insurance adoption.
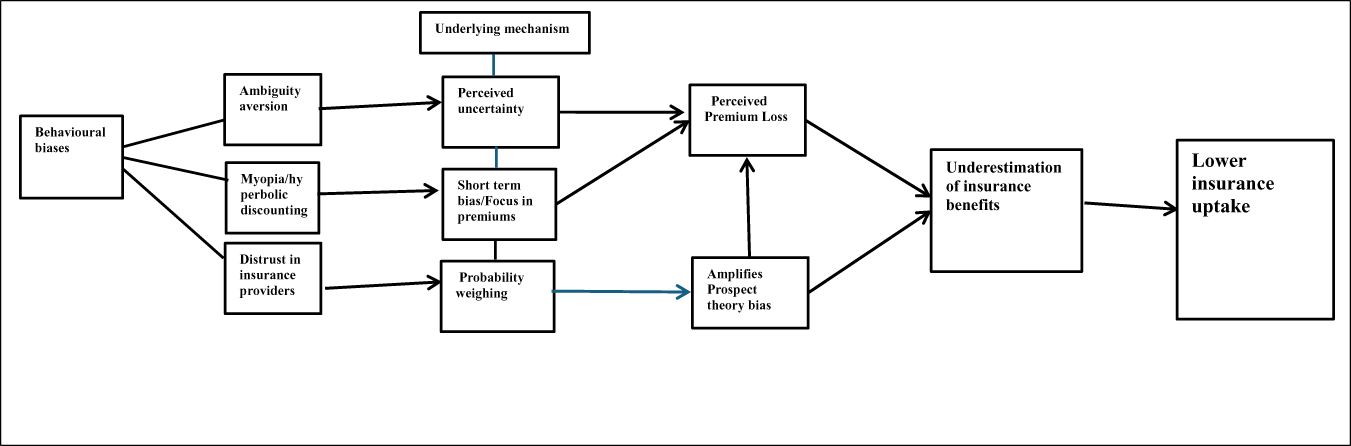
Conceptual diagram showing the pathways to insurance uptake
These theoretical postulations are displayed using a conceptual diagram (Figure 1). The diagram illustrates the behavioural mechanisms that influence insurance uptake. This diagram shows that these three biases – myopia, ambiguity aversion and distrust – determine insurance outcomes. Their underlying mechanisms, perceived uncertainty and short-term bias lead to perceived premium loss, amplifying the perceived premium loss. Probability weighting amplifies prospect theory bias. These biases jointly lead to underestimating insurance benefits and low uptake, demonstrating their synergistic relationship in determining insurance uptake. In contrast, myopia can weaken motivation to invest in insurance that offers long-term benefits. Our framework, utilising these theories – multiple prior expected utility theory, hyperbolic discounting and prospect theory – posits that individuals are unlikely to demand insurance when these biases coincide. Drawing from these theoretical and empirical standpoints, this study seeks to answer three questions.
RQ1: How do myopia, ambiguity aversion and distrust interact to influence insurance uptake in developing countries?
RQ2: To what extent do these behavioural biases operate differently across income and institutional contexts?
RQ3: What are the implications of these interactions for advancing financial inclusion and poverty reduction in line with the SDGs?
Conceptual path to insurance uptake.

By examining behavioural biases within the debates in broader development economics on poverty and social protection, this study bridges micro-level decision-making with macro-level development outcomes.
Data and methodology
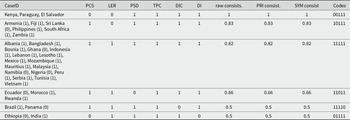
The data used in this study were obtained from the 2022 Global Financial Inclusion and Consumer Protection (FICP) Survey Respondent Data, which included responses from different countries. It includes country-level information on consumer protection, financial sector regulation and financial capacity projects, with structured data coded as 1 for positive responses and 0 for negative responses. Our sample includes 40 developing countries from Africa, Asia, the Americas and Central and Eastern Europe.
Crisp-set Qualitative Comparative Analysis
This study adopts csQCA to explore the complex causal links between behavioural biases and insurance uptake. csQCA provides advantages over regression analysis in explaining complex causal relationships with limited cases. csQCA uses binary coding for variables and outcomes to achieve a synthesis of case-oriented and variable-oriented approaches. It assumes binary outcomes and causal causes, with membership in each explicitly stated. The csQCA recognises that both the presence and absence of conditions are significant for outcomes. It simplifies complexity using a truth table and tackles the constraints of other methodologies, such as correlation and regression analysis, without replacing them. Its main advantages are the capacity to perform configuration analysis to explain binary logic, handle equifinality (many pathways to the outcome) and elucidate causal complexity. It helps deliver in-depth analysis and offers strong contextual insights.
It is important to acknowledge that the behavioural phenomena of interest (e.g., ambiguity, trust, myopia) are inherently continuous. The available data in this study, however, are limited to binary survey indicators representing the presence or absence of regulatory and administrative conditions. As a result, csQCA with crisp sets bypasses the need for latent construct calibration. Despite this limitation, binary coding is justified in this context because each condition represents a clearly observable institutional or regulatory permission, such as whether a commercial bank is authorised to offer a specific insurance product and under which supervisory framework. These permissions form the configurational environments necessary for insurance distribution, even if they do not directly measure individual behavioural uptake.
Measurement logic for behavioural constructs
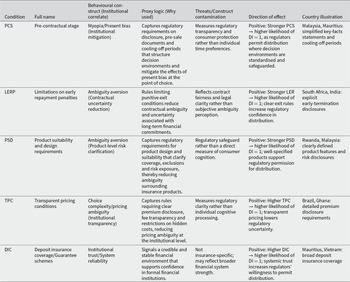
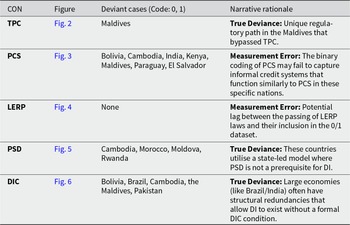
This study examines how institutional and regulatory features shape environments that are more or less conducive to mitigating three behavioural frictions – myopia, distrust and ambiguity aversion – known to influence insurance decisions in developing countries. Because the FICP dataset does not directly capture psychological states, each construct is operationalised using second-best institutional proxies. These indicators do not measure behaviour per se; instead, they signal the extent to which a country’s regulatory architecture enables or constrains behavioural tendencies relevant to insurance uptake. Below, we clarify the behavioural construct, the rationale for each proxy and its limitations.
Myopia (present bias) refers to the tendency to overweight short-term costs relative to long-term benefits, leading consumers to underinvest in insurance products that pay off in the future. It is proxied through pre-contractual engagement (PCS) and limitations on early repayment penalties (LERP). Although these items do not directly measure time preference, they represent regulatory practices that reduce short-term decision frictions by improving disclosure and flexibility – thus moderating present-bias-driven lapses. The direction of effect assumes that better disclosure/contract flexibility reduces short-term bias – this is plausible but indirect.
Trust is proxied via transparent pricing (TPC) and deposit insurance coverage (DIC). While TPC is an internal control item and DIC refers to banking protection, both serve as institutional signals of fairness, credibility and safety, factors widely shown to influence trust in financial products. TPC signals organisational accountability and fairness procedures, which can increase institutional credibility even if it is not a direct price-disclosure rule. DIC is not an insurance-specific mechanism but provides a broader signal of financial system safety that can spill over into consumers’ expectations for related financial services, including insurance.
Ambiguity aversion refers to the reluctance to engage with products when key contract terms or risk exposures are unclear or difficult to assess. It is proxied through product suitability and design (PSD). Although PSD originates from governance processes, it captures whether consumers are exposed to unclear or mismatched insurance terms and conditions known to heighten perceived ambiguity. PSD reduces contractual and product uncertainty, helping consumers better understand what insurance covers and how it functions. Even though PSD reflects governance/internal processes, it signals whether products are likely to be clear, appropriate and not overly complex – conditions that can soften ambiguity aversion.
Insurance uptake is captured using distributed insurance. Although the term ‘uptake’ is traditionally used to describe realised household adoption (e.g., penetration, enrolment, renewal), the data available in the FICP survey do not include behavioural adoption measures. Our outcome variable – Distributed Insurance (DI) – captures whether countries permit or enable distributed channels such as mobile, agent-assisted, or embedded mechanisms. This study conceptualises insurance adoption in developing countries as an institutional process in which regulatory permission is required but insufficient prerequisite for subsequent household uptake. As a result, the outcome under consideration in this study is not actual household insurance uptake but rather the availability of regulatory and institutional configurations that permit or limit the legal authorisation and distribution of insurance products. This emphasis reflects both the institutional structure of the accessible data and the logic of configurational analysis, which is designed to discover combinations of variables that result in regulatory authorisation as a distinct outcome. By analytically separating regulatory enablement from downstream behavioural uptake, the study avoids conflating institutional gatekeeping with individual demand while still making a direct contribution to the broader literature on insurance adoption by identifying the structural preconditions for uptake.
Together, these proxies capture the regulatory environment’s capacity to mitigate behavioural frictions, rather than the behavioural constructs themselves. All interpretations in the ‘Results and discussion’ section, therefore, refer to how institutional arrangements enable or constrain behavioural tendencies, not to psychological states observed at the household level. The full coding of all conditions and outcomes for each country is provided in Appendix B (Table B1), while the behavioural constructs and proxy logic are presented in Table 1.
Condition definitions, behavioural constructs and proxy logic

Socioeconomic and institutional classification of the sample developing economies
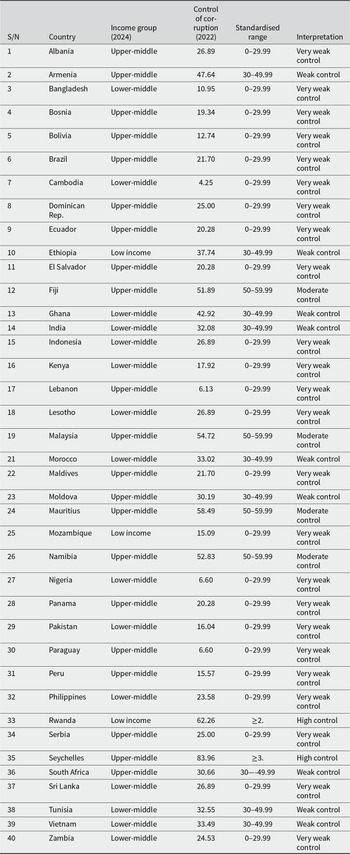
To examine the socioeconomic and institutional variations among 40 developing countries, we use two measures: income groups and levels of corruption control (see Table 2). We classify these countries into low-income, lower-middle-income, upper-middle-income and high-income groups, as defined by the World Bank Income Group (2024).
Socioeconomic and institutional variations
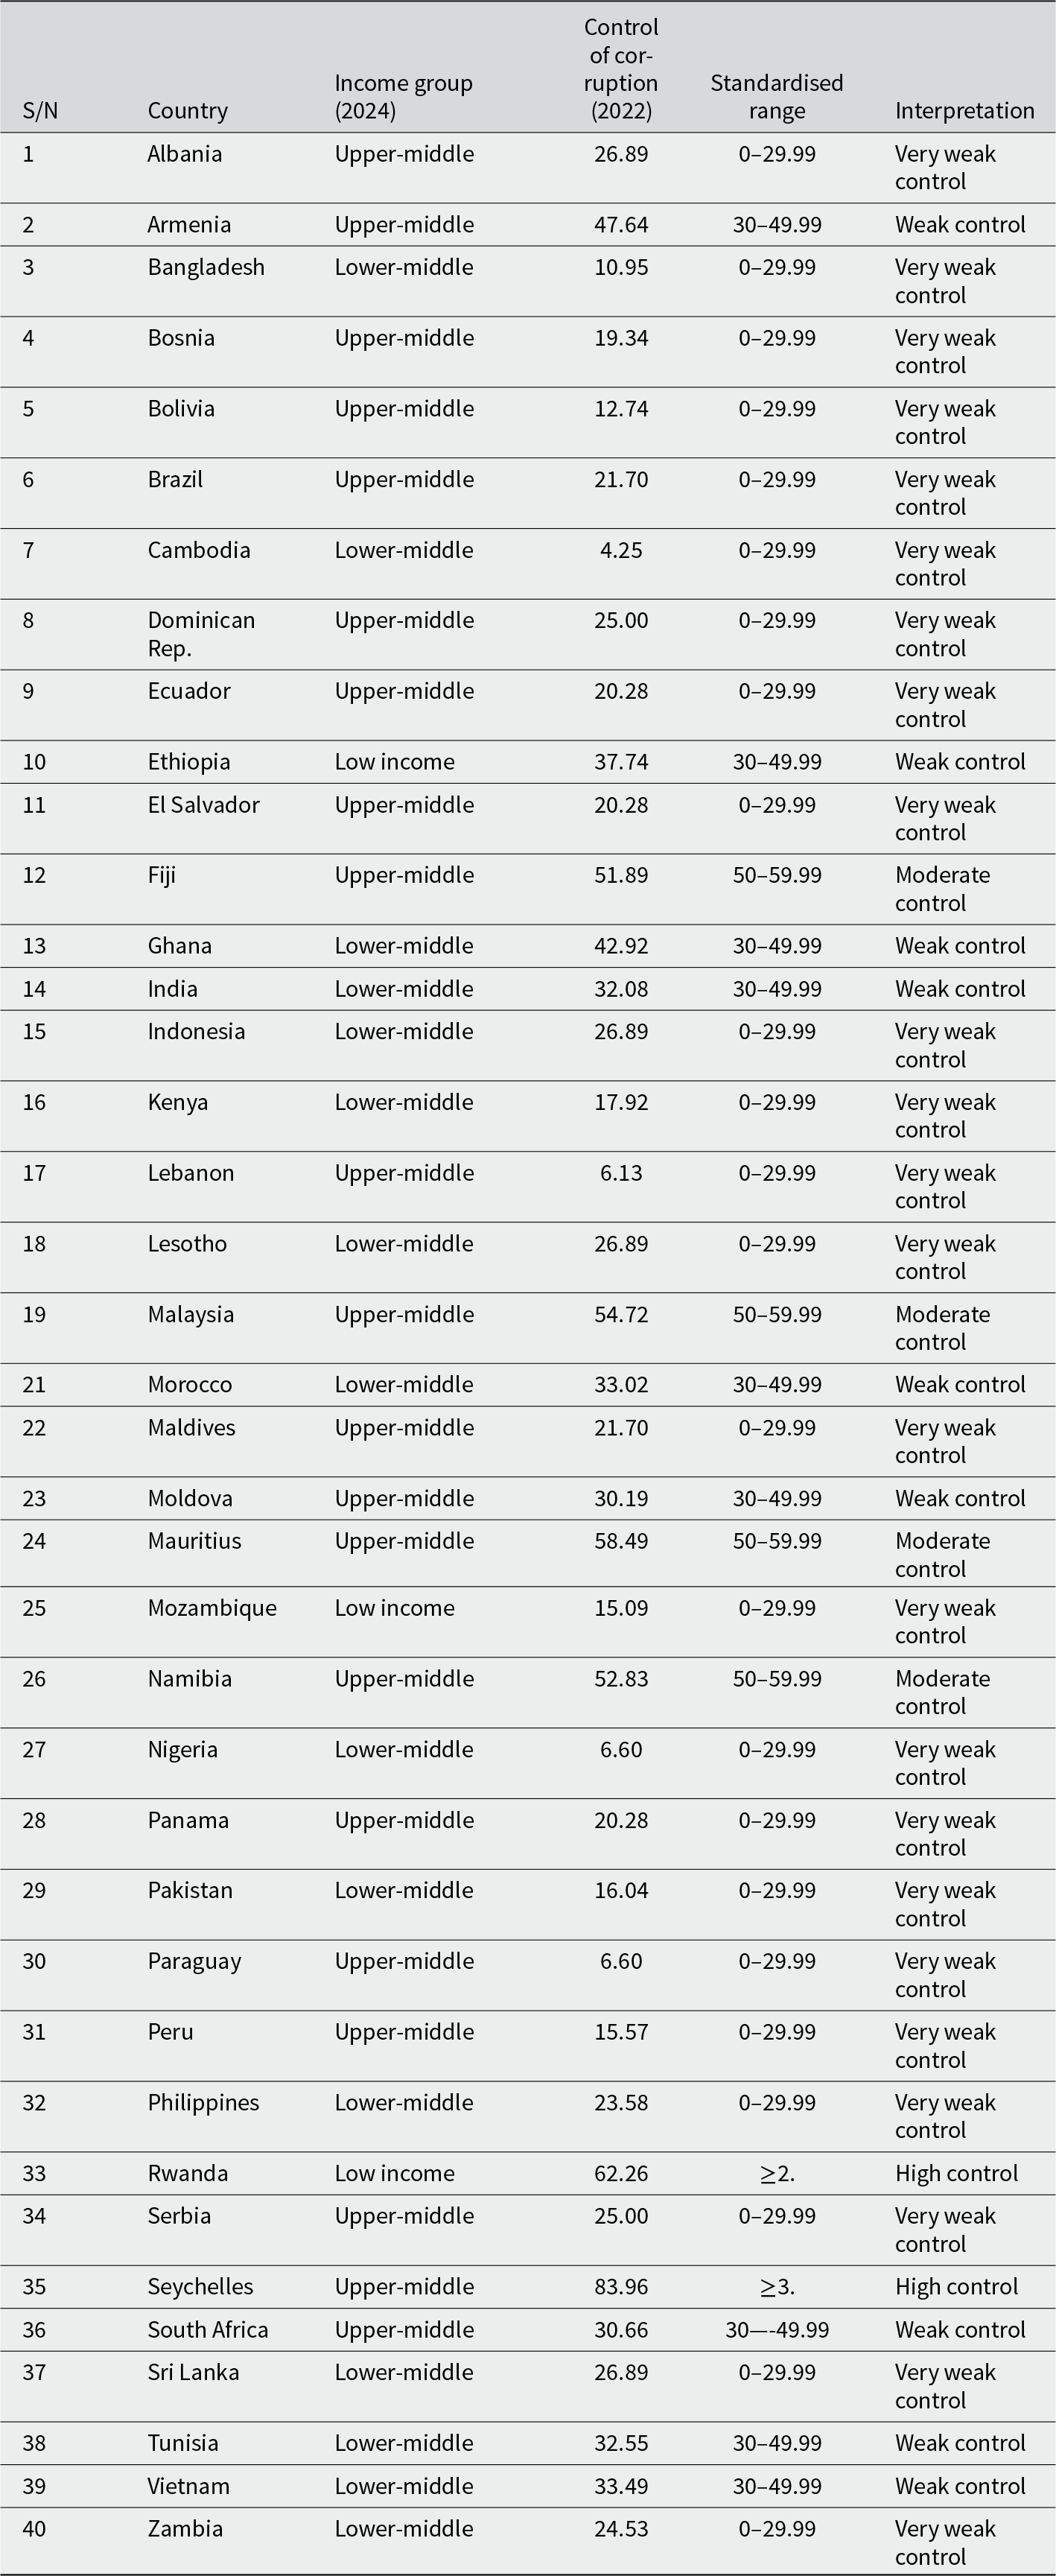
Note: Control of corruption is measured using the World Governance Indicators percentile rank (0–100). Thresholds are defined to reflect meaningful institutional quality groupings rather than equal-width statistical intervals. Scores below 30 indicate very weak control of corruption, 30–49.99 reflect weak institutional control, 50–59.99 represent moderate control and scores of 60 and above denote high control of corruption. This asymmetric categorisation captures the non-linear distribution of governance quality across developing economies.
Based on institutional differences, countries are further categorised according to their control of corruption percentiles (World Governance Indicators, 2023). The groupings reveal that most countries exhibit very weak control of corruption. Additionally, most of the developing countries in the sample fall within the lower-middle- and upper-middle-income categories. These classifications are descriptive and highlight structural and institutional patterns that influence how insurance markets operate across different economies. Percentile ranges for control of corruption have been standardised (see Table 2). Categories with fewer than four cases (n ≤ 4) are flagged as small-n groups as limited membership may exaggerate apparent patterns.
Distinguishing countries by socioeconomic class helps clarify why nations with different income levels exhibit distinct characteristics, behaviours and insurance needs. Comparing developing countries based on their ability to curb corruption provides insights into their capacity to address unethical practices in insurance markets, such as delayed settlements, policy cancellations and unauthorised deductions. This socioeconomic and institutional comparison can reveal unique challenges and opportunities for insurance sector growth.
Results and discussion section
Pre-estimation analysis: comparative descriptive analysis
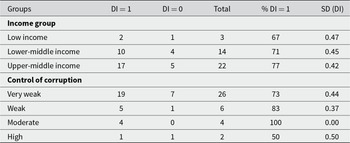
Table 3 presents the prevalence of DI by income group and control of corruption (Panel B). Low-income countries exhibit 67% DI presence, lower-income countries show 67% DI presence and upper-middle-income countries indicate 77% DI presence. These countries vary slightly in DI prevalence (SD = 0.47, SD = 0.42, SD = 0.45). The standard deviation is lowest in higher-income countries, indicating greater consistency within the income group.
Distributed insurance

Note: SD stands for standard deviation
Across governance levels, countries with high corruption control capacity are the fewest among developing countries, with only two countries showing the presence, while the others show the absence of DI (DI = 1, DI = 0). Countries with very weak control of corruption have the highest number of countries with 73% of DI presence and the highest variation (SD = 0.37–0.44). There are four countries with moderate control of corruption, and all four have DI regulatory prevalence (D1 = 100%) and no variation (SD = 0.00). However, the countries with the highest variation (SD = 0.53) have the lowest DI presence, with 5 out of 9 having institutional permissions. Notwithstanding, across all developing countries, the majority have DI.
Initial condition screening: necessity analysis
Necessity analysis is a fundamental component of QCA that identifies conditions necessary for an outcome to occur. This analysis examines the relationship between X and Y, determining whether X (the explanatory variable, also known as the condition) is necessary to explain Y. A condition X is considered necessary for an outcome Y if the consistency score is 0.90 or higher (X⊃Y), indicating that the outcome rarely occurs in the absence of the condition. A condition is considered sufficient if its consistency score is 0.80 or higher than 0.80 (X⊂Y), highlighting that the outcome usually occurs in the presence of the condition. We assess the relationship between transparent pricing, the PCS, deposit insurance coverage and limitations on early repayment penalties as necessary conditions for insurance uptake in developing countries.
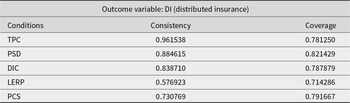
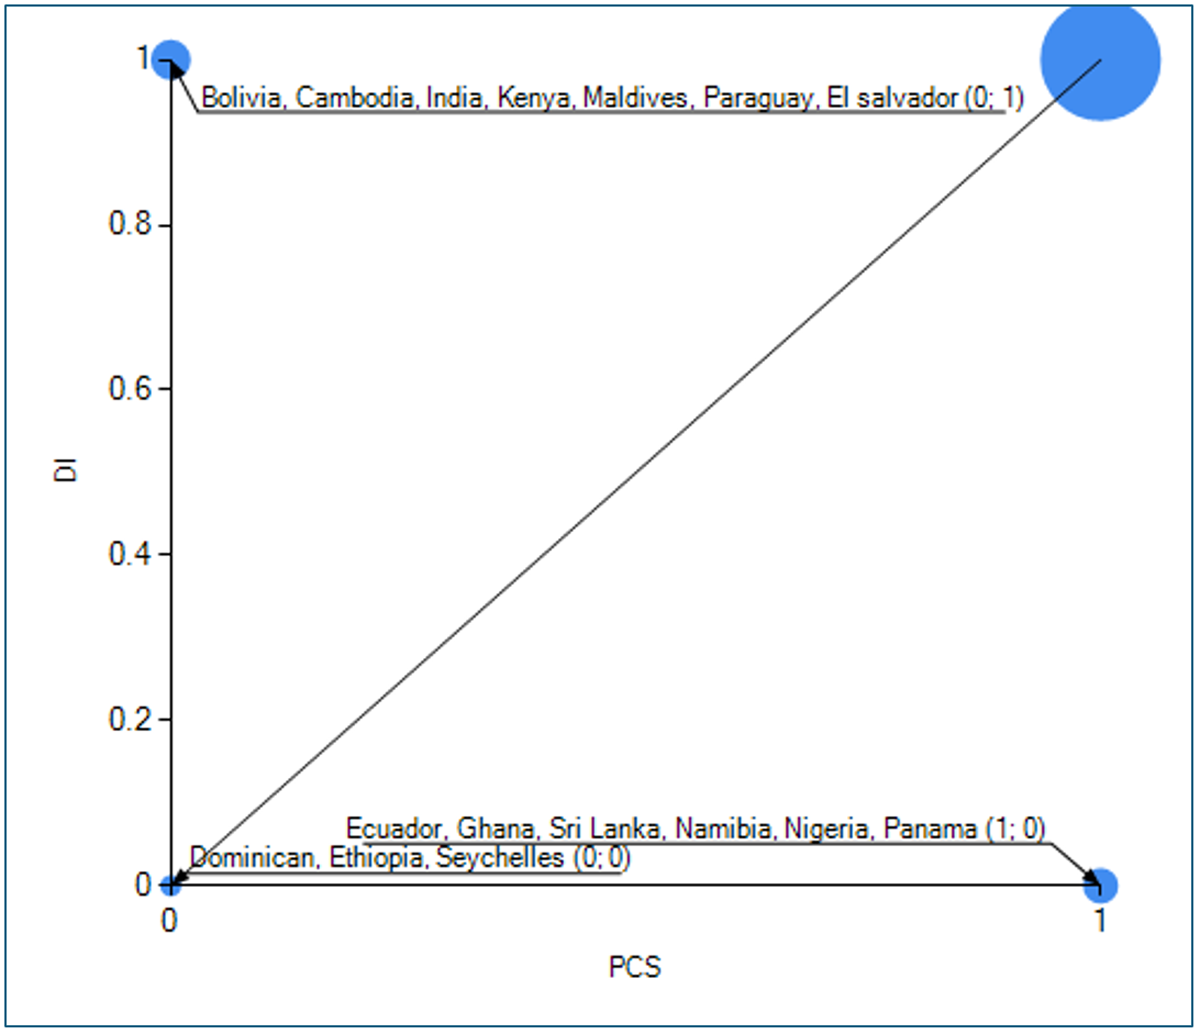
The results of the necessity analysis are presented in both tabular form (Table 4) and graphically (Figures 2–6), where the condition (X) is plotted against the outcome variable (Y), showing countries with the outcome (1) and without it (0). TPC is highly consistent with DI: in almost all cases where TPC was present, DI was also present. It can be regarded as a near-necessary condition. TPC accounts for a large proportion of DI occurrences (78%). PSD is highly consistent with DI, appearing frequently when DI = 1, with a coverage of 82%. DIC is moderately necessary, present in 84% of cases when DI = 1. Its coverage suggests that it explains a substantial proportion of DI cases (78%). LERP is not strongly necessary; it is present in only 58% of DI = 1 cases, with a coverage of 71%. It is weak as a necessity. PCS is below 75% acceptable consistency, with 79% of cases covered (DI = 1), so it is not strictly necessary, but it does contribute meaningfully.
Necessity analysis

Source: Author’s computation (2025).
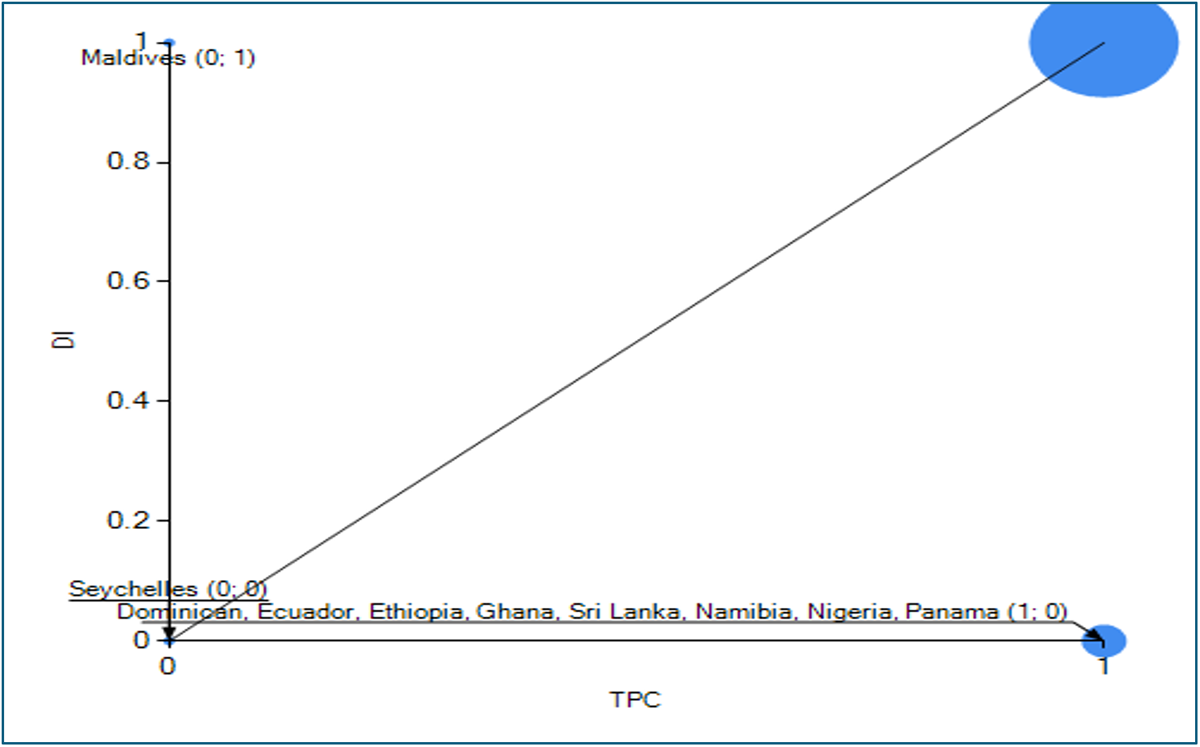
X (transparent pricing) and Y (distributed insurance). Consistency: 0.96, Coverage: 0.78.

X (pre-contractual stage) and Y (distributed insurance). Con:0.73 Cov:0.79. (a) In the necessity analysis diagram, Con means consistency, while Cov means coverage.

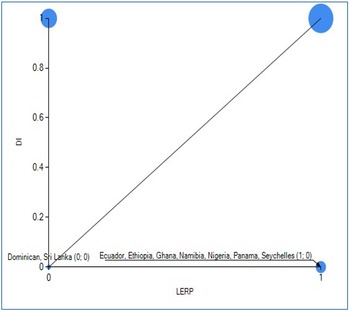
X (limitations on early repayment penalties) and Y (distributed insurance). Con:0.57 Cov:0.71.

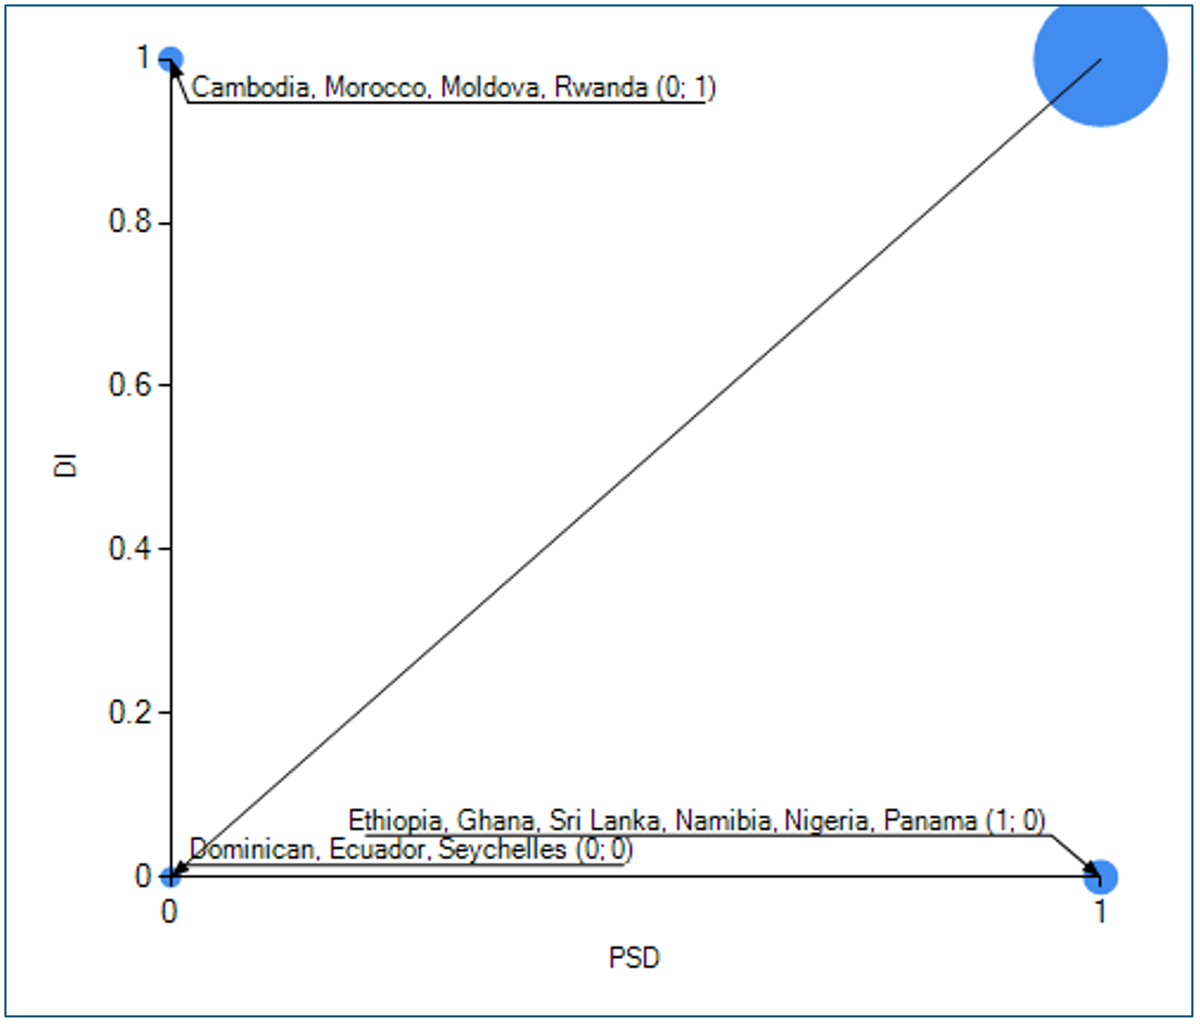
X (product suitability and design) and Y (Distributed Insurance). Con:0.88 Cov:0.82.

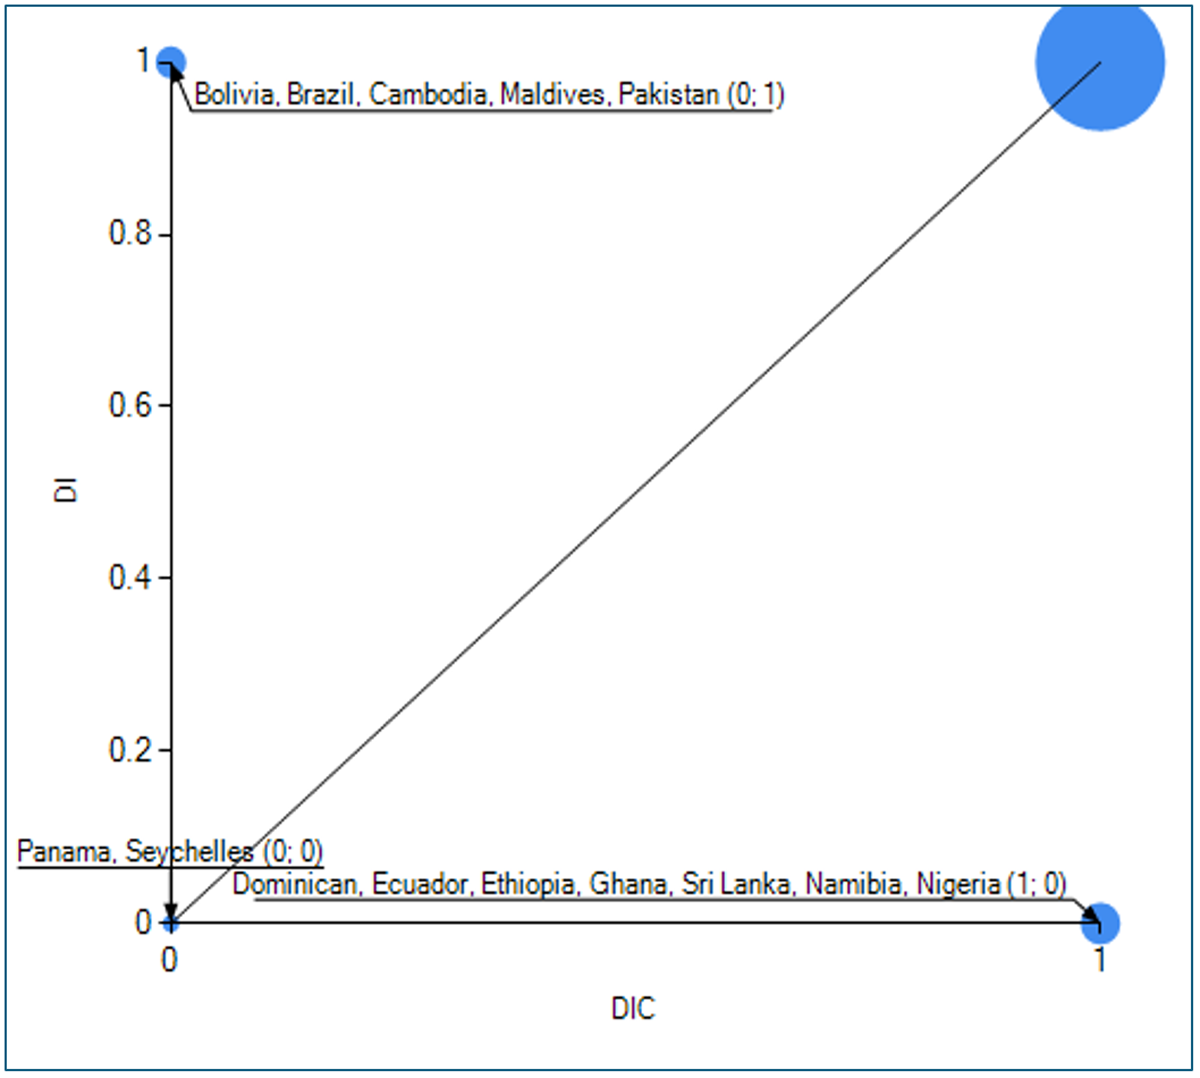
X (Deposit Insurance Coverage) and Y (Distributed Insurance). Con:0.83 Cov:0.78.

We visualise the set-theoretic relationship between the condition and the outcome using an XY-plot to identify the specific cases for which this relationship holds (see Figures 2–6). These plots were generated using the TOSMANA software, as shown in Figures 3–7. In these plots, the data points cluster in the four corners (top left: 0,1; top right: 1,1; bottom left: 0,0; bottom right: 1,0).Footnote 1 For a condition to be necessary, most cases in which the outcome is present (Y = 1) must also have the condition present (X = 1), as shown in the top-right corner. The visualisation aids in mapping each case to determine whether a condition is necessary for the outcome.
However, there are variations in consistency, as TPC and DIC are highly consistent in some countries but not in others. The Maldives is the only outlier in terms of coverage (TPC = 0, DI = 1), making it a deviant case. Even in conditions with high consistency, such as DIC and PCS, there are numerous typical examples (e.g., Bolivia and Cambodia), suggesting that, while essential, their consistency is more context-dependent. Some of these countries are deviant cases, showing the presence of the outcome but the absence of the necessary condition (see Figures 2, 3, 4 and 6). In the Maldives, the narrative rationale for deviance is likely linked to inefficiencies in dual insurance, whereas in countries such as Brazil and India, which appear in the XY-plots as illustrative cases exhibiting partial or context-specific deviations, companies still experience data limitations, use complex language that obscures pricing details, and face regulatory implementation challenges. The necessity deviance mapping is presented in Table 5.
Necessity deviance mapping (DI = 1 cases where Condition is 0)

Note: CON stands for conditions.
Graphical presentation of the necessity analysis
Main results: comparative csQCA of co-occurring regulatory permissions
This section employs a truth table (see Table 6) to analyse combinations of conditions that lead to insurance regulatory permissions in developing countries. Based on existing research, we set the consistency threshold at 0.8 and the case frequency threshold at 2. Configurations with consistency scores of 0.9 or higher are considered consistent, while those with scores between 0.8 and 0.89 are regarded as sufficient. According to Ragin (Reference Ragin2008) and Schneider and Wagemann (Reference Schneider and Wagemann2010), values of 0.75–0.79 represent moderate consistency, 0.80–0.89 represent high consistency and values of ≥0.90 represent very high consistency, while 1 represents perfect consistency. Table 3 presents the truth table results for all socioeconomic and institutional groups, and Figure 7 displays a Venn diagram for visual analysis.
Truth table analysis

Note: Contradictory configurations (where identical institutional conditions lead to different regulatory outcomes) were handled by applying a consistency threshold of 0.80 during Boolean minimisation, ensuring that only robustly supported pathways are included in the final solution.
Author’s Construct (2026).
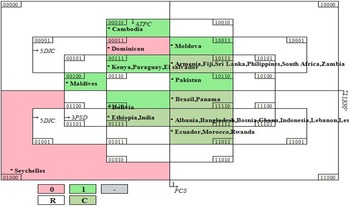
Venn diagram corresponding to Table 2 (32 conditions). Venn diagram produced by the ‘visualizer’ tool, TOSMANA.

CaseID: 00111
Lower-middle and upper-middle; mostly very weak institutions: Kenya, Paraguay and El Salvador
Kenya, El Salvador and Paraguay exhibit perfect consistency in distributed insurance, demonstrating how the presence of PSD, TPC and DIC is associated with distributed insurance in the absence of PCS and LERP (see Table 4). In weak-governance contexts, trust-enhancing rules, such as TPC and DIC, along with clearer product design, such as PSD, reduce perceived ambiguity and bolster confidence in the market architecture. Several studies support the idea that clarity of information regarding product designs, credibility and transparency is more important than macro-governance in specific contexts. For example, Giné et al. (Reference Giné, Townsend and Vickery2008) find that contract clarity and institutional trust significantly influence insurance participation in developing countries. Similarly, Cole et al. (Reference Cole, Giné and Vickery2013) demonstrate that trust in providers and an understanding of contracts are crucial factors in contexts where formal institutions are weak. Cai et al. (Reference Cai, de Janvry and Sadoulet2015) also argue that improved contract design and credibility mechanisms increase insurance demand in low-trust settings. Dercon et al. (Reference Dercon, Hill, Clarke, Outes-Leon and Taffesse2014) suggest that institutional credibility and rule clarity serve as substitutes for weak enforcement environments in insurance markets.
These studies suggest that in lower-middle-income environments, poor foresight at sign-up can be mitigated provided premiums are tailored to remain cheap for low-income earners and payment mechanisms are properly described. Aligning goods with the demands of various socioeconomic strata also improves insurance distribution. Simplifying product architecture, clarifying cost adjustments and ensuring transparency remain critical strategies for sustaining distribution permissions.
CaseID: 10111
Lower and upper middle income; mostly weak/very weak institutions; Armenia, Fiji, Sri Lanka, Philippines and South Africa, Zambia
The presence of PCS, PSD, TPC and DIC is associated with distributed insurance even in the absence of LERP (row code = 10111). Although this combination shows high consistency, 50% of its cases are from upper-middle-income countries, such as South Africa, Fiji and Armenia, while the other 50% are from lower-middle-income countries, including Zambia, Sri Lanka and the Philippines, with only one country, Fiji, exhibiting moderate control of corruption. This shows that PCS serves as an institutional mechanism that reduces short-term decision-making frictions typically associated with myopia in weakly or moderately institutionally developed countries, irrespective of their income status. When combined with trust-building protections (TPC, DIC), this institutional combination provides clarity and predictability, allowing distribution permits to be more consistent with long-term benefit environments. This outcome corroborates Guan and Gong’s (Reference Guan and Gong2024) discovery that trust is positively linked to the completion of financial contracts, increasing stock market involvement and insurance acquisition. Trust minimises temporal discounting and short-term bias, allowing for better informed decisions (Jachimowicz et al., Reference Jachimowicz, Chafik, Munrat, Prabhu and Weber2017). Transparency and trust can significantly improve investor confidence and decision quality.
CaseID:11111
Seventeen countries, mixed income, mostly weak institutions
This group of countries sharing the same combination of conditions shows that, across diverse socio-economic and institutional environments, PCS, LERP, DIC, TPC and PSD are sufficient to produce distributed insurance. These institutional conditions simultaneously strengthen disclosure, flexibility, product clarity and credibility. While not direct measures of behaviour, this combination forms an institutional environment that reduces typical behavioural frictions – myopia, distrust and ambiguity – thereby supporting the regulatory conditions under which distributed channels are authorised.
Although these cases involve countries in Africa, Asia and Europe, they share a common set of conditions that lead to distributed insurance, as 88% of these 17 countries exhibit it. This pattern suggests that regional differences, economic structure, income levels and institutional standing do not preclude the emergence of distributed insurance when a structured pricing system and product suitability are in place.
CaseID: 11011
Mixed income with very weak institutions: Ecuador, Morocco and Rwanda
In this group, the combination of conditions is consistently associated with distributed insurance among two upper-middle-income countries and one lower-middle-income country, with two having very weak control over corruption (Ecuador and Morocco) and one having firm control of corruption. In this category, the presence of PCS, LERP, TPC and DIC enables distributed insurance even when PSD is absent. Although PSD is absent, governance quality in countries like Rwanda functions as a substitute, reducing perceived ambiguity. In countries with weaker governance, disclosure and trust cues still contribute to an institutional environment that offsets behavioural frictions, even when a single ambiguity-reducing safeguard is missing. Even where certain theoretical expectations regarding PSD and LERP were not met in this specific configuration, which highlights that the presence or absence of these conditions interacts with others in ways that traditional linear logic may overlook. In simple terms, it shows that while some conditions are precisely what is expected, the overall requirements for encouraging distributed insurance are more diverse and complex than what the theories suggest.
Furthermore, within this group, the consistency of the identified condition combinations is 66%, which falls below the minimum threshold typically required for acceptable consistency in QCA analysis. The combination of conditions held across two countries – Morocco and Rwanda – indicating that additional conditions or contextual factors may be necessary to account for distributed insurance fully.
CaseID: 11110
Upper-middle-income countries with very weak institutions: Brazil and Panama
This group is composed of countries with the same income and institutional level; the outcome is present in 1 and absent in the other (Brazil 1; Panama 0). These contextual differences highlight within-case configuration heterogeneity, with 50% consistency, which does not meet the minimum threshold established by Ragin (Reference Ragin2008).
CaseID: 01111
Low-middle-income and lower-middle-income with very weak institutions: Ethiopia and India
There are just two cases in this group, resulting in 50% consistency. 1 exhibits a contradiction to the other in terms of the outcome, with 1, indicating the presence of distributed insurance and the other indicating its absence. This just highlights the economic heterogeneity within both countries, even though they share similar institutional dynamics (weak control over corruption).
Contextual comparison by income level and institutional strength
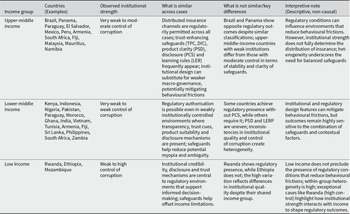
While the csQCA results identified minimised solution terms associated with distributed insurance, examining how observed configurations cluster across income groups and levels of institutional quality is important for contextual clarity. This section, therefore, undertakes a contextual comparison of countries grouped by their income status and control of corruption. This comparison is drawn from the truth-table analysis (see Table 7).
Comparison by income and institutional status

Cross-group Boolean minimisation
To eliminate redundant solutions – where the presence or absence of a condition does not alter the outcome – a Boolean minimisation was conducted. This logical reduction simplified all six configurations.  ${\text{Boolean minimisation}} = (\sim PCS\,\, \cap \sim LERP \cap PSD \cap TPC \cap DIC) \cup $ $(PCS\,\, \cap \sim LERP \cap PSD \cap TPC\,\, \cap \sim DIC)\,\cup $ $(PCS\,\mathop \cap \,LERP\,\mathop \cap PSD \cap TPC \cap DIC) \cup \left( {\,PCS \cap LERP\, \cap \sim PSD \cap TPC \cap DIC} \right) \cup \left( {\,PCS \cap LERP \cap PSD \cap TPC \cap \sim DIC} \right)\, \cup \left( {PCS \cap LERP \cap PSD \cap TPC \cap DIC} \right)$. From the Boolean minimisation, TPC and PSD (five out of the six configurations) are consistently present, suggesting they are important contributors to institutional settings that reduce behavioural frictions, although no single requirement is necessarily required in all circumstances. The minimised Boolean solutions identify combinations of conditions sufficient to support distributed insurance across income groups, without implying actual household adoption.
To eliminate redundant solutions – where the presence or absence of a condition does not alter the outcome – a Boolean minimisation was conducted. This logical reduction simplified all six configurations. Among the six configurations producing distributed insurance, one (00111) shows perfect consistency, while two (10111 and 11111) show high consistency, indicating a strong alignment between institutional conditions and regulatory authorisation regarding permissions for distributed insurance.
Visual representation
The truth table analysis is illustrated in a Venn diagram (Karnaugh map) with 32 zones, 25 of which represent specific conditions (see Figure 7). Green zones mark consistent configurations in which the outcome (distributed insurance) is present; C denotes cases that share the same conditions but have different outcomes; and R identifies logical remainders. The red zones represent the absence of the outcome. The Venn diagram makes it easier to identify patterns, contradictions and gaps at a glance, which may not be as immediately visible in the tabular truth table format.
The Karnaugh map helps visualise the configuration space of the five conditions. The appearance of empty or sparsely populated cells reflects the well-known issue of limited diversity in medium-n QCA (Ragin, Reference Ragin2008; Schneider and Wagemann, Reference Schneider and Wagemann2012). However, 32 configurations are logically possible with five binary conditions; only a subset is empirically observed in the sample of 40 countries. Only configurations linked to the presence of distributed insurance (DI = 1) were retained for minimisation, except for the idiosyncratic rows (countries with perfect consistency, but are outliers). Configurations linked with the lack of the outcome were removed from the minimisation process. The whole truth table is presented in Appendix A1.
From the mapping, distributed insurance is absent in the Dominican Republic and Seychelles. These two countries lack empirical cases because they do not fit into any configuration; Kenya and Paraguay, however, display consistent configurations for the presence of distributed insurance. Three countries appear in consistent configurations, 23 in sufficient configurations (high consistency with few contradictions) and seven in contradictory configurations (see Appendix B). Cambodia, the Maldives and Moldova are single-country configurations. They are insufficient to draw empirical inferences from (Schneider and Wagemann, Reference Schneider and Wagemann2007). In contradictory cases, 42.86% report no distributed insurance, while 57.15% report distributed insurance.
Configurations of myopia, ambiguity aversion and distrust in regulatory permissions for insurance distribution
The intermediate solution (M1) for distributed insurance shows different patterns of core and peripheral conditions across two configurational paths. It indicates their central role in producing the outcome (DI). Based on theory and empirical patterns in our truth table, we specify the following expectations for the intermediate solution. TPC is expected to promote DI adoption (+), PSD is expected to promote DI adoption (+), DIC is expected to promote DI adoption (+). PCS is expected to promote DI adoption (+), while LERP is expected to promote DI adoption through its absence (−). We include only remainders consistent with these DEs during minimisation, that is, configurations that align with TPC, PSD, DIC and PCS being present and LERP being absent. Remainders contradicting these directions (e.g., LERP being present with all other enablers) are excluded from the intermediate solution.
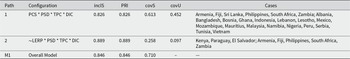
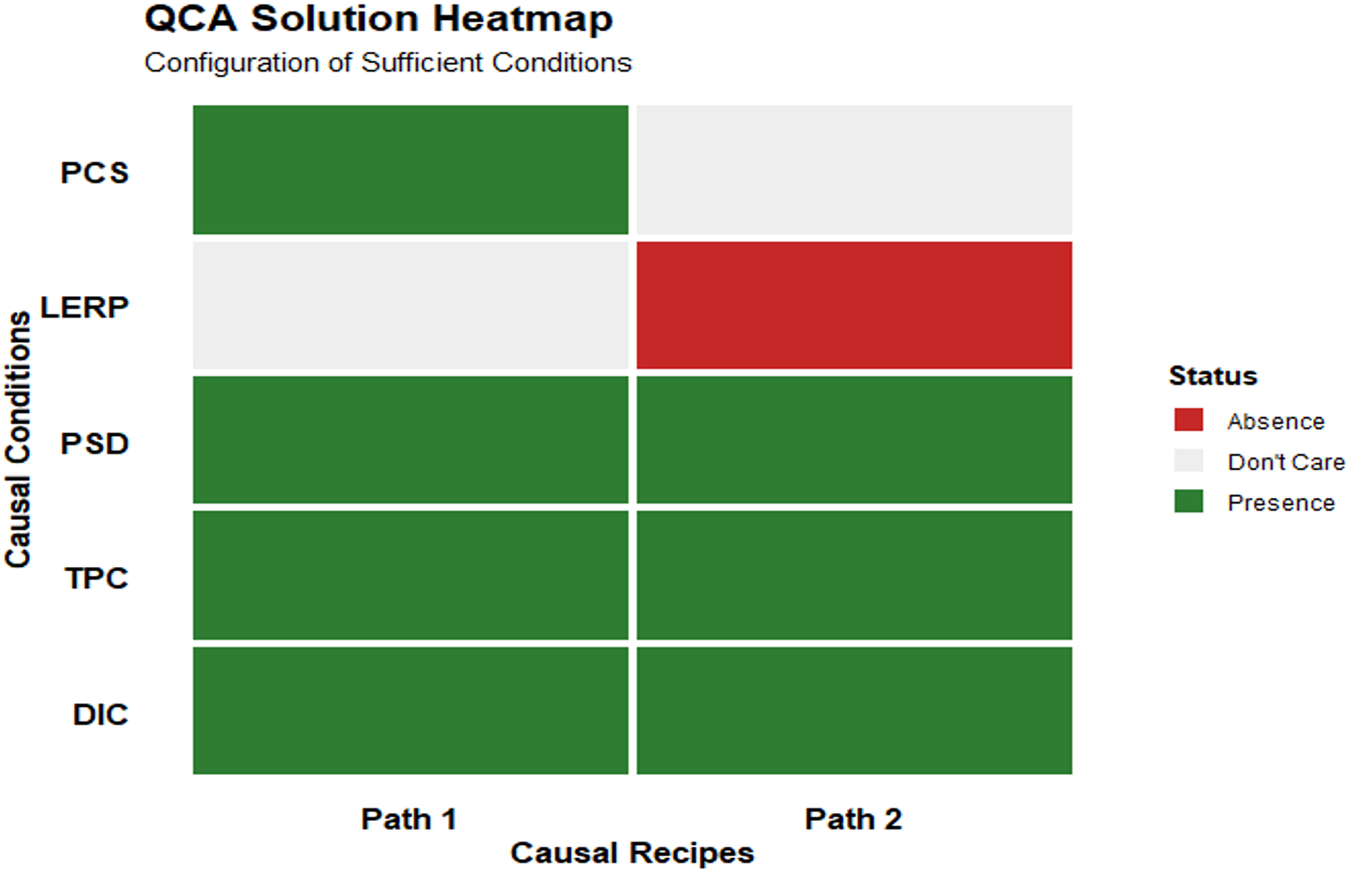
Regarding the configuration paths, we present the two paths identified by the intermediate solution in a table, a heatmap and XY plots that show the sufficiency of a causal configuration (path) for the outcome (see Table 8 and Figures 8–12). A combination of TPC, DIC and PSD was observed across both paths (see Figure 5). These conditions form the core configuration set that is consistently linked to distributional insurance across both pathways. The heatmap confirms the presence and absence of both paths. As expected, LERP meets the peripheral condition, as it showed an absence of path and was irrelevant in path 1. PSD was also irrelevant in Path 2.
Configuration paths

Note: InclS mean consistency of sufficiency, PRI means proportional reduction in inconsistency, covS means solution coverage and covU means unique coverage.
QCA heatmap showing causal conditions.

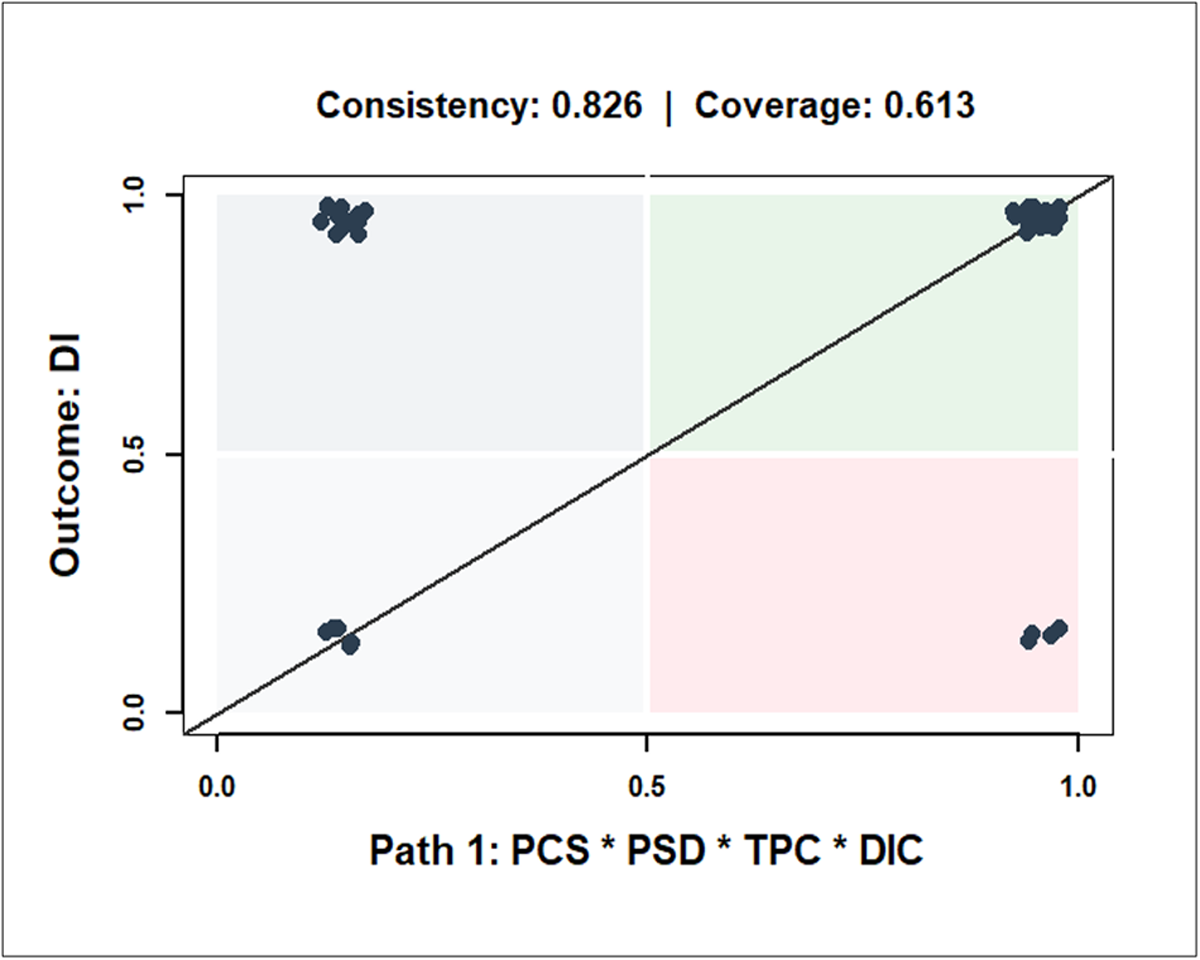
Configuration path 1 (scatterplot).

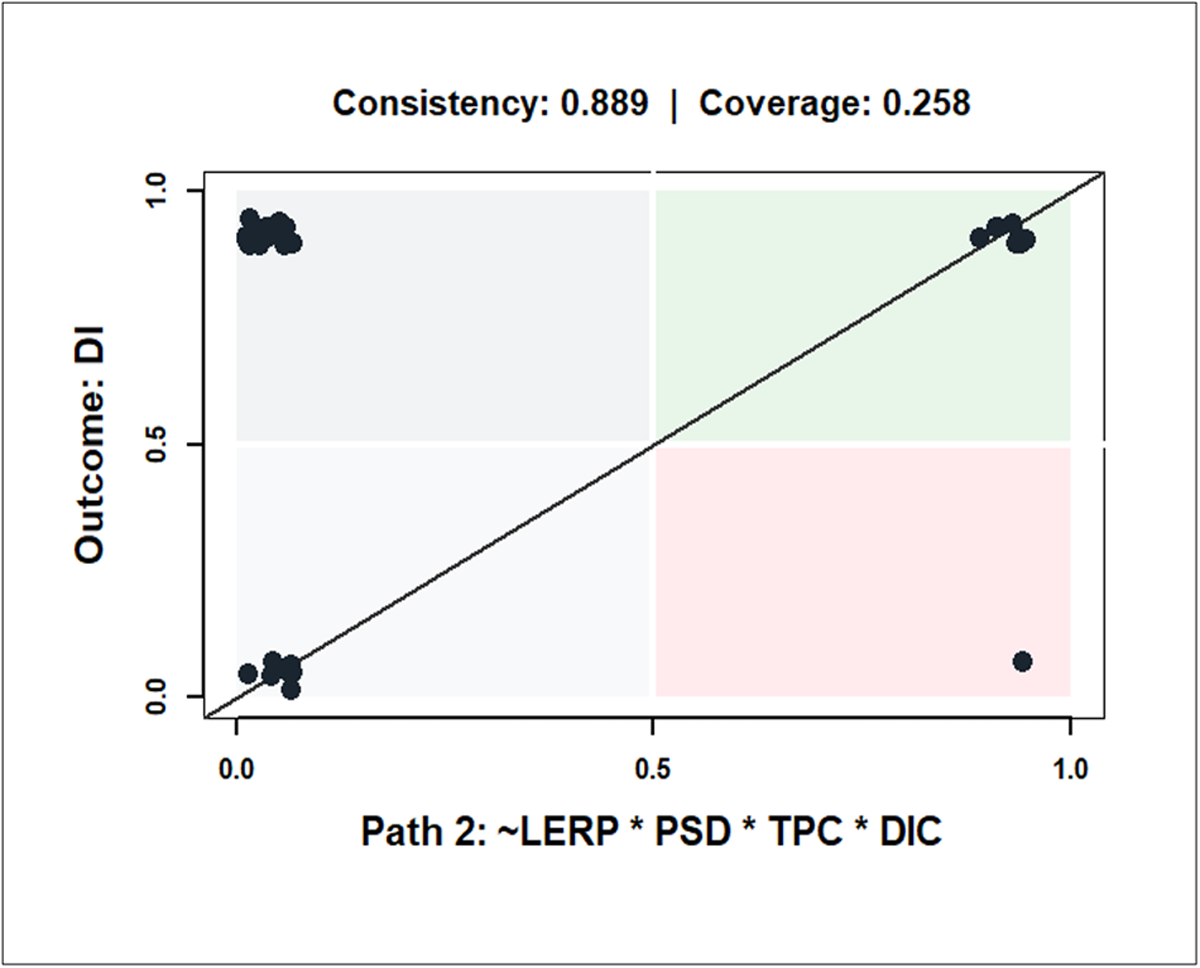
Configuration path 2 (scatterplot).

Both configuration paths are portrayed using consistency of sufficiency (inclS), the proportional reduction in inconsistency (PRI), solution coverage (covS) and unique coverage were actually noted in Table 8. Consistency of sufficiency (inclS) measures the extent to which cases sharing a given configuration also exhibit the outcome, indicating how reliably a configuration can be considered sufficient for the outcome. Proportional reduction in inconsistency (PRI) captures the extent to which a configuration is associated with the presence of the outcome. Solution coverage (covS) measures the proportion of cases explained by the configuration, while unique coverage (covU) measures the proportion of cases uniquely explained by each path. High consistency and PRI values, therefore, signal reliable sufficiency, while coverage metrics reflect the empirical relevance of each pathway.
The PRI score shows that for path 1, 82.6% of the inconsistent cases that would weaken this configuration have been eliminated. This means the path is strongly associated with the presence of the outcome rather than its absence. Path 2 is the stronger path, with 88.9% of reduction in inconsistency. The overall model has a PRI value of 84.6%, indicating that the combined solution has a high ability to avoid contradictory patterns. The result for the unique coverage (covU) shows that in path 1, 45.2% of the outcome cases are explained by this configuration alone. This is a very strong and substantively important path. For path 2, only about 9.7% of the outcome is uniquely explained by this path. Most of its cases overlap with Path 1, meaning it is more of a complementary or reinforcing pathway than a dominant one.
For consistency of sufficiency (InclS), the results show that about 82.6% of the cases that strongly exhibit this configuration also show the outcome. This is a reliable and sufficient path. Path 2 shows a consistency of 88.9%, which is higher than that of Path 1. The model reliably explains DI across all cases (84.6%). The model is not only consistent, but also shows that one pathway carries most of the empirical weight, while the second mainly reinforces or complements the first.
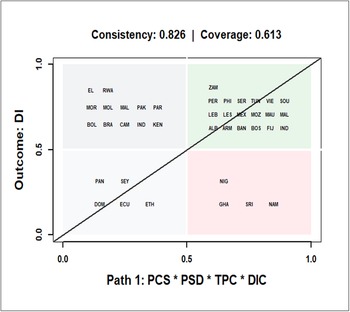
The cases covered in these parts are illustrated through dots on the scatterplot (see Figures 5 and 6). The scatterplot shows the relationship between membership in Path 1 (PCS * PSD * TPC * DIC) on the horizontal axis and the outcome (DI), on the vertical axis. Each dot represents a country. Dots in the top-right quadrant indicate countries that firmly belong to both the configuration and the outcome, meaning the pathway is present and distributed insurance is also present. The dots in the top-left quadrant denote countries that strongly show the presence of the outcome but the absence of the configuration. The Bottom-right quadrant shows countries that belong to the configuration but not to the outcome, while the Bottom-left quadrant displays the countries that belong neither to the configuration nor to the outcome. Together, these patterns explain why paths 1 and 2 show high but not perfect consistency. The countries that cover each of these quadrants are displayed in Figures 11 and 12.
Configuration path 1 (countries).

Configuration path 2 (countries).

The configurational analysis shows that DI is not consistently influenced by a country’s economic or institutional status. While combinations of core conditions strongly promote DI, the XY plots (Figures 5 and 7) reveal that several countries deviate from these pathways. Specifically, cases falling in the lower-right quadrant (e.g., Nigeria and Ghana in Path 1) possess the causal configuration but do not exhibit high DI levels. This indicates that DI is country-specific and suggests that localised socio-economic factors, alongside regulatory permissions, play a role in shaping outcomes. This aligns with Wang et al. (Reference Wang, Song, Ding, Gong, Iwasawa, Matsuo and Guo2025), who highlighted that factors such as ambiguity about occurrence probabilities vary significantly by location and specific hazards.
The empirical results largely align with directional expectations. Of the 31 countries characterised by distributed insurance (DI = 1), only 10 (≈32%) exhibited an absence of LERP, suggesting that the anticipated negative influence of LERP lacks strong empirical support in this sample. Conversely, core conditions were highly prevalent among DI = 1 cases: TPC was present in 30 countries (≈97%), PSD in 29 (≈94%), PCS in 26 (≈84%) and DIC in 25 (≈81%). These high frequencies strongly confirm the expected positive influence of these conditions on insurance uptake (see the Appendix, Table D1). This confirms the positive directional expectations for the TPC, PSD, DIC and PCS as conditions with core roles, as they are largely observed in the configurations being present in most cases, while the expected negative influence of LERP is less pronounced in most cases, confirming its peripheral role in path 2. The overall solution shows that both configurational pathways combined are linked to distributed insurance-M1: PCSPSDTPCDIC + ∼ LERPPSDTPCDIC → DI.
Discussion and conclusion
This study moves beyond the fragmented treatment of behavioural biases in insurance uptake research by demonstrating how regulatory permissions for distribution (DI) interact with institutional and product-level conditions in shaping distributed insurance patterns across diverse developing country contexts. The csQCA results underline that there is no universal pathway to insurance distribution; rather, context-specific configurations of regulatory permissions and institutional factors determine success.
The necessity of transparent pricing for policymakers and regulators suggests that disclosure and simplicity of insurance products are crucial steps for regulatory permissions for distribution. If consumers don’t understand the price of insurance products or perceive a certain hidden pricing policy, they may be discouraged. The sufficiency of product suitability as a condition for distributed insurance indicates that insurance products should be aligned with regulatory standards to meet the needs of low-income households. Structuring microinsurance with flexible schedules can facilitate compliance and enable distribution under DI, addressing potential barriers in product deployment.
Two insights stand out. First, transparent pricing, DIC and product suitability stand as core enabling conditions across all income and institutional groups. Yet, their influence is contingent on complementary conditions. In low-income countries with weak institutions, insurance adoption is productive in contexts where behavioural frictions, such as present bias, are addressed through flexible repayment schedules, immediate coverage benefits and clear communication. In stronger institutional settings, trust and enforcement credibility can offset gaps in product diversity, as illustrated by Rwanda’s deviation from the general low-income pattern. In middle-income contexts, transparency acts as the primary trust-building mechanism, particularly when institutional credibility is partial.
Two insights emerge from the intermediate solution (M1) for distributed insurance. First, transparent pricing, deposit insurance coverage and Product suitability and design form the core conditions consistently enabling distributed insurance, but their influence depends on complementary arrangements, with peripheral conditions such as Limitations on Early Repayment Penalties playing a variable role across paths. In countries with weaker institutional frameworks, distributed insurance is realised primarily when regulatory permissions are clearly defined and aligned, allowing distribution channels to function even when some peripheral conditions are absent. In stronger institutional contexts, the same core conditions can sustain distributed insurance despite the irrelevance of certain peripheral factors, illustrating how institutional credibility and enforcement interact with regulatory permissions to shape outcomes. Second, the configurational pathways reveal that distributed insurance is highly context-specific: countries with similar economic or institutional profiles may deviate from general patterns, suggesting that local regulatory alignments, socio-economic conditions and institutional capacities jointly determine the presence and effectiveness of distributed insurance. These findings highlight the need for policy approaches tailored to country-specific configurations rather than assuming uniform mechanisms.
From a development policy standpoint, these findings reinforce that scaling insurance uptake is not solely a matter of financial literacy campaigns or regulatory reforms. It requires fit-for-context combinations that address behavioural frictions, ensure affordability and build institutional trust. Embedding such configurations into market expansion strategies advances SDG 1 by protecting against poverty shocks, SDG 3 by improving health and well-being through risk pooling, and SDG 10 by reducing coverage gaps among disadvantaged groups.
Future research should extend this configurational analysis to specific insurance submarkets and examine whether these regulatory pathways (DI) persist under climate-related or other sector-specific risk scenarios. By considering how regulatory permissions interact with institutional capacities and socio-economic conditions, policymakers can design interventions that strengthen distribution channels, improve the effectiveness of insurance deployment and enhance the resilience and inclusivity of insurance systems in developing economies.
Limitations of the study
The cases in this study did not include the Middle East, so the findings are most directly applicable to developing countries in Africa, Asia, Latin America and Central and Eastern Europe, where similar regulatory, institutional and market conditions exist. The cross-country configurational approach highlights macro-level patterns of regulatory permissions rather than micro-level household behaviours. Future studies could examine distributed insurance at the household or submarket level, focusing on how local institutional arrangements, regulatory oversight and individual perceptions of risk interact to shape insurance distribution. Such analyses, using household surveys or targeted submarket studies, would refine the external validity of the conclusions and provide insights into context-specific mechanisms for effective insurance deployment.
Supplementary material
The supplementary material for this article can be found at https://doi.org/10.1017/bpp.2026.10040.
Acknowledgements
The authors have no acknowledgements to declare.
Funding statement
No funds, grants, or other support were received for this study.
Competing interests
The authors declare no competing interests.
Author contributions
G.O.: Conceptualisation, literature review, formal analysis and drafting of the manuscript. Y.A.: Conceptualisation, critical review, substantial revision, restructuring of arguments and overall manuscript improvement.
Data availability
The data supporting the findings of this study are available from the authors upon reasonable request.


 Open access