





1. Introduction
Sea-ice surface roughness is heterogeneous in time and space, with seasonal and multiyear ice types undergoing thermodynamic and dynamic-deformation processes. Macroscale sea-ice topography is characterized by a range of features, including level, undeformed sea ice; structures formed by convergent or divergent stressors like pressure ridges, cracks, leads, ice rubble, rafted ice and hummocks; snow features like sastrugi, dunes and variable depth; and melt features like saturated snow (slush) and meltwater ponds. These surface features are linked to season; atmospheric and oceanic forcing; and ice qualities like ice age, salt content and thickness (Weeks and Ackley, Reference Weeks and Ackley1982). The result is a wide variety of sea-ice topographies with different feature densities, scales and regimes.
Sea-ice surface characteristics directly impact the animals and people who use the sea ice (Frost and others, Reference Frost, Lowry, Pendleton and Nute2004; Dammann and others, Reference Dammann, Eicken, Mahoney, Saiet, Meyer and George2018) and ships that travel through sea ice (Bertoia and others, Reference Bertoia, Falkingham and Fetterer1998). Indirectly, they also impact ocean biological communities through light transmittance patterns (Horner and others, Reference Horner, Ackley, Dieckmann, Gulliksen, Hoshiai, Legendre, Melnikov, Reeburgh, Spindler and Sullivan1992; Katlein and others, Reference Katlein, Arndt, Nicolaus, Perovich, Jakuba, Suman, Elliott, Whitcomb, McFarland, Gerdes, Boetius and German2015), and the global climate through albedo/heat feedbacks and sea-ice decay (via movement by wind drag) (Schröder and others, Reference Schröder, Feltham, Flocco and Tsamados2014; Martin and others, Reference Martin, Tsamados, Schroeder and Feltham2016; Petty and others, Reference Petty, Tsamados and Kurtz2017). Furthermore, sea-ice surface characteristics are being altered by climate change, with greater expanses of open water leading to increased dynamic activity, and the transition to a younger, seasonal sea-ice regime leading to the replacement of older ice types with seasonal ice (Krupnik and Jolly, Reference Krupnik and Jolly2002; Martin and others, Reference Martin, Tsamados, Schroeder and Feltham2016). As a result, sea-ice surface topography (hereafter roughness) is an active area of research across many disciplines, involving a wide variety of sensors and methods of measurement.
While in situ sea-ice data are sparse and difficult to obtain, satellites provide information at moderate resolutions and broad scales. Currently, there are a wide variety of sea-ice roughness characterization methodologies applicable to specific applications and sea-ice regimes. The choice of input sensors and output roughness metrics varies depending on data availability, quality, cost and ease of use (Nolin and others, Reference Nolin, Fetterer and Scambos2002; Hong and Shin, Reference Hong and Shin2010; Newman and others, Reference Newman, Farrell, Richter-Menge, Conner, Kurtz, Elder and McAdoo2014; Beckers and others, Reference Beckers, Renner, Spreen, Gerland and Haas2015; Landy and others, Reference Landy, Isleifson, Komarov and Barber2015; Fors and others, Reference Fors, Brekke, Gerland, Doulgeris and Beckers2016; Martin and others, Reference Martin, Tsamados, Schroeder and Feltham2016; Petty and others, Reference Petty, Tsamados, Kurtz, Farrell, Newman, Harbeck, Feltham and Richter-Menge2016, Reference Petty, Tsamados and Kurtz2017; Johansson and others, Reference Johansson, King, Doulgeris, Gerland, Singha, Spreen and Busche2017; Dammann and others, Reference Dammann, Eicken, Mahoney, Saiet, Meyer and George2018; Li, Reference Li2018; Nolin and Mar, Reference Nolin and Mar2019). Despite the variety of goals and datasets, baseline roughness studies commonly combine or assess broader-scale datasets with finer-scale point-based (e.g., terrestrial LiDAR), linear (e.g., transect) or 3D (e.g., airborne LiDAR) datasets.
While some studies use satellite and/or LiDAR datasets to characterize roughness, few focus on roughness in relation to trafficability by local northern sea-ice users (Gauthier and others, Reference Gauthier, Tremblay, Bernier and Furgal2010; Dammann and others, Reference Dammann, Eicken, Mahoney, Saiet, Meyer and George2018). Most Arctic communities are situated adjacent to the marine environment, where sea ice plays an important ecosystem service by connecting communities to hunting grounds, seasonal cabins, recreation activities and other communities (Eicken and others, Reference Eicken, Lovecraft and Druckenmiller2009; Segal, Reference Segal2019; Segal and others, Reference Segal, Scharien, Duerden and Tamin press). Roughness impacts travelers, and they desire information about landfast sea-ice surface conditions in order to plan livelihood activities (Aporta, Reference Aporta2004; Ford and others, Reference Ford, Pearce, Gilligan, Smit and Oakes2008; Laidler and others, Reference Laidler, Hirose, Kapfer, Ikummaq, Joamie and Elee2011; Druckenmiller and others, Reference Druckenmiller, Eicken, George ‘Craig’ and Brower2013; Bell and others, Reference Bell, Briggs, Bachmayer and Li2014; Dammann and others, Reference Dammann, Eicken, Mahoney, Saiet, Meyer and George2018; Segal, Reference Segal2019; Segal and others, Reference Segal, Scharien, Duerden and Tamin press). Smooth sea-ice/snow surfaces support rapid travel by snowmobile (~50–110 km h−1) as well as reduced fuel consumption and wear on equipment, while rougher sea-ice/snow surfaces cause slower travel (~5–30 km h−1), higher fuel consumption, increased wear on equipment, as well as difficult travel with increased risk of accidents and breakdowns (Segal, Reference Segal2019; Segal and others, Reference Segal, Scharien, Duerden and Tamin press). Roughness is important at spatio-temporal scales applicable to travel by snowmobile: sub-meter to meter-scale datasets (>0.1 to ~10 m) covering large areas at frequent intervals throughout the sea-ice season. Northerners have expressed a desire to access synthetic aperture radar (SAR)-based maps in print and online formats that can be checked before excursions. Consequently, data that are open access or low cost are essential.
Assessments of potential sea-ice hazards and impediments to trafficability are readily available to operational and industrial sea-ice users in the form of ice charts. These charts, which typically combine C-band frequency (~5.3 GHz) SAR image data with ancillary sources such as optical, aerial reconnaissance and in situ observations, are produced with standardized terminologies in Canada, the USA, the Baltic Nations, Japan and Russia (Bertoia and others, Reference Bertoia, Falkingham and Fetterer1998). However, ice chart information does not currently include surface roughness characteristics. Additionally, sea-ice hazards encountered by communities during travel differ from those encountered by ships, as sea ice is used as a platform for activities instead of acting as a hazard for water-based navigation. Consequently, information available to industry users may not be accessible or useful for communities due to technological limitations, cost, jargon and production at coarse spatio-temporal scales (Laidler and others, Reference Laidler, Hirose, Kapfer, Ikummaq, Joamie and Elee2011; Bell and others, Reference Bell, Briggs, Bachmayer and Li2014).
The Multi-Angle Imaging SpectroRadiometer (MISR) is an instrument aboard the Terra satellite with nine separate sensors, each with four bands across the visible to near-infrared spectral range. There is one sensor oriented at nadir, and four sensors each at increasing angles in forward and backward orientations relative to Terra. This configuration enables the capture of forward and backward scattering of sunlight during the descending Terra orbit. MISR has a swath width of 380 km, and provides coverage over the study area every 1–2 d. Off-nadir data acquired in the red band have a spatial resolution of 275 m (Jovanovic and others, Reference Jovanovic, Miller, Rheingans and Moroney2012; Diner and others, Reference Diner, Beckert, Bothwell and Rodriguez2002). Directional reflectance is used to infer surface roughness, when solar illumination permits (Nolin, Reference Nolin2004; Nolin and Payne, Reference Nolin and Payne2007). It has been used for studies of sea ice and glacier roughness (Nolin and others, Reference Nolin, Fetterer and Scambos2002; Nolin and Payne, Reference Nolin and Payne2007; Nolin and Mar, Reference Nolin and Mar2019), ocean texture (oil spill detection) (Chust and Sagarminaga, Reference Chust and Sagarminaga2007) and desert dune detection (Wu and others, Reference Wu, Gong, Liu and Chappell2009).
Sentinel-1 is a constellation of two C-band SAR systems operated by the European Space Agency (ESA), which provides high-resolution (40 m) imagery of radar backscatter every 2–4 d in the Arctic (ESA, 2018a). The ability of SAR to regularly obtain imagery regardless of cloud cover or darkness, as well as the sensitivity of measured backscatter to surface roughness where dielectric property contrasts occur (air–snow and snow–ice interfaces), makes it desirable for roughness mapping (Dammann and others, Reference Dammann, Eicken, Mahoney, Saiet, Meyer and George2018). When surface scattering dominates, rougher surfaces have a greater number of surface components and increased backscatter. For sea ice, the composite of surface components of importance to backscatter intensity can generally be divided into micro- and macro-scales. Micro-scale components are wavelength-dependent elevation discontinuities which, for the 5.6 cm wavelength of Sentinel-1, correspond to the cm-scale. Macro-scale components are the topographical features, such as ice blocks and deformed ice, upon which the small-scale undulations reside (Drinkwater, Reference Drinkwater1989). For winter first-year sea ice (FYI), C-band energy is generally understood to penetrate the overlying snow cover such that backscatter originates from the sea ice. Volumetric contributions to backscatter at C-band, such as from air bubbles in the case of winter multiyear ice (MYI), occur when the freshened upper ice layer promotes penetration into the volume and are not linked to roughness (Hallikainen and Winebrenner, Reference Hallikainen and Winebrenner1992; Geldsetzer and Yackel, Reference Geldsetzer and Yackel2009). SAR is widely used for sea-ice operational mapping and research, particularly at C-band, resulting in a legacy of increased understanding and use of this frequency (e.g., Bertoia and others, Reference Bertoia, Falkingham and Fetterer1998; Melling, Reference Melling1998; Makynen and others, Reference Makynen, Manninen, Simila, Karvonen and Hallikainen2002; Zakharov and others, Reference Zakharov, Bobby, Power, Saunders and Warren2015; Howell and others, Reference Howell, Small, Rohner, Mahmud, Yackel and Brady2019). SAR has been used to assess the surface roughness of land- (Martinez-Agirre and others, Reference Martinez-Agirre, Álvarez-Mozos, Lievens, Verhoest and Giménez2017; Sadeh and others, Reference Sadeh, Cohen, Maman and Blumberg2018) and ice-scapes (Dierking and others, Reference Dierking, Carlstrom and Ulander1997; Melling, Reference Melling1998; Peterson and others, Reference Peterson, Prinsenberg and Holladay2008; Gupta and others, Reference Gupta, Scharien and Barber2013; Fors and others, Reference Fors, Brekke, Gerland, Doulgeris and Beckers2016; Dammann and others, Reference Dammann, Eicken, Mahoney, Saiet, Meyer and George2018; Cafarella and others, Reference Cafarella, Scharien, Geldsetzer, Howell, Segal and Nasonova2019). Scatterometers, which are active microwave instruments that provide backscatter at coarse spatial resolution (several km) due to the absence of aperture synthesis, have also been used to study ice-sheet surface properties including roughness, grain size and melting (Long and Drinkwater, Reference Long and Drinkwater1994; Fraser and others, Reference Fraser, Young and Adams2014). However, sea-ice roughness characterization using SAR and scatterometers remains an area of ongoing research due to a diversity of surface characteristics (e.g., physical and dielectric) and resulting complex radar interactions that yield observed backscatter.
In this study, we investigate the utility of radar and optical satellite-based datasets, the optical MISR and the C-band frequency Sentinel-1 SAR, for estimating winter-period macroscale surface roughness at scales applicable for serving the on-ice trafficability information needs of communities in the Kitikmeot Region of the Western Canadian Arctic (see Segal, Reference Segal2019; Segal and others, Reference Segal, Scharien, Duerden and Tamin press). First, an inter-comparison of a MISR-based roughness index and Sentinel-1 backscatter datasets is done for the entire study area, as well by subsets of homogeneous samples of the three major ice types present in the region: FYI, deformed first-year sea ice (DFYI) and MYI. Second, an inter-comparison is made of a smaller portion of the study area containing FYI and MYI, where the MISR and Sentinel-1 datasets also overlap with the flight track of an airborne LiDAR system used to derive high-resolution surface roughness data. Models for estimating roughness from MISR and Sentinel-1 are also derived. In Section 2, the datasets, processing methods and research design are described. Section 3 provides the inter-comparison results, derived models for estimating roughness from MISR and Sentinel-1, as an evaluation of the capability of Sentinel-1 for identifying MYI areas. Section 4 considers the main strengths and weaknesses of the sensors in the context of designing a process that results in accurate and readily understandable information for incorporation into maps serving the local travel-based information needs of northern communities.
2. Methods
2.1 Study area
The study area (Fig. 1) is of interest to northern residents who travel on sea ice (Segal, Reference Segal2019; Segal and others, Reference Segal, Scharien, Duerden and Tamin press). The sea ice is landfast and of 100% ice concentration in late winter and spring, which permits surface roughness comparisons from multiple days without the need for tracking movement. In winter, the region is predominantly comprised of FYI, DFYI and MYI.
(a) The study area, showing MISR (blue), Sentinel-1 (orange) and LiDAR (yellow) data coverage. The dashed grey line indicates the coverage of inset (b), which shows LiDAR-derived root mean square sea-ice roughness overlaid on Sentinel-1 imagery from April 2017. Datasets are described in Section 2.2.

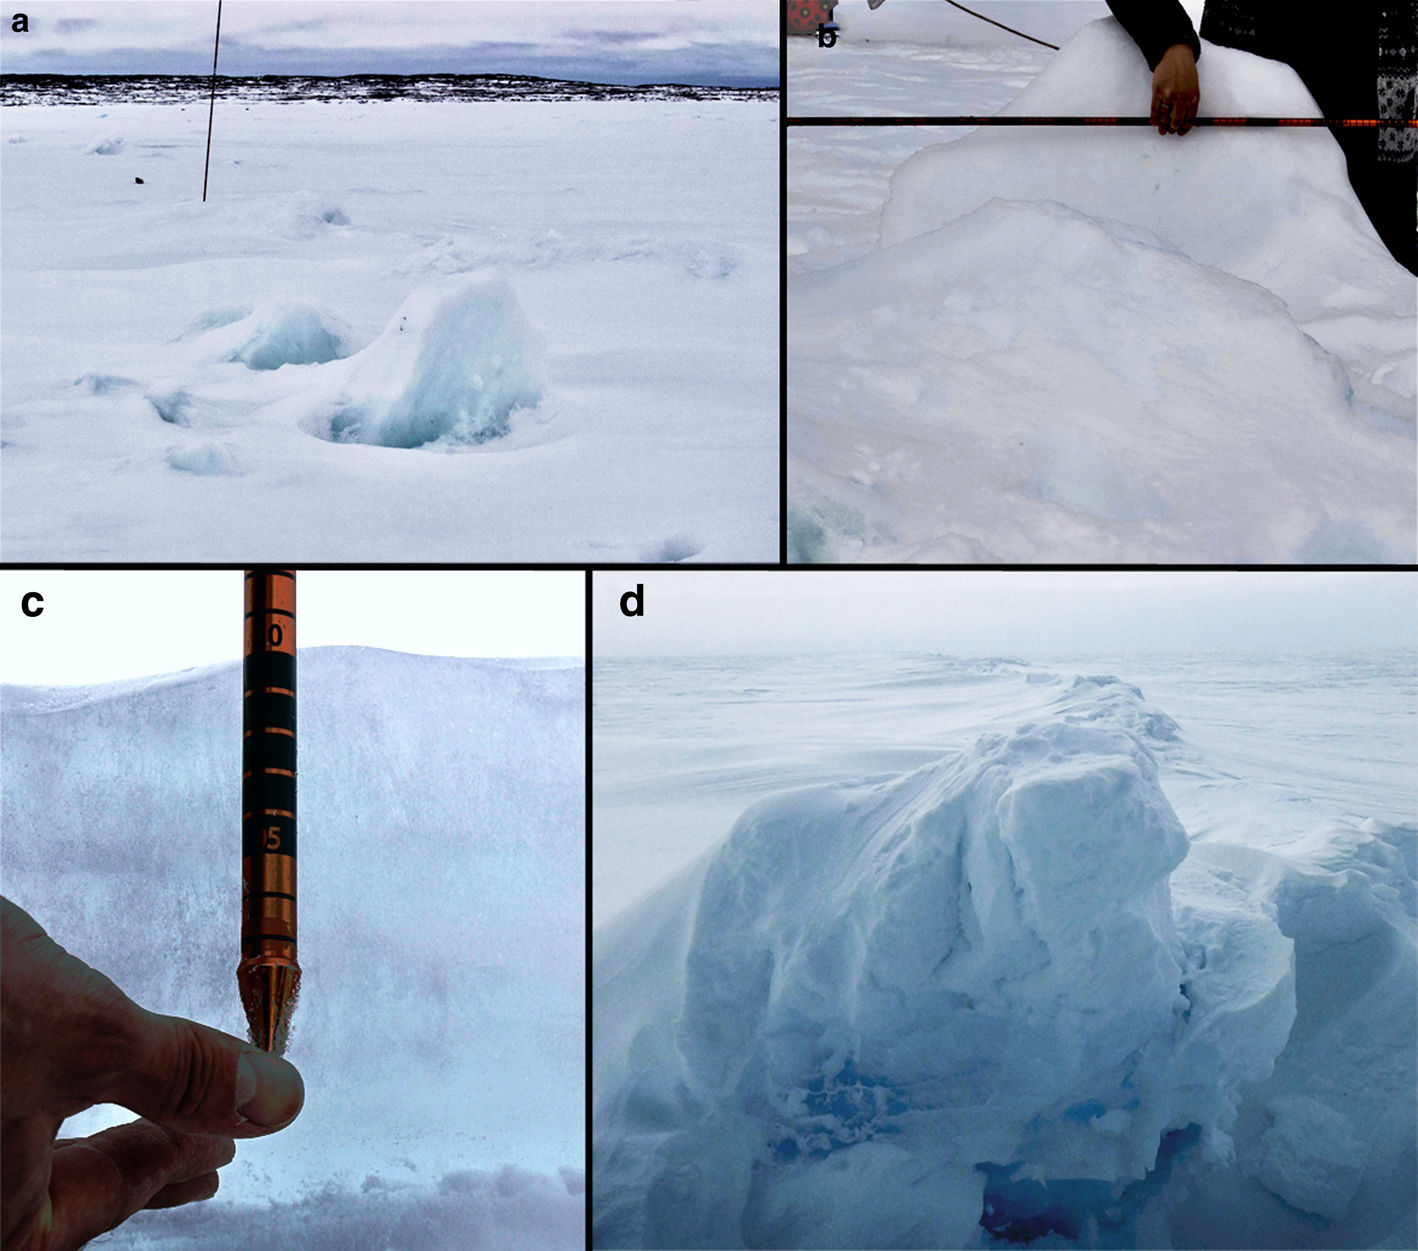
FYI in this region can either freeze during calm conditions and be relatively smooth, or freeze while there are varying degrees of wind, current and wave action and so contain sharp slabs of broken or rafted ice embedded on the sea-ice surface. Slabs vary in density and size, which together determine the ‘degree’ of FYI roughness, from relatively smooth to rough. Slabs are often small (<1 m) but can be more than 6 m high (Figs 2a and b). They are typically ~15 cm (up to ~60 cm) thick, depending on the ice thickness when the surface ice sheet breaks (Fig. 2c; Segal, Reference Segal2019; Segal and others, Reference Segal, Scharien, Duerden and Tamin press). Pressure ridges (Fig. 2d) also contribute to roughness, with type 1 pressure ridges (locally defined; cracks with ice rubble on the edges; ~1.2 m high but up to ~4.5 m high) and type 2 pressure ridges (ice that has buckled upwards due to pressure; taller) causing ice rubble to form above the sea-ice surface . DFYI contains the extremes of these rough conditions, including dense areas of broken ice as well as features due to convergent or divergent stresses, like rafted ice and pressure ridges. This ice type is found in areas subject to strong winds and currents when the ice is still consolidating.
Sea-ice surface roughness features near Kugluktuk on 28 May 2018 (a–b) and Cambridge Bay on 21 May 2018 (c–d). (a) Area of snow-covered moderately rough sea ice with upturned blocks (N 67°56.936′, W 114°41.526′); (b) close-up of a typical ice block seen in the foreground of (a), with dimensions: length = 127 cm, width = 24 cm, height = 135 cm and thickness = 14 cm; (c) image showing the thickness of sea ice when it broke (~10 cm, each marked interval is 1 cm); and (d) a sea-ice fracture (pressure ridge) ~2–3 m in height and ~ 4.5 m wide (N 69°03.724, W 105°40.165′).
MYI in this region has a hummocky surface that is typically not sharp, but rather smooth and bumpy due to weathering. The junctions between FYI and MYI can be uneven, as MYI may be much thicker than FYI and have a higher freeboard. On top of the sea ice, snow also modifies the surface that is used for travel, by filling in gaps or creating snow-hummocks (Segal, Reference Segal2019; Segal and others, Reference Segal, Scharien, Duerden and Tamin press). A video clip of the 2016–2017 sea-ice season progression in the study region is found in the Supplementary materials Section 6.1.
Data were captured from 5 to 14 April 2017, near the end of the winter period prior to melting conditions. Mean April 2017 air temperature at Cambridge Bay (WMO ID 71925) was −21.8°C. Given that the ice is landfast, the ice surface conditions are generally considered representative of the winter period, beginning after the initial freeze-up period is complete and the ice is consolidated (though some snowfall redistribution is expected), to the start of melting. A mixture of ice types and a wide spectrum of surface roughness conditions are present in the study area beyond what is expected for smooth, thermodynamically grown FYI. This variety is due to the incursion of MYI floes during summer that freeze-in during winter, as well as the presence of DFYI which forms when FYI is forced through a narrow, shallow strait (Williams and others, Reference Williams, Brown, Bluhm, Carmack, Dalman, Danielson, Else, Friedriksen, Mundy, Rotermund and Schimnowski2018). The predominant ice type in Coronation Gulf, Dease Strait and Queen Maud Gulf was FYI in 2017. In Victoria Strait, there was DYFI and FYI, and in M'Clintock Channel there was a mix of MYI and smaller regions of FYI and DFYI. Note that data used to assess the effect of incidence angle on SAR backscatter intensity have different collection dates (see Table S1).
2.2 Data and processing
MISR, Sentinel-1 and LiDAR data were captured from 5 to 14 April 2017, during winter (pre-melt) conditions. The areal coverages of the satellite and airborne datasets are shown in Fig. 1, and dataset specifications are provided in Table 1.
Information about the sensors and products used to assess sea-ice backscatter and surface roughness
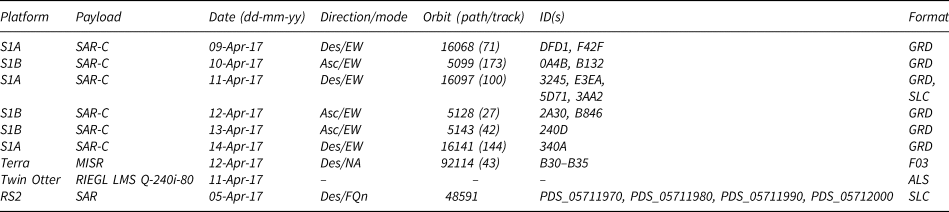
S, Sentinel; RS, RADARSAT; Des, descending; Asc, ascending; EW, extended wide-swath; GRD, ground range detected; FQn, fine quad pol; Bxx, band number (MISR data); Fxx, format version number (MISR data); ALS, airborne laser scanner; SLC, single-look complex.
SLC images are used in Section 2.4 exclusively.
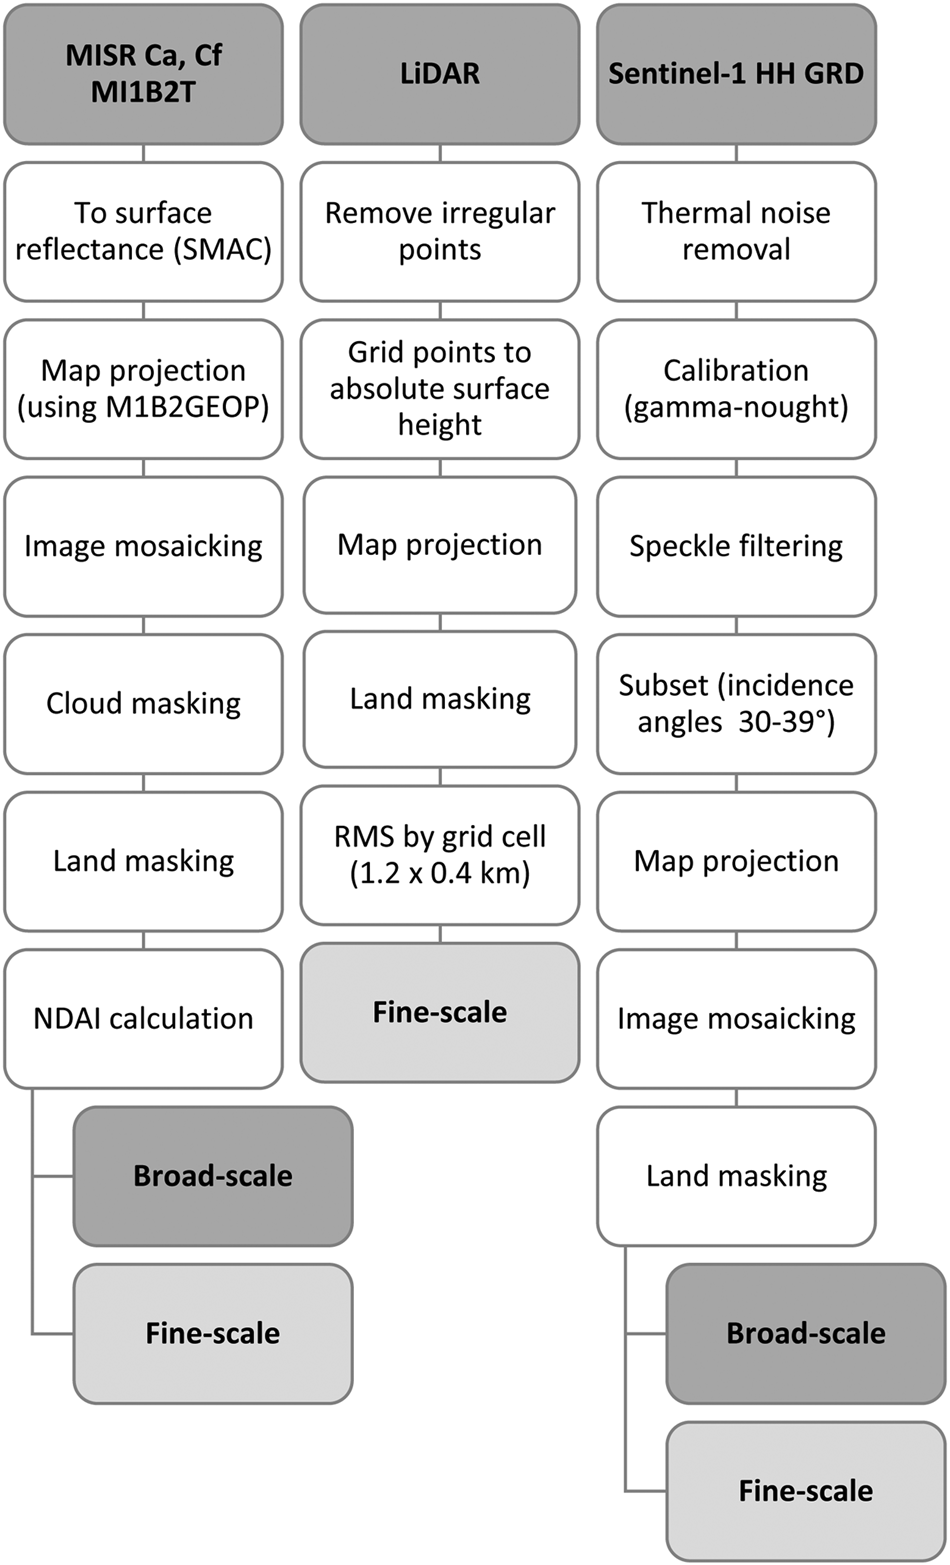
Data processing methods are summarized in Fig. 3 and described in detail below. All datasets were re-projected to a standard projection (WKID: 32614), and data intersecting land was removed using The Global Self-consistent, Hierarchical, High-resolution Shoreline Database as a mask (at full resolution and buffered offshore by 300 m) (Wessel and Smith, Reference Wessel and Smith1996).
Schematic showing MISR, LiDAR and Sentinel-1 data pre-processing (top to bottom) for the broad-scale and fine-scale analyses. Broad-scale and fine-scale aggregations of the MISR NDAI, Sentinel-1 backscatter and LiDAR roughness datasets are used for inter-comparisons and are described in Section 2.3.
2.2.1 MISR NDAI
MISR MI1B2T data (Table 1) from the Cf and Ca cameras (±60.0° forward/aftward of local vertical) were processed to surface reflectance using the Simple Model for Atmospheric Correction (SMAC) (Rahman and Dedieu, Reference Rahman and Dedieu1994), and then the individual data blocks were projected and mosaicked using the MIB2GEOP ancillary product, which resulted in a pixel size of 300 m × 300 m. Areas with suspected cloud cover were manually masked out (Nolin and Mar, Reference Nolin and Mar2019) and then surface reflectance was used to create the normalized difference angular index (NDAI),
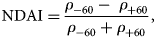
where ρ −60 and ρ +60 are the Ca and Cf hemispherical-directional reflectances obtained from the sensor's red channel (672 nm), respectively. NDAI is used to approximate roughness at sub-pixel (mm- to m-scales) scales (Nolin and others, Reference Nolin, Stroeve, Scambos and Fetterer2001; Wu and others, Reference Wu, Gong, Liu and Chappell2009; Nolin and Mar, Reference Nolin and Mar2019) and has been proven useful over various cryosphere surfaces such as glacier ice and sea ice, where smooth surfaces have a negative NDAI and rough surfaces have a positive NDAI (Nolin, Reference Nolin2004; Nolin and Payne, Reference Nolin and Payne2007). The resulting NDAI data were subsequently averaged by gridcell in preparation for multi-scale comparisons (see Section 2.3).
2.2.2 Sentinel-1 backscatter
The horizontal transmit-receive (HH) channel was selected due to previously examined sensitivity to sea-ice roughness (Table S2), and since backscatter from sea ice in this channel is typically greater than the high Noise-Equivalent Sigma Zero (NESZ) of Sentinel-1, nominally −22 dB (ESA, 2018b). The Sentinel-1 horizontal transmit and vertical receive (HV) channel was not analyzed due to low backscatter relative to the NESZ and noisy artifacts visible among the sub-swaths in the EW mode. A high NESZ can increase low values (Similä and others, Reference Similä, Mäkynen and Heiler2010), reducing the effective contrast between smooth and rough ice, if the smooth ice backscatter falls below the NESZ (Dierking and Dall, Reference Dierking and Dall2007). Sentinel-1 images were processed using ESA's Sentinel Application Platform (SNAP) Version 6.0 using the following steps: (i) thermal noise removal, (ii) HH-band calibration (γ-nought), (iii) speckle filtering (Lee 7 × 7), (iv) sub-setting (incidence angle range 30–39°) and (v) map projection (Fig. 3). Restriction to mid-range incidence angles and γ-nought calibration was used to minimize the effect of incidence angle on backscatter intensity (see Supplementary materials Section 6.2). After processing, images were mosaicked, with values averaged in cases of overlapping scenes. The resulting HH backscatter mosaic was subsequently averaged by gridcell in preparation for multi-scale comparisons (see Section 2.3).
2.2.3 LiDAR-derived roughness
The fine-scale resolution (1.0 m × 1.0 m) airborne LiDAR data were collected using a Twin Otter-mounted RIEGL LMS Q-240i-80 on 11 April 2017 as part of ESA's CryoSat Validation Experiment (CryoVEx). The aircraft flew a data collection transect over Victoria Strait and M'Clintock Channel, to Prince of Wales Island (Fig. 1) at ~300 m a.g.l. The 904 nm LiDAR collects data from the air/snow interface over a swath of 400 m by using a maximum scan angle of 80° and recording the last returned pulse. The vertical accuracy is on the order of ~10 cm or better due to kinematic GPS uncertainty.
Python's SkyFilt.py program was used to remove processed GPS points with heights falling within 50 m of the aircraft, as in Skourup and others (Reference Skourup, Simonsen, Sørensen, Helm, Hvidegaard, Bella and Forsberg2018). Gridded LiDAR points provide a measurement of absolute surface height. The root mean square deviation of surface height is used to estimate surface roughness,
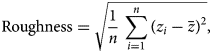
where z i represents the height of the gridded LiDAR surface at n grid points within a given gridcell and $\bar{z}$ are the mean grid heights within the same gridcell. Gridcell dimensions are described in Section 2.3.
2.3 Inter-comparison of NDAI, backscatter and LiDAR surface roughness
A two-scale spatial approach, termed broad-scale and fine-scale, was used to aggregate data and intercompare the datasets. See Fig. S2 for schematics of the grids used in data aggregation. For both scales, the resolution of the MISR data (300 m after processing) was considered when choosing an appropriate gridcell size and spacing between cells. The broad-scale consisted of a regular grid of 1.2 km by 1.2 km gridcells separated by 3.8 km intervals, within the overlapping region of the Sentinel-1 and MISR datasets shown in Fig. 1 (n = 2407). The selection of 1.2 km2 gridcell allowed at least 3–4 MISR pixels in each dimension, and the spacing was used to reduce spatial similarity in the sampled dataset. This scale encompasses a wider range of ice types and conditions than the area corresponding to the LiDAR flight track; in particular, a large area of DFYI in Victoria Strait. This aggregation approach was used to evaluate the congruence of NDAI and HH backscatter. Using the Sentinel-1 scene and a weekly Canadian Ice Service (CIS) ice chart from 10 April 2017 as reference, a subset of cells representing homogeneous FYI (n = 160), DFYI (n = 151) and MYI (n = 160) were manually delineated (Fig. S3). Sentinel-1 backscatter samples were converted to decibel (dB) format after broad-scale aggregation.
The fine-scale grid consisted of 1.2 km by 0.4 km cells separated by 0.6 km intervals, centered on the LiDAR flight path. The width of 0.4 km was chosen because it corresponded to the LiDAR swath, and the spacing allowed 1–2 MISR pixels between gridcells and reduced spatial similarity in the sampled dataset. This aggregation scheme enabled inter-comparison of all three datasets: HH backscatter, NDAI and LiDAR-derived roughness (from a total of n = 129 gridcells). Only FYI and MYI are found along the LiDAR flight path, so no DFYI samples were included in this dataset. Each gridcell was labeled as FYI, MYI or mixed ice, the latter label referring to a mixture of FYI and MYI within a single cell. Backscatter samples were converted to dB format after fine-scale aggregation.
Inter-comparisons at both broad- and fine-scales were done using correlation (Pearson's r) and least-squares regression analyses. Least-squares regression analysis was used in the broad-scale comparison of NDAI and HH backscatter to map regression residuals and enable assessment of the agreement between variables in a spatial context. Regression analysis was applied to the fine-scale dataset to assess the utility of NDAI and HH backscatter for estimating roughness, either for a given ice type, or for both FYI and MYI by using a balanced sample for inputs to the model (i.e., roughly equivalent number of samples by type).
2.4 Identification of MYI
Volume scattering from MYI is known to impact the relationship between roughness and backscatter at C-band frequency (Hallikainen and Winebrenner, Reference Hallikainen and Winebrenner1992). To assess whether Sentinel-1 can be used to accurately delineate, and possibly mask out, MYI areas, the H-Alpha dual-pol decomposition was computed from two mosaicked SLC format images from 11 April 2017 and the unsupervised Wishart classification applied to the output (Table 1). The following processing chain was used: (i) TOPSAR-Split (to select EW swaths 2–4), (ii) radiometric calibration, (iii) TOPSAR deburst, (iv) polarimetric matrices (C2), (v) polarimetric speckle filter (refined Lee 7 × 7), (vi) polarimetric classification (H-Alpha dual-pol Wishart classification), (vii) sub-setting (incidence angle range 30–39°), (viii) map projection and (ix) mosaicking. The nine output classes produced by the Wishart classifier were collapsed to two, MYI (classes ≥4) and FYI (classes <4) using the original Sentinel-1 imagery and a CIS ice chart for reference.
As dual-polarization decompositions are less commonly used and less understood for sea-ice applications than decompositions of fully polarimetric datasets, four RADARSAT-2 FQn scenes were processed to assess Sentinel-1 classification performance (see Table 1 for data, and Fig. S4 for processing). The available RADARSAT-2 images have incidence angles ranging from 39.6 to 42.2°. The following processing chain was used: (i) radiometric calibration, (ii) polarimetric matrices (C3), (iii) polarimetric speckle filter (refined Lee 7 × 7), (iv) polarimetric classification (H-A-Alpha quad-pol Wishart classification) and (v) map projection. The Wishart classification product classes were collapsed using the same threshold as the classified Sentinel-1 imagery.
Accuracies of both the dual-pol and quad-pol Wishart classifications were each derived using a validation set of 100 randomly stratified points, which were labeled FYI or MYI by expert visual inspection of Sentinel-1 HH backscatter images. A full processing chain summarizing the methods in this section is provided in Fig. S4.
3. Results
3.1 Broad-scale comparison
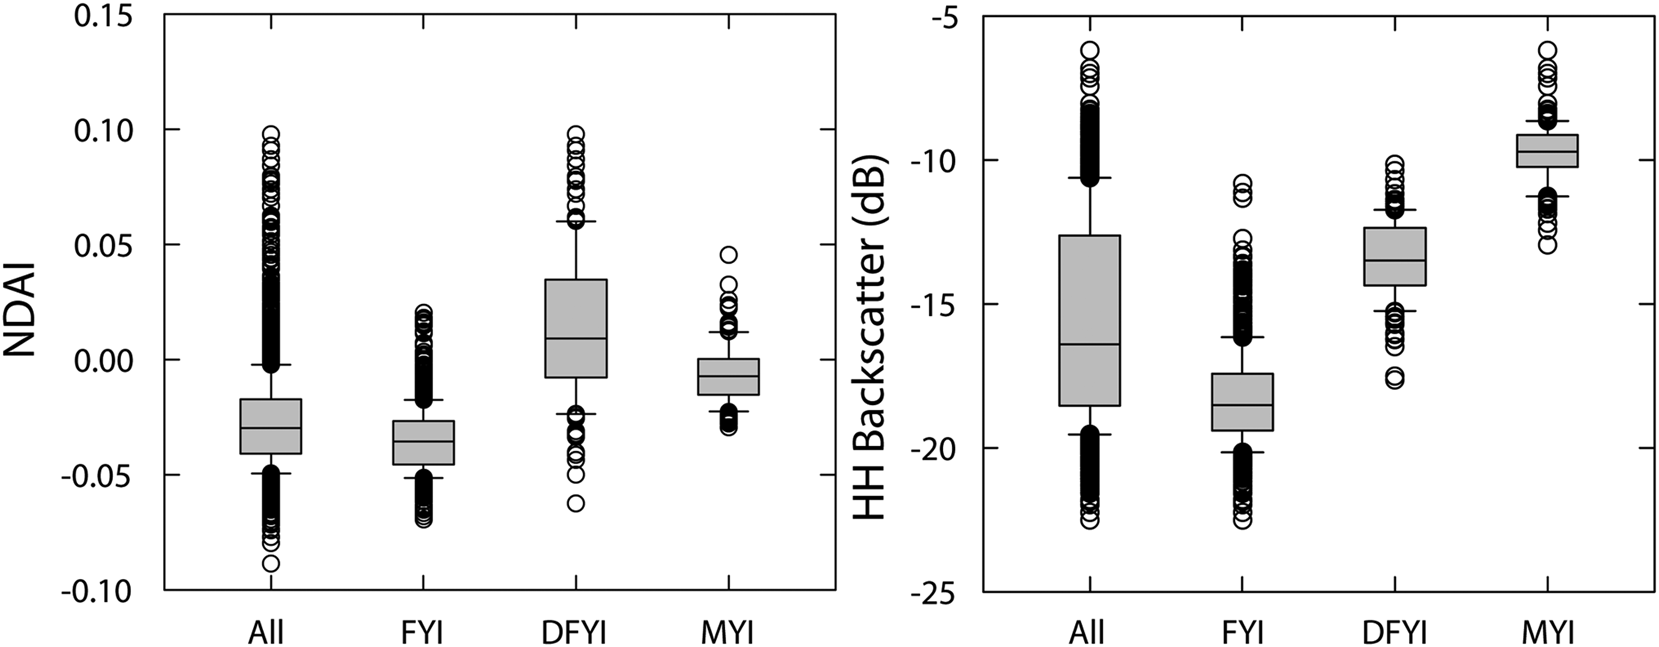
NDAI and HH backscatter boxplots show that both variables are generally in agreement for FYI and DFYI but not MYI (Fig. 4). Correspondingly low values are found in smooth FYI areas, with NDAI and HH backscatter median values of −0.04 and −18.53 dB, respectively, as well as correspondingly high values in DFYI areas, with median values of 0.01 and −13.49 dB, respectively. In Fig. 4, the high interquartile reach of HH backscatter from "All" ice types is likely due to MYI, where there is a clear difference between the NDAI and HH backscatter.
Box and whisker plot showing NDAI (left) and HH backscatter (right) values by sea-ice type. Whiskers indicate the 90th and 10th percentiles.
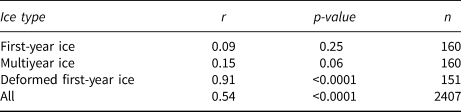
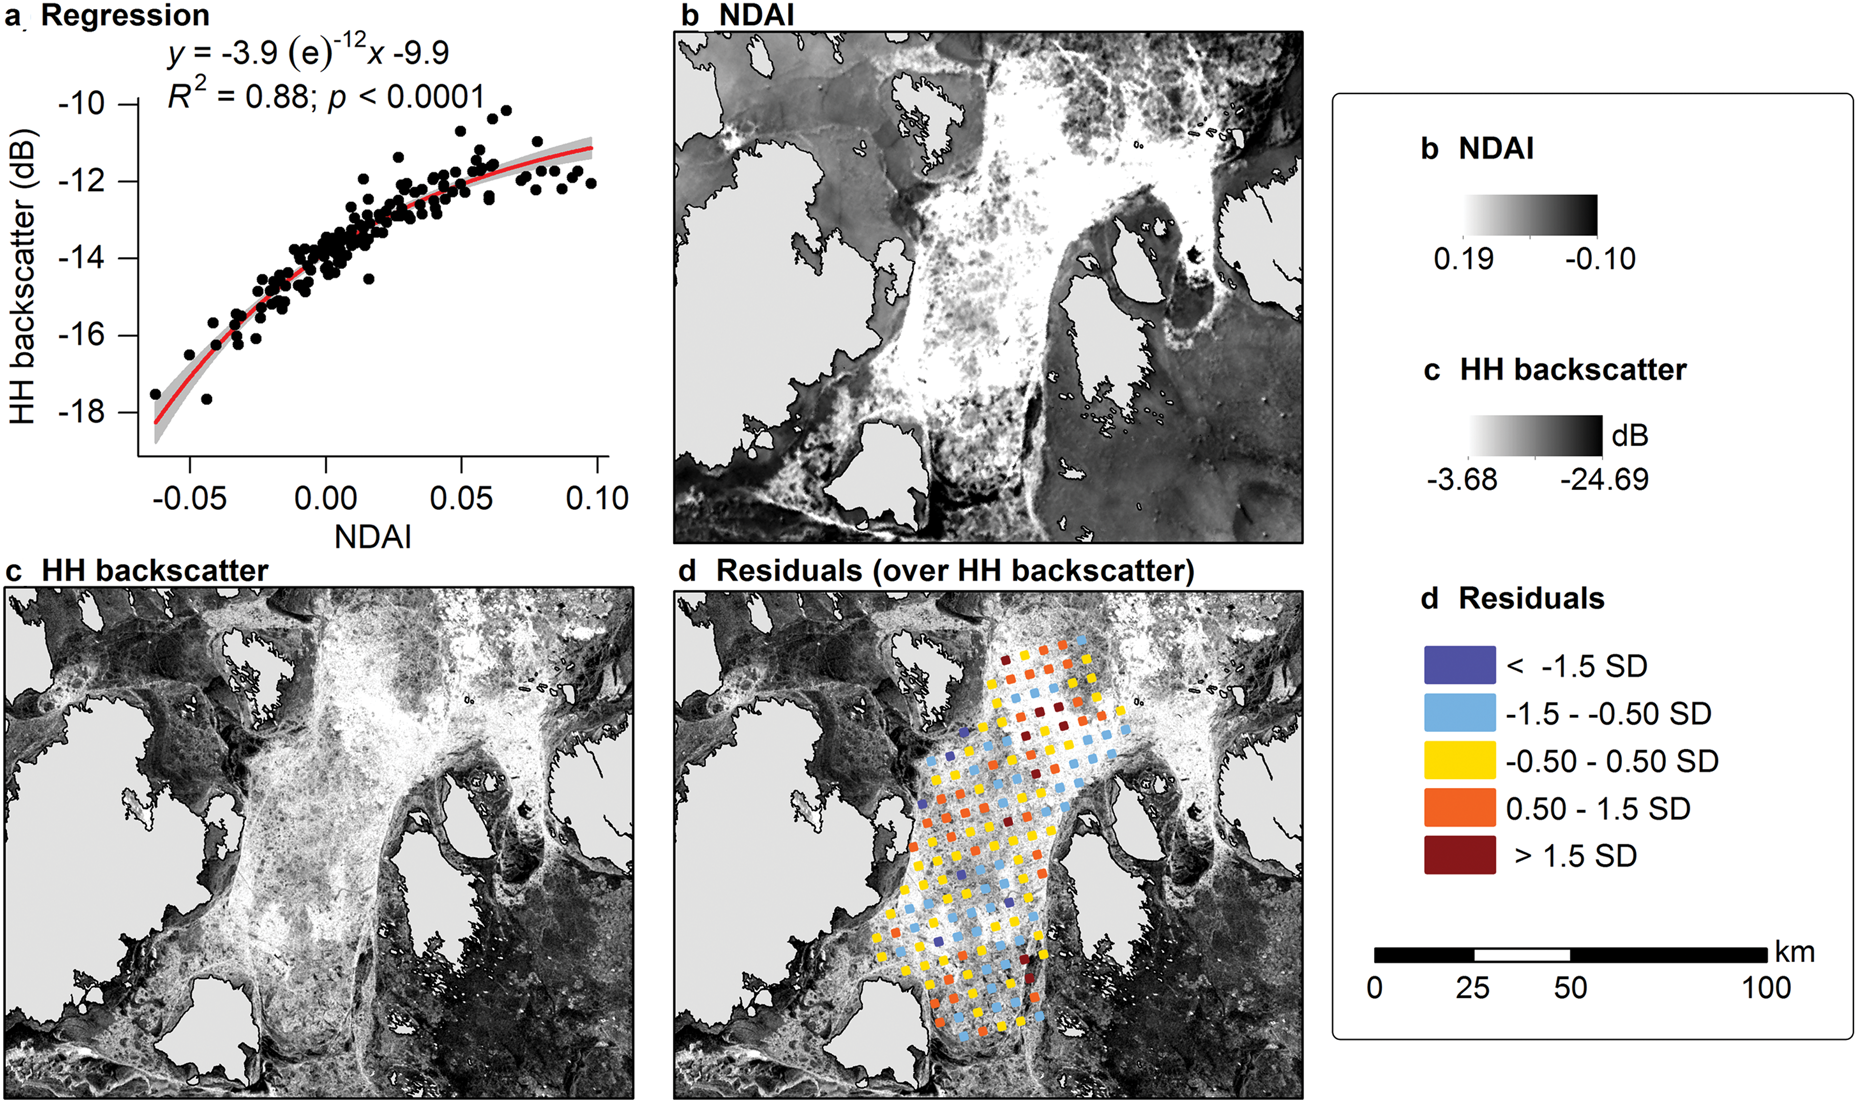
Overall, NDAI and HH backscatter are correlated (r = 0.54; p < 0.0001), though significant correlations are not found for individual FYI and MYI ice types (Table 2; Fig. S5). For DFYI, there is a strong significant correlation (Table 2) and exponential regression relationship between NDAI and HH backscatter (R 2 = 0.88; p < 0.0001; Fig. 5), indicating that HH backscatter is related to the reflectance properties of this ice type as captured by the NDAI. The area containing DFYI, shown in Fig. 5, is to the south of the LiDAR flight track in Victoria Strait (also refer to Fig. 1). Though no LiDAR-derived roughness data for this area were captured in this study, previous work shows that it is a narrow, shallow strait (20–30 m deep), where DFYI measured in 2016 had a modal roughness of ~0.3 m (Williams and others, Reference Williams, Brown, Bluhm, Carmack, Dalman, Danielson, Else, Friedriksen, Mundy, Rotermund and Schimnowski2018; Cafarella and others, Reference Cafarella, Scharien, Geldsetzer, Howell, Segal and Nasonova2019). A qualitative comparison of winter period Sentinel-1 imagery from 2016 and 2017 reveals a consistent pattern for the area shown in Fig. 5c. This similarity suggests that the narrow and shallow strait influences the annual formation of DFYI in this area.
Correlations (Pearson's r) between NDAI and HH backscatter
DFYI in Victoria Strait: (a) exponential regression between NDAI and HH backscatter, (b) NDAI, (c) HH backscatter and (d) residuals from the regression plotted spatially over HH backscatter.
3.2 Fine-scale comparison
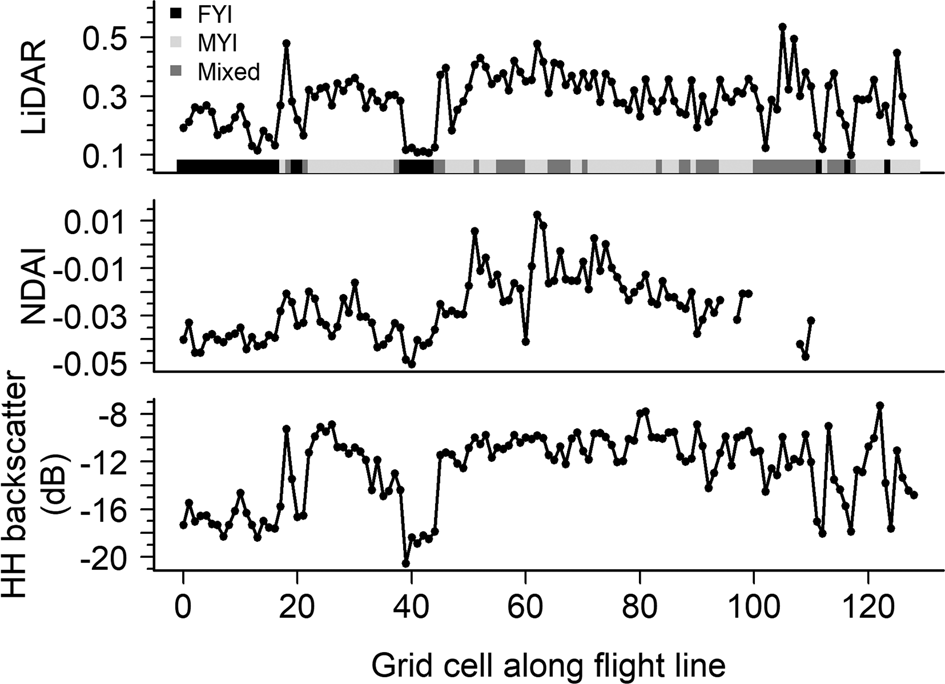
The NDAI and HH backscatter datasets generally trace the LiDAR-derived roughness along the flight line (Fig. 6). As expected, NDAI and HH backscatter from FYI have lower values than MYI and mixed ice areas. Fig. 7 shows that the LiDAR-derived roughness follows a relatively normal distribution, whereas the NDAI and HH backscatter distributions are bi-modal, with an FYI peak at lower values.
Sea-ice surface roughness measured using LiDAR (top). The dominant type of sea ice underlying each gridcell along the flight line is shown, with FYI, MYI and mixed ice shown as black, light grey and mid-grey, respectively. LiDAR roughness is compared to NDAI (middle) and HH backscatter (bottom). The LiDAR flight line runs from Victoria Strait to M'Clintock Channel.
Histograms showing datasets used in the fine-scale comparison. Roughness measured using LiDAR (top), NDAI (center) and HH backscatter (bottom). Data from FYI are displayed using light grey whereas data from mixed/MYI are dark grey.
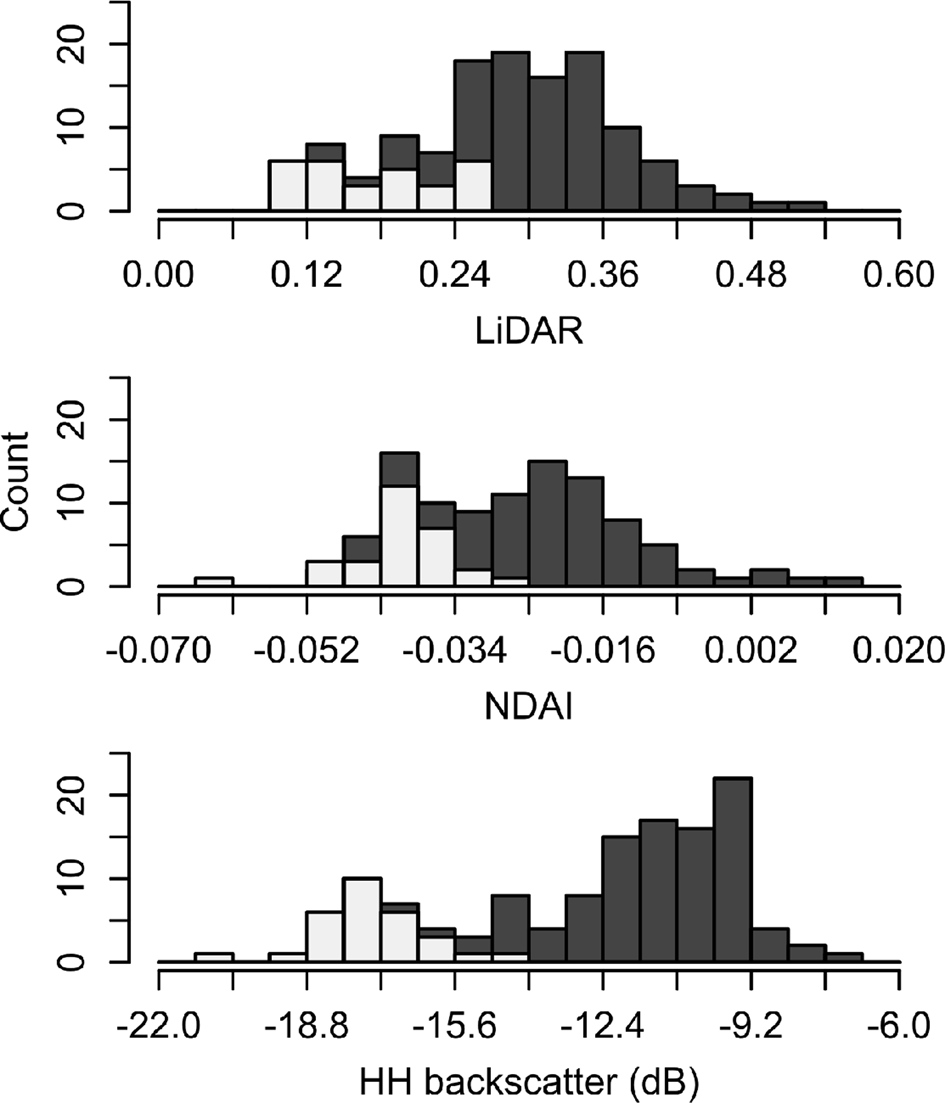
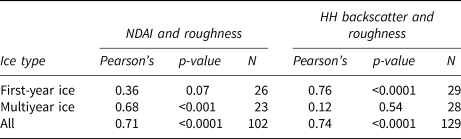
Table 3 shows correlation results from the inter-comparison of NDAI, HH backscatter and LiDAR-derived roughness. For FYI, NDAI is not significantly correlated to roughness (Table 3), whereas HH backscatter is significantly correlated. Conversely, for MYI, NDAI is significantly correlated to roughness, whereas HH backscatter is not. Using all available samples, both satellite datasets are correlated with roughness. However, due to the known impacts of volume scattering on MYI and the weak correlation of HH backscatter and roughness for MYI, correlations between HH backscatter and roughness for mixed and MYI ice types are likely unreliable.
Correlations (Pearson's r) between NDAI, HH backscatter and LiDAR-derived roughness
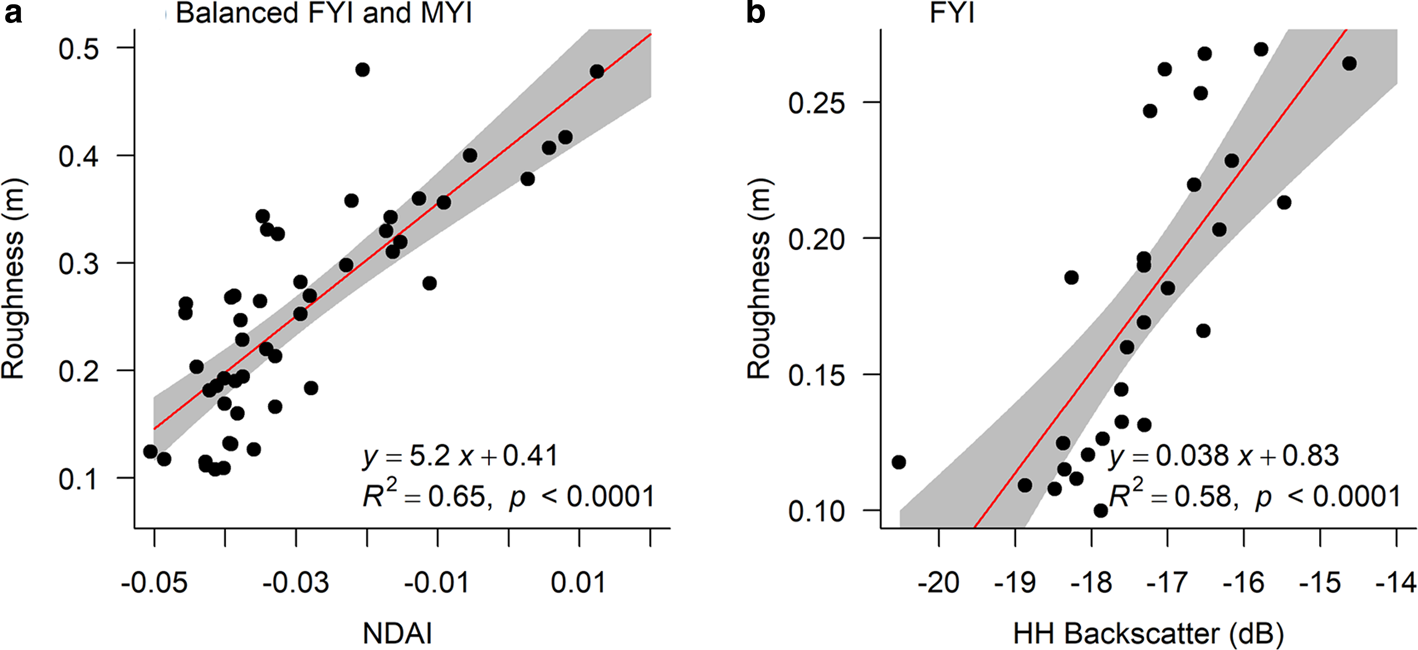
Based on the outcome of the correlation analysis, two least-squares regression models were created from the fine-scale data: a model for predicting FYI and MYI roughness from NDAI (Fig. 8a), and a model for predicting FYI roughness from HH backscatter (Fig. 8b). Both models are statistically significant.
Linear regressions predicting LiDAR-based roughness from satellite-derived (a) NDAI, for a balanced number of gridcells by ice type: n = 26 for FYI and n = 23 for MYI; and (b) HH backscatter, for FYI: n = 29. Plots show linear regressions with 95% confidence intervals. Note that the scales of the LiDAR-based roughness change between plots.
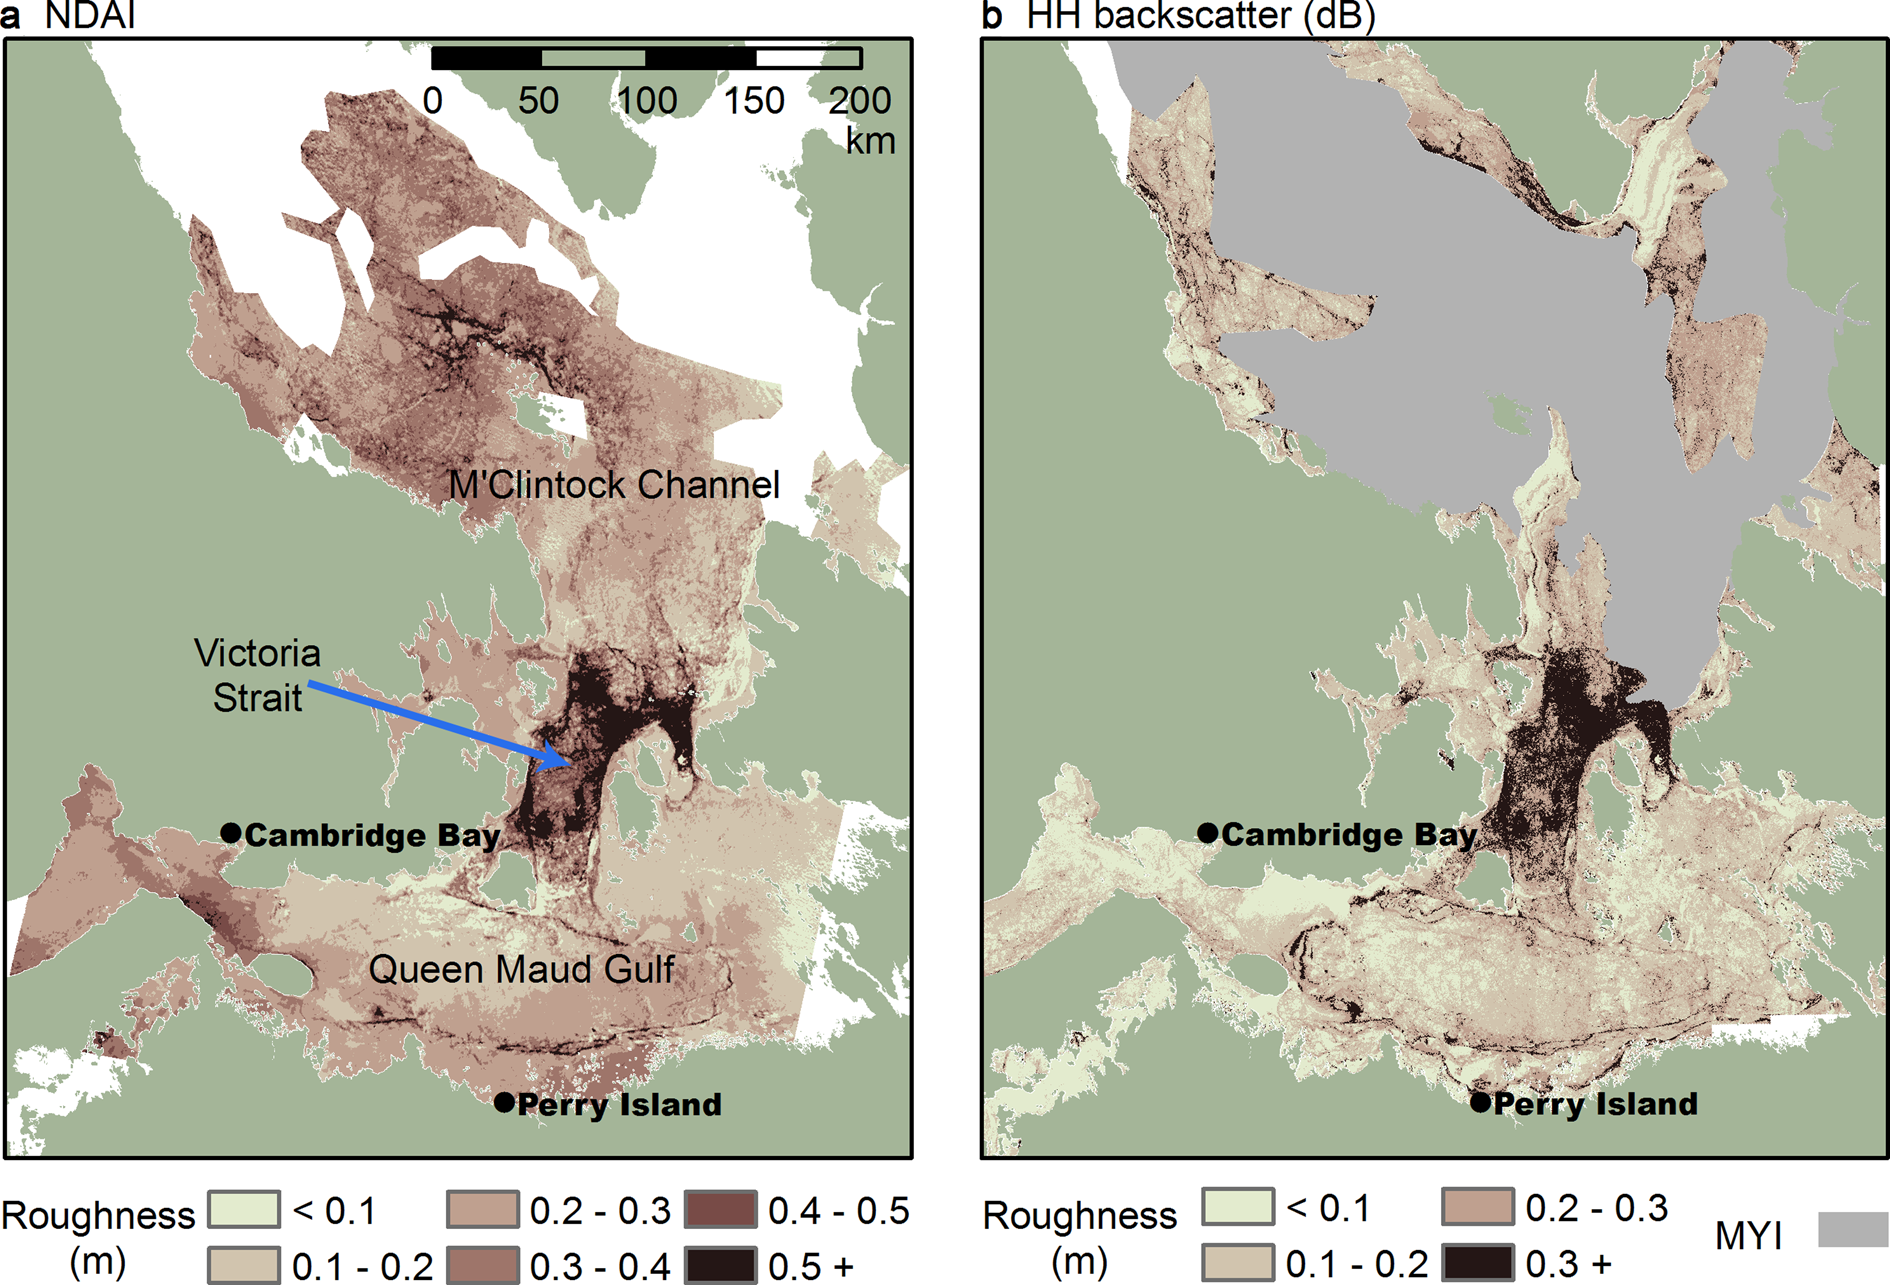
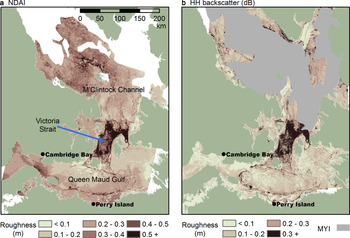
Using the models in Fig. 8, predicted sea-ice roughness is visualized in Fig. 9. Models of roughness are useful because they output data in relatable and comparable formats (Dammann and others, Reference Dammann, Eicken, Mahoney, Saiet, Meyer and George2018; Gegiuc and others, Reference Gegiuc, Similä, Karvonen, Lensu, Mäkynen and Vainio2018; Cafarella and others, Reference Cafarella, Scharien, Geldsetzer, Howell, Segal and Nasonova2019). Smooth and rough ice areas are generally consistent between maps. For example, smooth ice ringed by rougher ridges is observed in Queen Maud Gulf, and deformed ice is observed in Victoria Strait. The NDAI-derived roughness is generally higher than HH backscatter-derived roughness in areas of FYI (e.g., Dease Strait and portions of M'Clintock Channel) and DFYI (e.g., Victoria Strait). In areas of MYI, NDAI shows a wide range of roughness values, while the HH backscatter-derived roughness is masked.
Modeled roughness based on regression fits of measured roughness and (a) NDAI, and (b) HH backscatter. The models use the relationships determined in Fig. 8, which were trained on balanced FYI and MYI data (NDAI) and FYI data (HH backscatter). The largest roughness class in each region (darkest) represents data that are outside (rougher) than the data used to train the model. In (b), the model is not applied to MYI, shown in blue and obtained from the 10 April 2017 weekly regional Canadian Ice Service chart.
3.3 Ice type classification
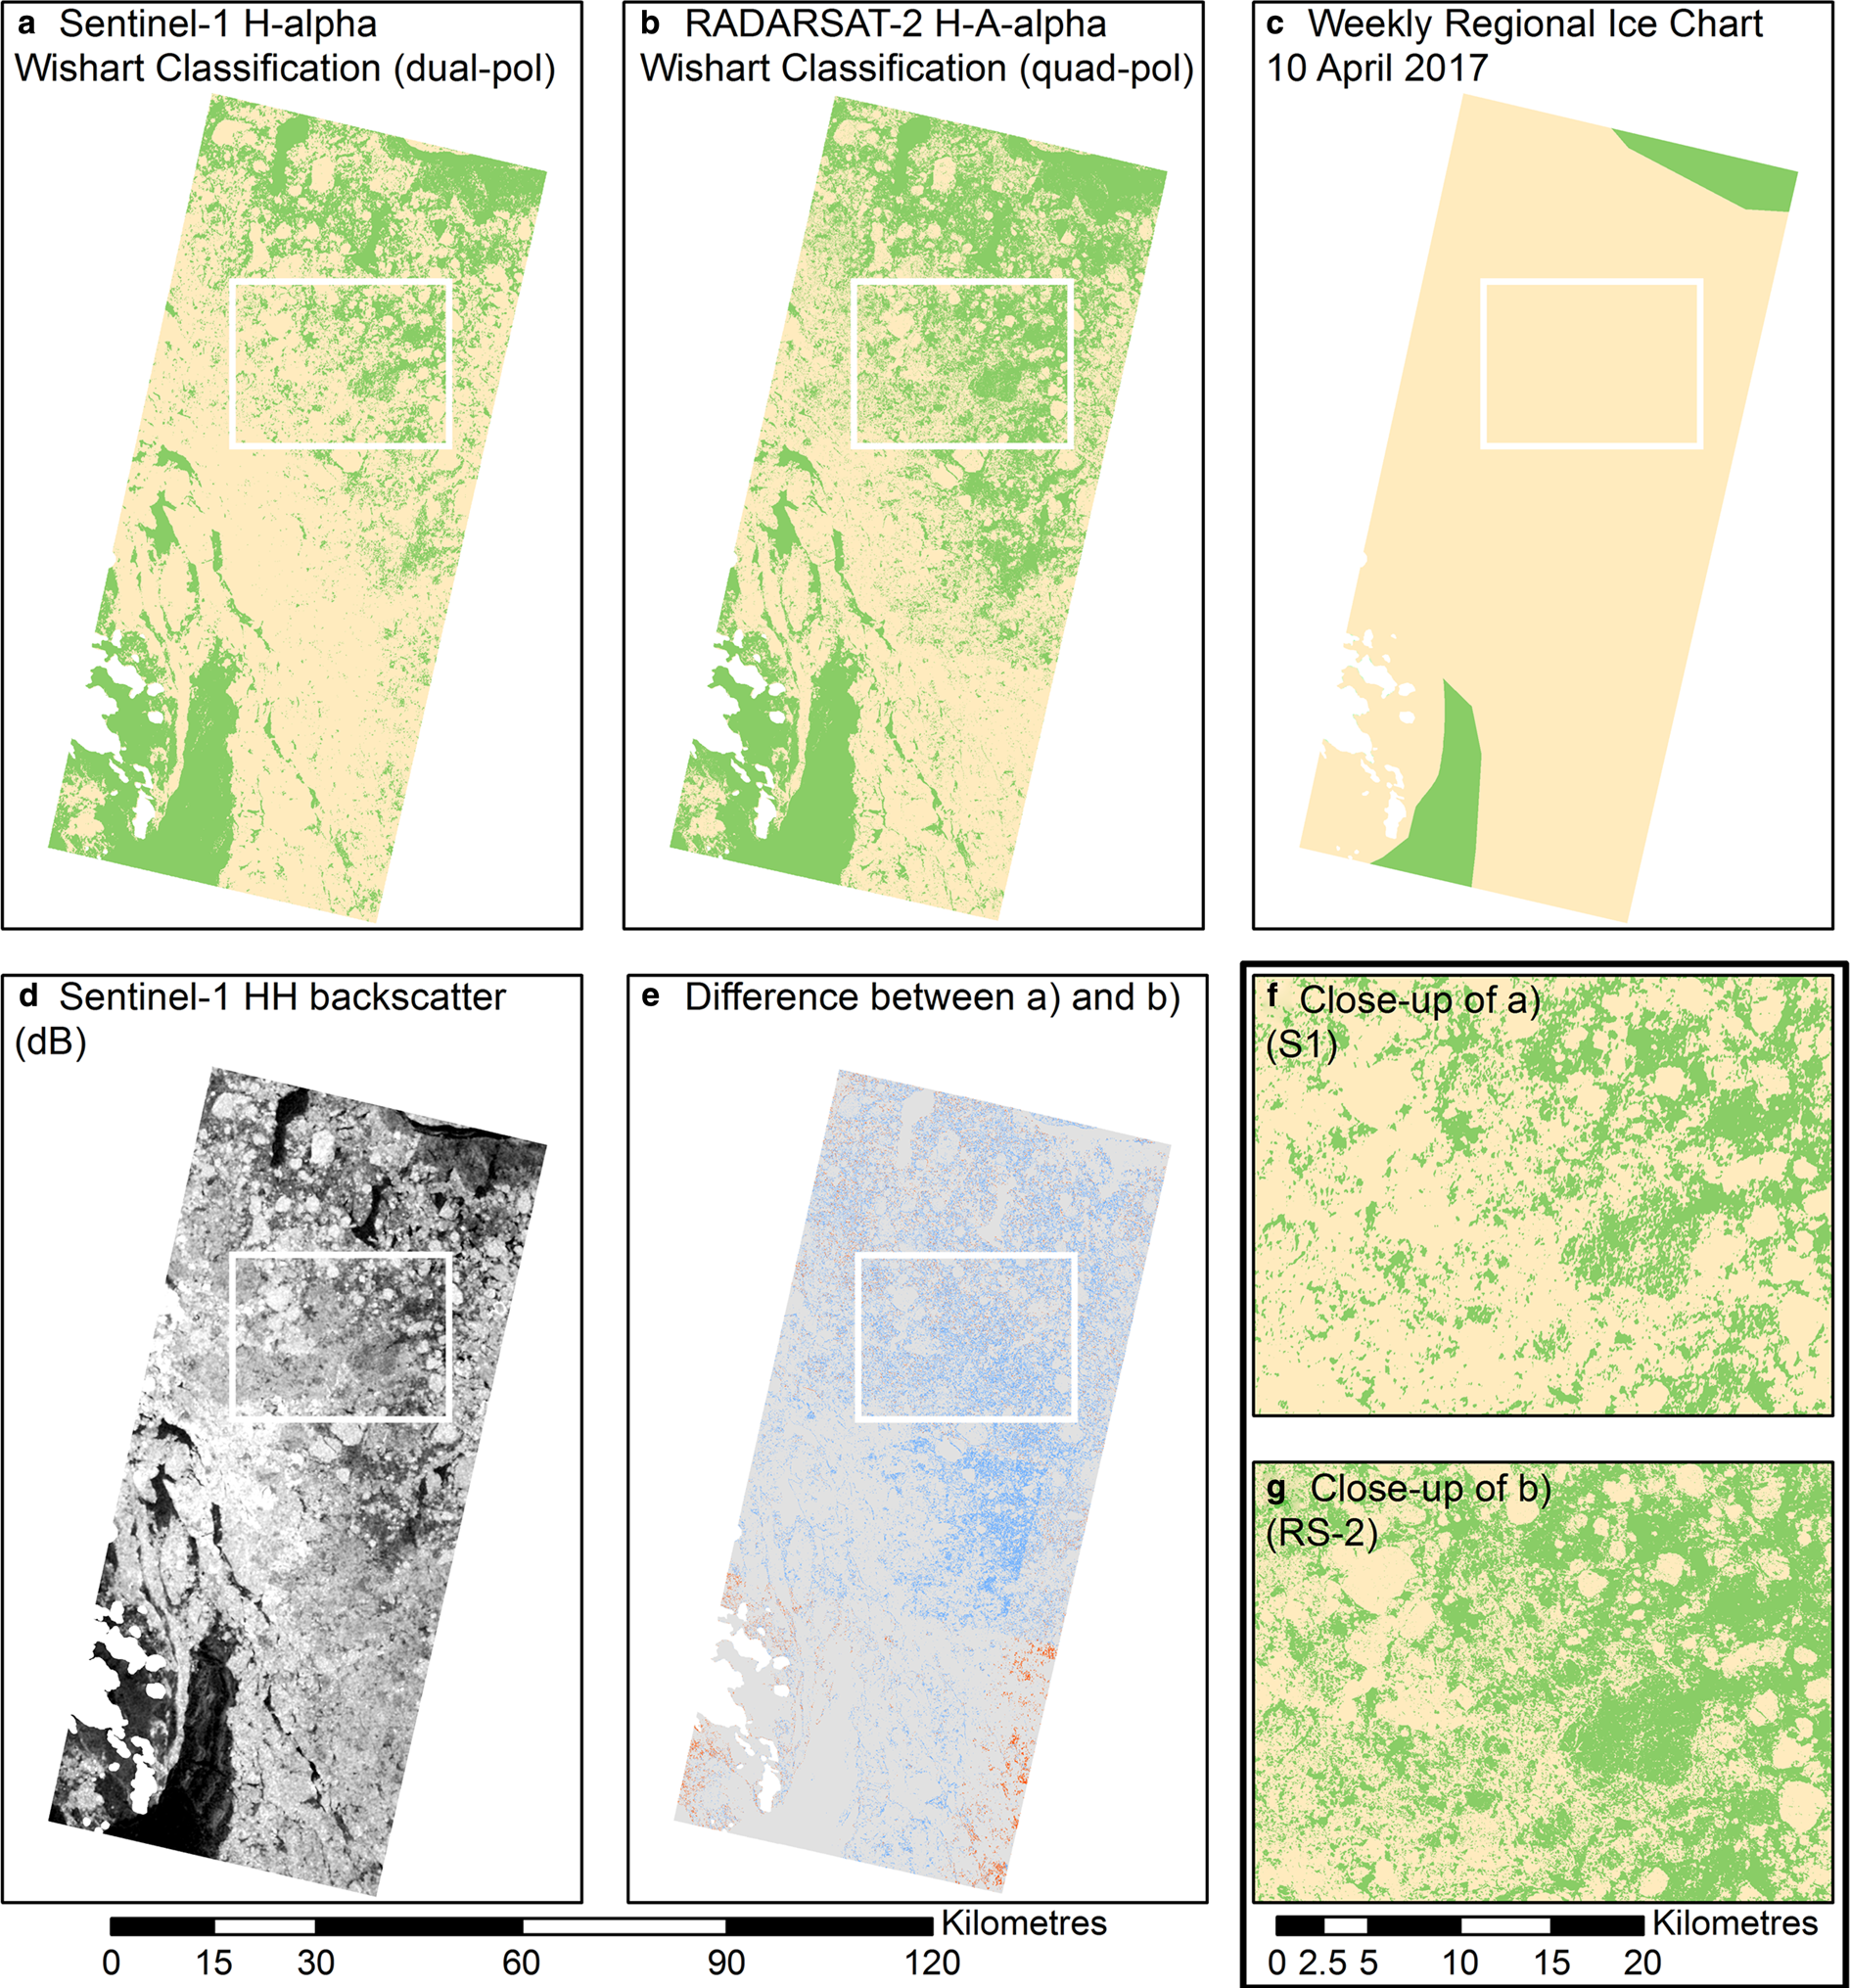
The Sentinel-1 and RADARSAT-2 ice type classification results are similar, and both have high overall accuracy (κ = 0.83), as shown in Fig. 10 and Table 4. There is also generally good agreement with the coarser-scale CIS regional weekly ice chart for the same time period (Fig. 10c). MYI, seen in the Sentinel-1 HH backscatter image in Fig. 10d as bright and (typically) rounded ice floes, qualitatively corresponds to MYI in each classification. The Sentinel-1 classification identified more MYI than the RADARSAT-2 classification, as seen by the blue color in Fig. 10e.
Evaluation of (a) the Sentinel-1-based H-Alpha dual-pol Wishart classification and its ability to detect areas of MYI (yellow) and FYI (green). Images are from April 2017 in M'Clintock Channel. Comparisons are made to: (b) the RADARSAT-2-based H-A-Alpha quad-pol Wishart classification, (c) the corresponding weekly regional sea-ice chart produced by the Canadian Ice Service; and (d) Sentinel-1 HH backscatter (in dB). In (e) the difference between (a) and (b) is shown, with grey representing areas where the two classifications agree, and blue (red) representing areas where Sentinel-1 found MYI (FYI) but RADARSAT-2 found FYI (MYI). Images (f) and (g) are insets of (a) and (b) respectively, denoted by the white boxes in the outset images.
Confusion matrices for MYI detection using an H-Alpha Wishart classification on Sentinel-1 imagery (dual-pol) and H-A-Alpha Wishart classification on RADARSAT-2 imagery (quad-pol)
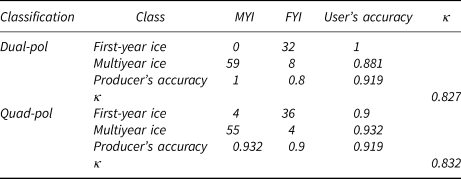
Producer's accuracy measures the probability of omission error whereas user's accuracy measures commission error. κ is a measure of actual vs. chance agreement in the classification, as calculated in Congalton (Reference Congalton1991).
4. Discussion
4.1 MISR NDAI
NDAI from this study is comparable to results from other snow-covered ice regimes such as the Greenland ice sheet, Antarctic sea ice and an Antarctic ice shelf (Nolin and others, Reference Nolin, Stroeve, Scambos and Fetterer2001; Li, Reference Li2018). Unfortunately, data about expected NDAI values for cryospheric environments are not readily available. Nolin and others (Reference Nolin, Fetterer and Scambos2002) and Nolin and Payne (Reference Nolin and Payne2007) found that NDAI and LiDAR roughness from glacier ice are strongly related, with R 2 values of 0.27–0.74 and correlations approaching r = 0.9 (except in areas of smooth ice; r = 0.1), respectively. Better functionality of NDAI for rougher surfaces is also seen in our study, with significant correlations found between NDAI and roughness for MYI, and between NDAI and HH backscatter for DFYI. The non-significant correlation between roughness and NDAI for FYI may be due in part to the low range of roughness levels that are difficult to detect using reflectance variations.
More research is needed to understand the sub-pixel geophysical properties like feature spatial scale, orientation and solar illumination that impact angular MISR reflectance and multi-angle roughness estimates. For sea ice, this means that accounting for snow properties (e.g., grain size and density) as well as feature distributions and orientations (e.g., of snow dunes and sastrugi) will likely lead to stronger and more consistent relationships between NDAI and sea-ice roughness. A better understanding of sub-pixel geophysical properties may also help reconcile the findings of two studies that observed different relationships with roughness using MISR-based (but not NDAI-based) techniques, described below.
Using a nearest neighbor approach within an optimal prediction radius, Nolin and Mar (Reference Nolin and Mar2019) found that their MISR-based roughness calculations are more strongly related to measured roughness over smooth sea ice (0–20 cm; R 2 = 0.52) than rough sea ice (0–100 cm; R 2 = 0.39) in the Beaufort Sea. In the same study, they also found that MISR-based roughness has about half the variance of LiDAR-based roughness, especially in areas of roughness exceeding 20 cm. This discrepancy may be due to Nolin and Mar's LiDAR-MISR comparison methods, inclusion of the nadir camera angle, the application to a different and potentially mobile ice regime or sub-pixel influences that are not yet fully understood.
Contradictions in MISR observations of roughness were also found in a study of Chinese dunes (Wu and others, Reference Wu, Gong, Liu and Chappell2009). Backscattering was stronger from the site with the least macroscale roughness and Aeolian sandy soils, compared to rougher sites with small coarse-grain sand dunes and Aeolian sandy soils. Wu and others concluded that rough surfaces usually, but not always, produce more backward scattering than smooth surfaces. Exceptions may be due to sub-pixel sand ripples (which rise and fall vertically) and the orientation of dune facets that modify the angular pattern of reflectance.
4.2 Sentinel-1 HH backscatter
As expected, HH backscatter from smooth FYI is low and the range of values small, meaning that high backscatter from DFYI may be separated with minimal overlap between the two categories. Results from this study, and previous studies covering various Arctic regions, show that HH backscatter from FYI generally increases with increasing deformation (Table S2). HH backscatter values for FYI and DFYI within and near the Canadian Arctic Archipelago are remarkably similar to this study, and extrapolation of our mapping methods across this region may be possible with minimal modification. However, contextual knowledge is critical because SAR backscatter is influenced by a number of parameters in addition to surface roughness, including the local radar beam incidence angle (at scales greater than the wavelength), inhomogeneities in the ice (e.g., air bubbles, cracks, crystal structure), orientation of ice features, dielectric properties including brine in snow and brine at the snow–sea-ice interface, the signal to noise ratio, as well as frequency, polarization and spatial resolution (Dierking and Dall, Reference Dierking and Dall2007). Moreover, the assumption made here is that the snow is transparent and Sentinel-1 backscatter originates at the sea-ice surface. For situations where backscatter occurs at the snow surface, such as wet snow and reduced radar penetration depth, azimuth angle controls on backscatter due to orientations of snow dunes would need to be considered (e.g., see Fraser and others, Reference Fraser, Young and Adams2014). Other regions or ice types may require specialized datasets for mapping surface properties; for example, to map Koksoak River ice near the community of Kuujjuaq, Gauthier and others (Reference Gauthier, Tremblay, Bernier and Furgal2010) required fine-scale radar, hydrographic vectors and digital elevation models.
Low MYI salinity allows C-band SAR to penetrate the upper sea-ice volume, where scattering occurs from air bubbles and other particles within the sea-ice volume; this results in consistently high backscatter regardless of surface roughness (Kim and others, Reference Kim, Moore and Onstott1984; Hallikainen and Winebrenner, Reference Hallikainen and Winebrenner1992; Perovich and others, Reference Perovich, Longacre, Barber, Maffione, Cota, Mobley, Gow, Onstott, Grenfell, Pegau, Landry and Roesler1998; Geldsetzer and Yackel, Reference Geldsetzer and Yackel2009). The salinity of MYI is typically much lower than FYI, in the range of 0.1–3 ppt for MYI compared to 5–8 ppt for 1–2 m thick FYI (Weeks, Reference Weeks1981) due to desalination processes that occur at warmer melt season temperatures. Freshened sea ice due to riverine inputs also behaves similarly (Segal, Reference Segal2019; Segal and others, Reference Segal, Scharien, Duerden and Tamin press). We recommend further study of low salinity roughness using X-band and higher frequency SAR (see Supplementary materials).
4.3 Maps for communities
The intended goal of this study is to use Sentinel-1 HH backscatter to make roughness maps for communities. Therefore, marking the spatial extent of MYI and riverine output areas could be an alternative to using optical-derived roughness indices in place of backscatter because travelers have a wealth of contextual information about MYI navigation. Using the Sentinel-1 H-Alpha Wishart classification, we found evidence that MYI areas are identifiable during the winter (pre-melt) period. The use of Sentinel-1 polarimetry to identify ice type is opportune because the freshened ice can be separated from FYI areas using the same images as the roughness classification, resulting in temporally and spatially-cohesive information. However, while we found similar classification accuracy for Sentinel-1 and RADARSAT-2 (κ = 0.83 for both sensors), Engelbrecht and others (Reference Engelbrecht, Theron, Vhengani and Kemp2017) used a polarimetric comparison between Sentinel-1 and RADARSAT-2 and found that Sentinel-1 had lower overall accuracy and κ values than RADARSAT-2 by ~3% and 0.15, respectively. They suggested the difference might be due to dual-pol scattering mechanism separation difficulties. Furthermore, it is likely that in a region with DFYI, there would be some overlap with the MYI class. The area in Fig. 10 that was classified contains MYI floes surrounded by FYI, but lacks DFYI. Further studies are needed to understand the findings in areas with DFYI, as well as different scales and environments like riverine output areas. High noise effects and artifacts in the HV channel used in dual-polarimetric techniques may be problematic.
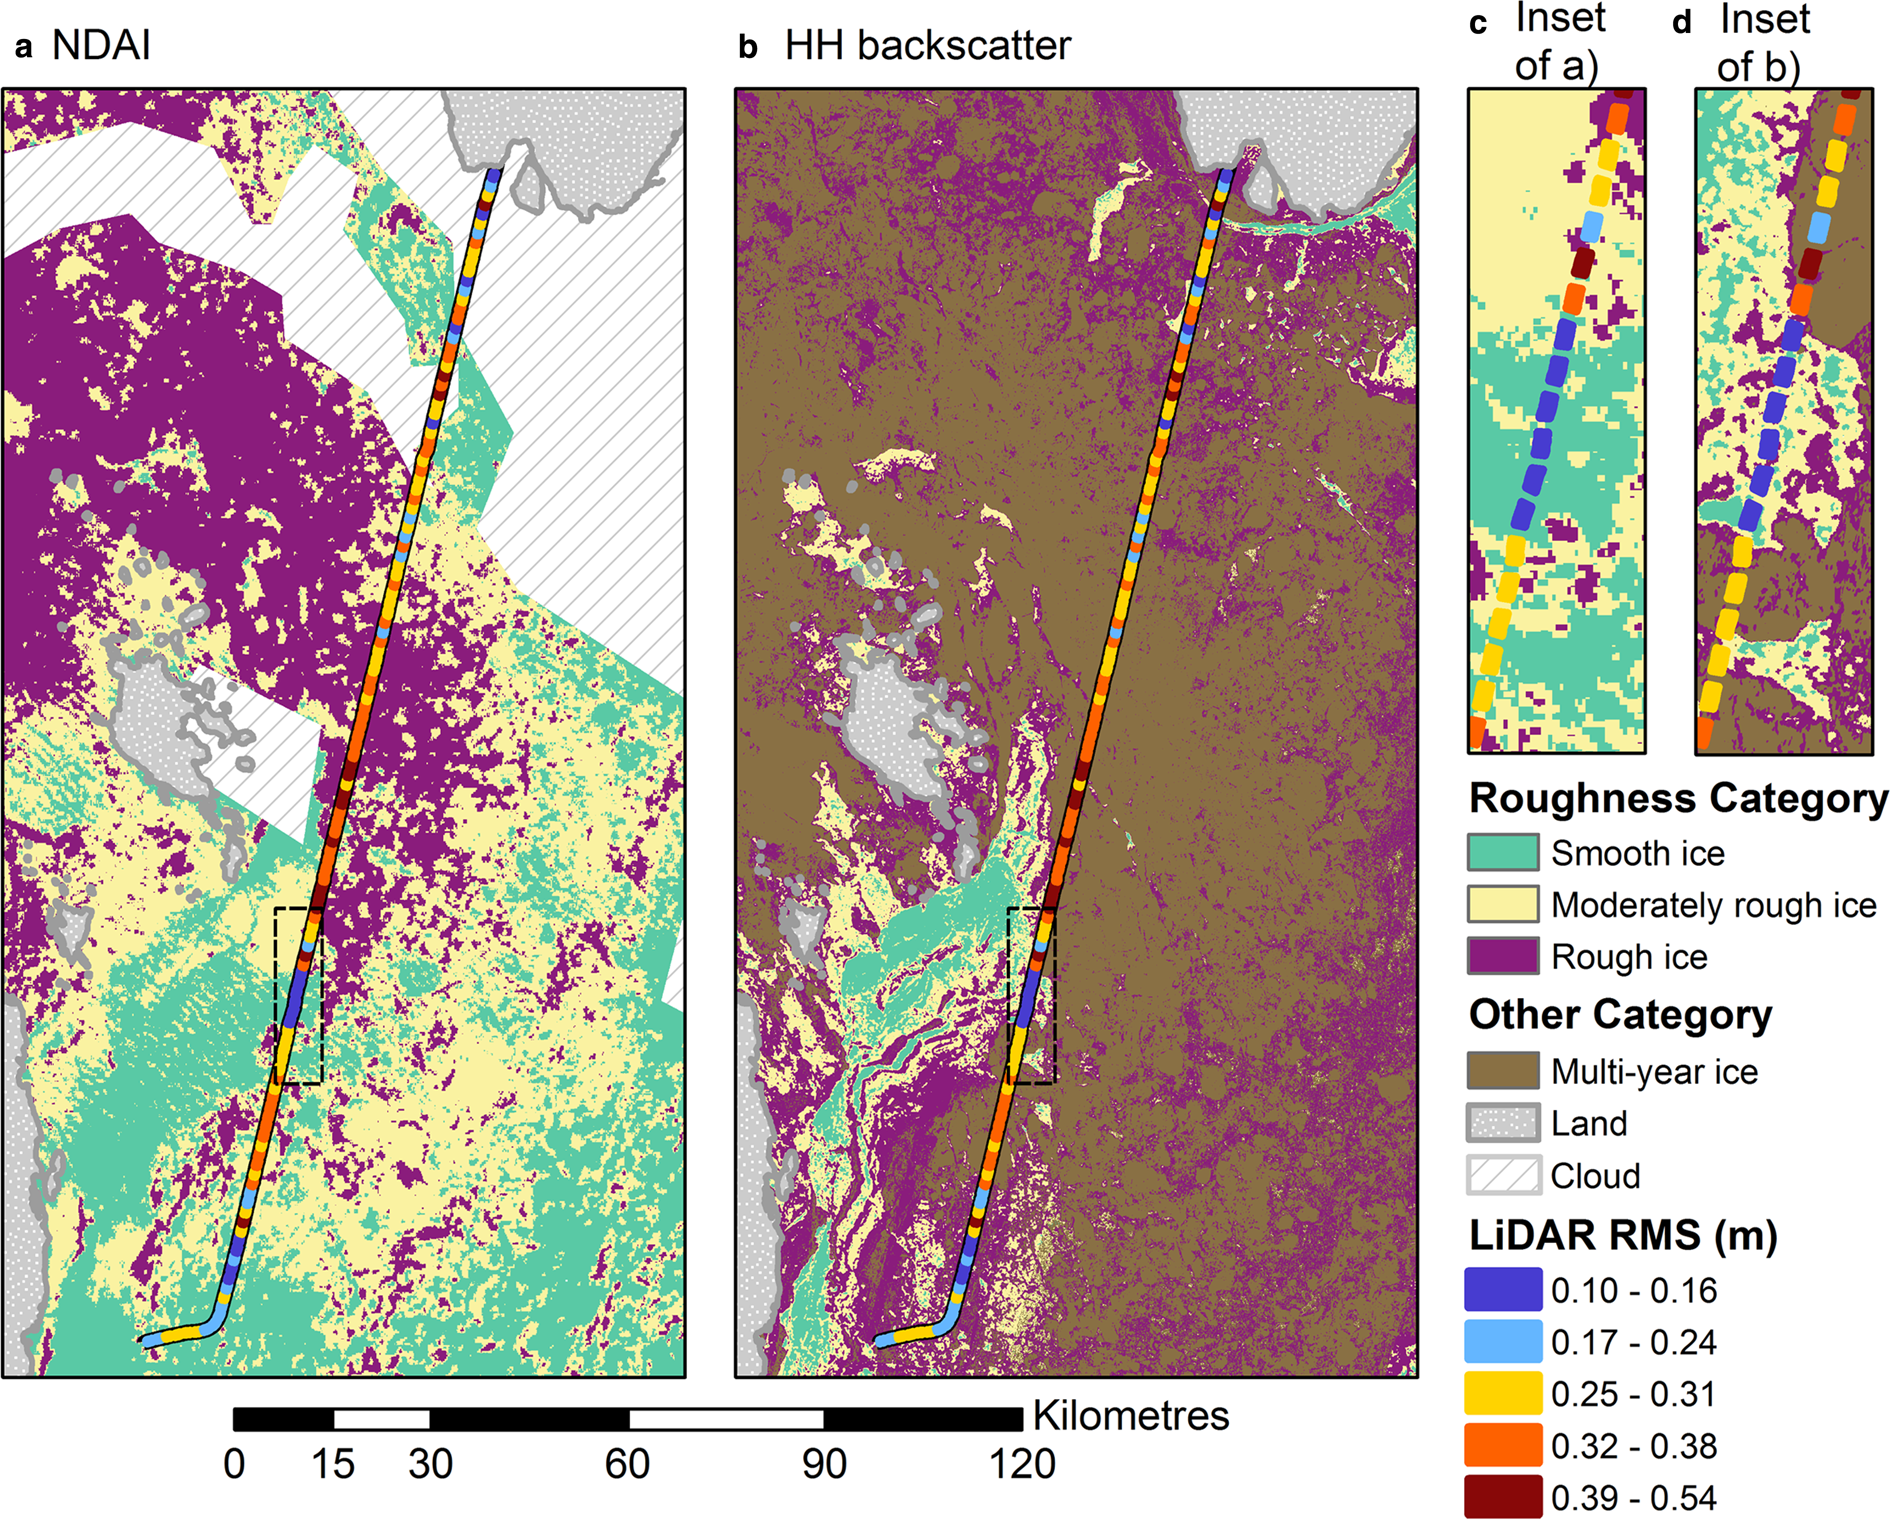
NDAI and HH backscatter thresholds were used to create pseudo-roughness maps in a format useful for guiding on-ice travel by people in northern communities. The maps display smooth ice, moderately rough ice and rough ice types (Fig. 11). Thresholds were determined by visually inspecting the measured roughness along the LiDAR track. The moderately rough ice category serves to provide space between the smooth ice and rough ice categories. An MYI classification was overlaid on the HH backscatter roughness map (Fig. 11; see Section 3.3). Note that where the Sentinel-1 maps (Figs 11b and d) show areas of MYI, NDAI still shows the roughness categories.
Thresholded roughness maps from (a) NDAI and (b) HH backscatter. Overlaid gridcells show measured roughness along the LiDAR flight path. Insets of (c) NDAI and (d) HH backscatter are indicated by a dotted black line.
4.4 Snow surface roughness
Snowmobile trafficability is impacted by a combination of snow and ice surface roughness. As an optical sensor, MISR reflectance originates at the snow surface, provided there is no atmospheric interference. In winter conditions, Sentinel-1 C-band SAR penetrates through cold and dry snow to either the sea-ice surface, or the point in the snow where there is a saline and high dielectric layer in the case of FYI. Consequently, areas with ice rubble covered by snow may remain rough according to C-band SAR (Manninen, Reference Manninen1997), but are actually perceived as smooth, trafficable surfaces by travelers. Conversely, surface relief can be created by snow on the sea ice, rather than the ice itself (Polashenski and others, Reference Polashenski, Perovich and Courville2012), and wind-roughened snow decreases trafficability. This roughening may or may not increase SAR roughness (Manninen, Reference Manninen1997): microwave sensors can be impacted by snow properties (e.g., density, grain size, salinity, temperature, ice crusts) (Perovich and others, Reference Perovich, Longacre, Barber, Maffione, Cota, Mobley, Gow, Onstott, Grenfell, Pegau, Landry and Roesler1998; Johansson and others, Reference Johansson, King, Doulgeris, Gerland, Singha, Spreen and Busche2017).
Snow depth distributions depend on wind speeds, particularly during distinct storm events (Sturm and others, Reference Sturm, Holmgren and Perovich2002), as drifting snow particles interact with ice and snow topography (Massom and others, Reference Massom, Eicken, Hass, Jeffries, Drinkwater, Sturm, Worby, Wu, Lytle, Ushio, Morris, Reid, Warren and Allison2001; Moon and others, Reference Moon, Nandan, Scharien, Wilkinson, Yackel, Barrett, Lawrence, Segal, Stroeve, Mahmud, Duke and Else2019), with the degree of sea-ice deformation playing a role (Fetterer and Untersteiner, Reference Fetterer and Untersteiner1998; Herzfeld and others, Reference Herzfeld, Maslanik and Sturm2006). Snow and the upper ice layers are systematically related: studies have observed that snow dunes are largely stationary throughout the ice growth season (Barnes and others, Reference Barnes, Reimnitz, Toimil and Hill1979; Petrich and others, Reference Petrich, Eicken, Polashenski, Sturm, Harbeck, Perovich and Finnegan2012). The snow cover progresses seasonally; for example, from nearly featurelessness (January), to dunes mostly perpendicular to the dominant wind direction (February), to more consistent dunes parallel to the dominant wind direction (March–April) and finally to ice islands (June) (Petrich and others, Reference Petrich, Eicken, Polashenski, Sturm, Harbeck, Perovich and Finnegan2012). However, only coarse estimates of ice roughness can be made from ice surface measurements (Manninen, Reference Manninen1997), and mismatches between the snow and sea-ice surface will decrease the accuracy of SAR-based roughness maps.
There is currently no efficient and cost-effective method for using satellites to measure on-ice snow depth at the fine scales (<~300 m) desired to improve sea-ice roughness maps for community use. However, snow depth has been estimated at larger scales using passive microwave data (Stroeve and others, Reference Stroeve, Markus, Maslanik, Cavalieri, Gasiewski, Heinrichs, Holmgren, Perovich and Sturm2006; Rostosky and others, Reference Rostosky, Spreen, Farrell, Frost, Heygster and Melsheimer2018), Ku and Ka band altimeters (Lawrence and others, Reference Lawrence, Tsamados, Stroeve, Armitage and Ridout2018) and spaceborne scatterometer data (Yackel and others, Reference Yackel, Geldsetzer, Mahmud, Nandan, Howell, Scharien and Lam2019) or at small temporal scales using airborne or in situ studies (e.g., using Operation IceBridge data) (Kurtz and Farrell, Reference Kurtz and Farrell2011; Newman and others, Reference Newman, Farrell, Richter-Menge, Conner, Kurtz, Elder and McAdoo2014; Lawrence and others, Reference Lawrence, Tsamados, Stroeve, Armitage and Ridout2018). Models like SnowModel can reproduce FYI snow distributions given significant inputs for a region, including data on meteorology; sea-ice topography; sea-ice presence, depth and age; sea-ice mass balance; as well as snow depth mean, std dev. and dune wavelength (Liston and Hiemstra, Reference Liston and Hiemstra2011; Liston and others, Reference Liston, Polashenski, Rösel, Itkin, King, Merkouriadi and Haapala2018). However, the knowledge of (a) prevailing winds, which redistribute snow; (b) location, as the central Arctic has very thin snow depths (Newman and others, Reference Newman, Farrell, Richter-Menge, Conner, Kurtz, Elder and McAdoo2014); (c) ice type, as smooth FYI generally has shallower snow depths than DFYI and MYI (Kurtz and Farrell, Reference Kurtz and Farrell2011; Newman and others, Reference Newman, Farrell, Richter-Menge, Conner, Kurtz, Elder and McAdoo2014; Merkouriadi and others, Reference Merkouriadi, Gallet, Graham, Liston, Polashenski, Rösel and Gerland2017); and (d) date, as snow accumulates over the season (Petrich and others, Reference Petrich, Eicken, Polashenski, Sturm, Harbeck, Perovich and Finnegan2012); all allow experienced sea-ice users to infer probable snow coverage. However, snow accumulation may be decreasing in the western Arctic as freeze-up is delayed, from an average of 35.1 ± 9.4 to 22.2 ± 1.9 cm (by 37 ± 29%) (Webster and others, Reference Webster, Rigor, Nghiem, Kurtz, Farrell, Perovich and Sturm2014). In situ measurements show a mean snow depth on smooth FYI of ~8 cm at Cambridge Bay between October and May, decreasing by ~0.8 cm a−1 (1960–2014), with linear growth over the season, peaking in May (Howell and others, Reference Howell, Laliberté, Kwok, Derksen and King2016).
4.5 Other data and recommendations
This study mainly focuses on evaluating the utility of Sentinel-1 for providing information to communities due to its availability. Other satellites or satellite modes that are available for a cost would offer other benefits, but are more difficult for individuals to access (e.g., RADARSAT-2). For example, northern sea-ice users would benefit from high-resolution data. While the spatial resolution of open-access Sentinel-1 images in this region (40 m) is significantly higher than the MISR images (275 m), both provide data at scales useful for investigating roughness. However, with higher resolution datasets, information from small-scale roughness features like pressure ridges and other features (e.g., ice cracks) could be resolved. These finer-scale features also impact trafficability and safety, as features like pressure ridges may not be crossable along their entire length.
Other data types like multi-angle and stereo-pair imagery, or other radar frequencies like L- and X-bands, also offer the potential to provide information on sea-ice roughness (Table S3). However, there are currently no other radar frequencies with freely available and current data, or as extensive a research history for sea-ice mapping applications as C-band. See Supplementary materials Section 6.5 for a discussion of current and near-future satellite datasets that may be useful (high quality and/or affordable) for providing sea-ice surface trafficability information to northern communities.
5. Conclusions
A broad-scale inter-comparison was done of the MISR-derived roughness index NDAI and calibrated HH backscatter from Sentinel-1 for an area of winter sea ice comprising FYI, DFYI and MYI. Overall, NDAI and HH backscatter are significantly correlated (r = 0.54). Analysis of correlations by ice type revealed that NDAI and HH backscatter are strongly correlated for DFYI (r = 0.91) and not correlated for FYI and MYI. Agreement between NDAI and HH backscatter for DFYI follows an exponential relationship (R 2 = 0.88). For FYI, it is likely that the low range of roughness for this smooth ice type is not captured by the NDAI which leads to disagreement. For MYI, the influence of volume scattering on HH backscatter leads to disagreement with NDAI.
A fine-scale inter-comparison of NDAI, HH backscatter and LiDAR-derived surface roughness was done along a LiDAR flight line covering FYI and MYI only (i.e., no DFYI). NDAI and HH backscatter are similarly correlated with surface roughness, at r = 0.71 and r = 0.74, respectively. Analyses by ice type revealed that NDAI is correlated with surface roughness for MYI (r = 0.68), and not FYI, whereas HH backscatter is correlated with surface roughness for FYI (r = 0.76), and not MYI. However, by using a balanced dataset of FYI and MYI samples (i.e. similar number of input samples), a significant regression relationship between NDAI and roughness is found (R 2 = 0.65). Between HH backscatter and roughness, a significant regression relationship is found for FYI only (R 2 = 0.58). In the context of providing roughness information from Sentinel-1 only, a dual-polarization classification technique is shown to be effective at identifying and potentially masking out the MYI areas. Ultimately, results from the statistical analyses point to the potential use of Sentinel-1 HH backscatter for mapping FYI roughness, and MISR NDAI for mapping MYI roughness, to create an integrated roughness product. A more generalized approach involves separating smooth ice, moderately rough ice and rough ice types using NDAI or HH backscatter thresholds and overlaying a multiyear ice layer on the HH backscatter map to provide extra utility and accuracy. A comparison of these thresholded maps to LiDAR-derived roughness data reveals that it is possible to create clear and simple roughness products for use by northerners from open-access datasets.
Future quantitative data collection would be useful for further refining the roughness thresholds considered trafficable in northern communities. The collection and analysis of high-resolution validation data close to the focus communities, as well as an evaluation of higher resolution (i.e., <40 m) and complementary datasets (e.g., RCM, X-and L-band SAR, multispectral) would provide additional data for the understanding of community-scale sea-ice roughness. Further analysis could also address other identified information needs like ice fractures and slush/water on ice, and discrepancies between metrics of roughness and the real experience of roughness in the context of travel (Scharien and others, Reference Scharien, Segal, Nasonova, Nandan, Howell and Haas2017; Segal, Reference Segal2019; Segal and others, Reference Segal, Scharien, Duerden and Tamin press).
Supplementary material
The supplementary material for this article can be found at https://doi.org/10.1017/aog.2020.48.
Acknowledgements
This research was supported by the Marine Environmental Observation Prediction and Response (MEOPAR) network and Irving Shipbuilding Inc. project number 1.22, Polar Knowledge Canada (POLAR; project number NST-1718-0024), the W. Garfield Weston Foundation through the Association of Canadian Universities for Northern Studies (ACUNS), the Natural Sciences and Engineering Research Council of Canada (NSERC), the Royal Canadian Geographical Society (RCGS), the Arctic Institute of North America (AINA), the University of Victoria and the UK Natural Environment Research Council Large Grant NE/M021025. We thank the British Antarctic Survey (BAS) and Technical University of Denmark (DTU) for providing airborne LiDAR data. We Thank James Balchin for Sentinel-1 video creation, and Anne Nolin and Gene Mar for providing code to undertake MISR imagery atmospheric correction. We also appreciate the work of two reviewers who improved the manuscript significantly. Sentinel-1 data are freely provided by the European Space Agency (ESA). MISR data are provided freely by the Langley Atmospheric Science Data Center at the North American Space Agency (NASA). RADARSAT-2 data (© MacDonald, Dettwiler and Associates Ltd, 2012; all rights reserved) are provided by the Canadian Ice Service (CIS). RADARSAT is an official mark of the Canadian Space Agency (CSA).
Conflict of interest
None.




 Open access

