Introduction
UWB technology received a major boost especially in 2002 since the US Federal Communication Commission (FCC) permitted the authorization of using the unlicensed frequency band starting from 3.1 to 10.6 GHz for commercial communication applications [1]. Earlier it was mainly used for the military and short-range applications but today ultrawide band (UWB) antennas have gained enormous attention in various research applications. Since the first public research reports on wearable antennas in 1999 [Reference Salonen, Sydanheima, Keskilammi and Kivikoski2], there has been a tremendous research in the UWB technology for wearable applications during the last decade because of its properties such as high data rates, low power consumption, and wide impedance bandwidth [Reference Gupta, Maheshwari and Kumar3]. It is necessary that a wearable antenna must possess certain essential properties like flexible and lightweight design, easy fabrication, low back radiations, high gain, and wide impedance bandwidth. Compared to the conventional flat and rigid metallic structures, flexible antennas are much more suitable for body wearable applications in which devices are worn on the body [Reference Reddy, Kumar, Rao, Tiwari and Balachary4]. When we place a wearable antenna over the human body, it suffers from the problems like shifting in resonance frequencies when it is bent or rolled and absorption of harmful radiations by the human body. Therefore, to save the human body from harmful radiations, metamaterials are extensively used, which not only reduce the energy absorbed by the body but also help to enhance the gain, radiation efficiency, and forward radiation characteristics of the designed antenna.
Various types of wearable antenna are designed by the researchers in the recent years that include flexible [Reference Zahran, Gaafar and Abdalla5–Reference Al-Sehemi, Al-Ghamdi, Dishovsky, Atanasov and Atanasova7], textile-based [Reference Poffelie, Yan and Vandenbosch8–Reference Sundarsingh, Kanagasabai and Ramalingam13], single band [Reference Ferreira, Pires, Rodrigues and Caldeirinha10, Reference Sundarsingh, Kanagasabai and Ramalingam13, Reference Abbasi, Nikolaou and Antoniades14], triple band [Reference Al-Sehemi, Al-Ghamdi, Dishovsky, Atanasov and Atanasova7], wideband [Reference Zahran, Gaafar and Abdalla5, Reference Elyassi and Moradi6, Reference Poffelie, Yan and Vandenbosch8, Reference Belrhiti, Riouch, Tribak, Terhzaz and Sanchez15], and antennas with metamaterial [Reference Giman, Soh, Jamlos, Lago, Al-Hadi, Abdulmalek and Abdulaziz11, Reference Lago, Soh, Jamlos, Shohaimi, Yan and Vandenbosch12, Reference Abbasi, Nikolaou and Antoniades14, Reference Kwak, Sim, Kwon and Yoon16]. In [Reference Kwak, Sim, Kwon and Yoon16] an artificial magnetic conductor (AMC) structure is used with planar inverted-F antenna (PIFA) to reduce the specific absorption rate (SAR) value. In [Reference Abbasi, Nikolaou and Antoniades14] an antenna operating at 2.45 GHz uses electromagnetic band gap (EBG) structure to achieve gain of 6.88 dBi on the human body. In [Reference Zahran, Gaafar and Abdalla5, Reference Belrhiti, Riouch, Tribak, Terhzaz and Sanchez15] two wideband antennas using Rogers Ultralam 3850 and FR4 as substrate material are designed. In [Reference Elyassi and Moradi6, Reference Poffelie, Yan and Vandenbosch8] two wideband CPW fed multilayered and moon-shaped antennas are designed. In [Reference Silva, Freire, Serres, Silva and Silva9] a wearable antenna inspired by the geometry of a Gynkgo Biloba leaf is designed by using Gielis formula. In [Reference Ferreira, Pires, Rodrigues and Caldeirinha10] an antenna operating at 2.4 GHz is designed and its bending characteristics are studied at different human body parts. In [Reference Giman, Soh, Jamlos, Lago, Al-Hadi, Abdulmalek and Abdulaziz11, Reference Lago, Soh, Jamlos, Shohaimi, Yan and Vandenbosch12] antennas are designed using metamaterials to improve their gain and radiation characteristics. Most of the papers discussed above except [Reference Zahran, Gaafar and Abdalla5, Reference Elyassi and Moradi6, Reference Poffelie, Yan and Vandenbosch8, Reference Belrhiti, Riouch, Tribak, Terhzaz and Sanchez15] are dual or single band antennas, however, a wide band antenna is more desirable for wearable applications due to frequency shifting problem. Further volume occupied by these antennas is quite large except in [Reference Zahran, Gaafar and Abdalla5, Reference Elyassi and Moradi6], moreover back radiations emitted from antennas are also not considered except in [Reference Al-Sehemi, Al-Ghamdi, Dishovsky, Atanasov and Atanasova7, Reference Poffelie, Yan and Vandenbosch8, Reference Giman, Soh, Jamlos, Lago, Al-Hadi, Abdulmalek and Abdulaziz11, Reference Lago, Soh, Jamlos, Shohaimi, Yan and Vandenbosch12, Reference Abbasi, Nikolaou and Antoniades14, Reference Kwak, Sim, Kwon and Yoon16] resulting in harmful back radiations towards the human body. Further, the measured gain is quite small in all the above papers, whereas in [Reference Poffelie, Yan and Vandenbosch8, Reference Lago, Soh, Jamlos, Shohaimi, Yan and Vandenbosch12] it is not even calculated.
In this paper initially, two UWB antennas with the same structure and size are designed and fabricated on two different substrates (FR4 and Duroid). After that, a flexible metamaterial structure behaving as a reflector is added, which help to reduce the back radiations. Further, complete analysis of the designed antenna including the study of its bending characteristics, its performance over flat, and cylindrical human phantoms and thin metallic surface behaving as perfect electric conductor (PEC) is done. The SAR values are also calculated using input power of 0.3 W and 0.1 W over 1 g of human tissue. The final design is FR4-based integrated flexible antenna (UWB antenna and metamaterial) which is lightweight, low cost, and easy to fabricate. The paper is partitioned into different sections as follows, the section ‘UWB antenna design’ has design of the proposed UWB antenna, the section ‘MNG metamaterial design’ has design of the mu-negative (MNG) metamaterial, the section ‘Integrated antenna design’ contains UWB antenna with metamaterial surface, the section ‘Study of UWB and integrated wearable antennas’ includes the study of effect on both the wearable antennas (UWB and integrated) over bending and when placed over human phantoms, metallic surface, and finally the section ‘Conclusion’ contains the conclusion.
UWB antenna design
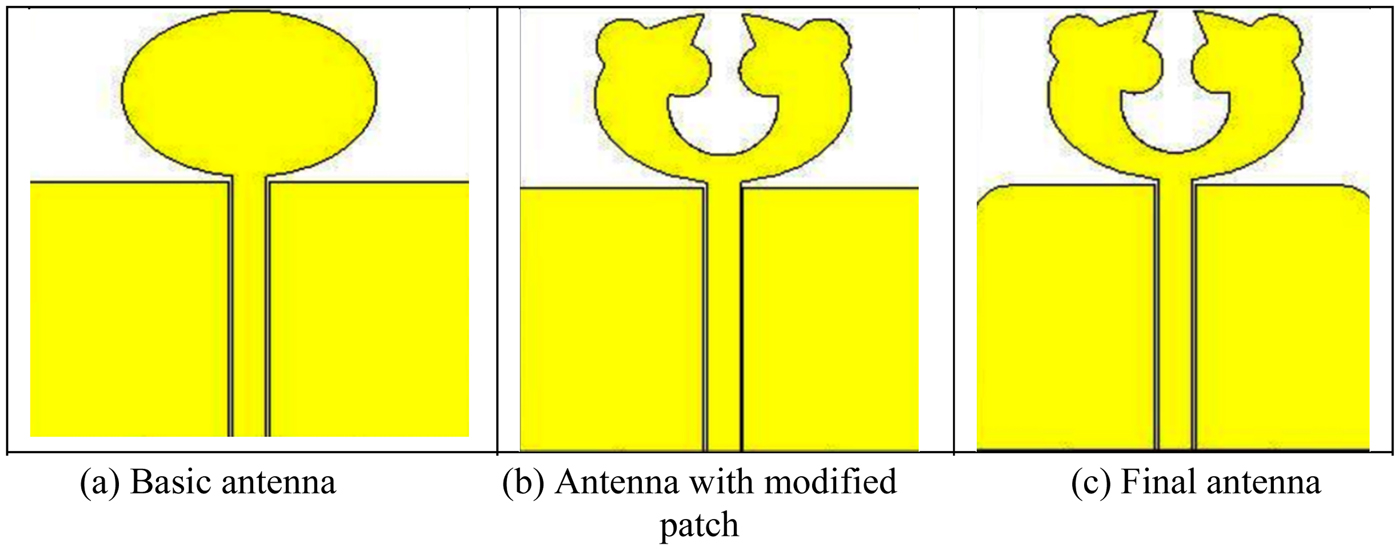
The final geometry of proposed UWB antenna which is fabricated and tested on two different substrates FR4 (ε r = 4.4 and thickness 0.15 mm) and Duroid (ε r = 2.2 and thickness 0.8 mm) is shown in Fig. 1 and its optimized dimensions are given in Table 1. The basic structure of the designed antenna is the elliptical monopole fed by a 50 Ω co-planar waveguide. The reason behind choosing this particular structure is that ellipse-based antennas usually give better bandwidth [Reference Sarkar, Srivastava and Saurav17, Reference Sun, Cheung and Yuk18] and the CPW feeding has many benefits like higher bandwidth and easy integration with other circuit components [Reference Bahrami, Mirbozorgi, Ameli, Rusch and Gosselin19, Reference Denidni and Habib20]. Further to make the antenna ultra-wideband, modifications such as introduction of a slot in the elliptical radiator and beveling of edges of the upper corners of CPW ground plane are done. The stepwise geometrical evolution of the proposed UWB antenna is given in Fig. 2 while the corresponding magnitude of S 11(dB) curve for the concerned structure is shown in Fig. 3. In the first stage, an elliptical patch with CPW feeding (Fig. 2(a)) give rise to three operating bands, one band (3–4.5 GHz) is formed due to resonance around 3.5 GHz, the second band (5.3–11.9 GHz) is formed by combination of resonances around 6.5 and 11.2 GHz, while the third band (13.5–16 GHz) is due to resonance around 15.4 GHz as observed from Fig. 3. In the second stage (Fig. 2(b)) modifications in resonating patch, results in merging of two lower bands and bandwidth enhancement of the upper band as seen from Fig. 3. In the final modification, the upper corners of the ground plane are beveled (Fig. 2(c)) which result in enhancement of operating band from 2 to 16 GHz with better impedance matching (below −20 dB) at four resonating frequencies (3.5/5.8/10.2/14.6/GHz) as shown in Fig. 3. The two proposed UWB antennas are fabricated and their S 11 plots are measured by KEYSIGHT E5063A (100 KHz −18 GHz) vector network analyzer (VNA) after calibration process. Figures 4(a) and 4(b) show the picture of the two fabricated antennas. The simulated and measured S 11 plots of the two antennas are shown in Figs 5(a) and 5(b).
Final geometry of the proposed UWB antenna.

Geometrical evolution of the proposed UWB antenna.
Comparison of |S11| for UWB antenna corresponding to Fig. 2.

Photographs of the fabricated antennas (a) Flexible FR4-based antenna (b) Semi-flexible Rogers RT/duroid-based antenna.

Simulated and measured |S11| plots of the two fabricated antennas (a) using FR4 (b) using Duroid.

Optimized dimensions of the proposed UWB antenna on FR4 and Duroid (all values are in mm)

As seen in Fig. 5(a), the FR4-based antenna's −10 dB down bandwidth ranges from 2.6 to 16 GHz in simulation, and the corresponding measured bandwidth is from 2 to 15.9 GHz. The Duroid-based antenna's −10 dB down bandwidth ranges from 2.7 to 16 GHz in simulation, and the corresponding measured bandwidth is from 2.1 to 16 GHz. It is clear from the above two plots that the measured and simulated bandwidths are almost similar with a slight shift in the lower cut off frequency. Further shifting in the resonance frequencies is observed in measured results due to fabrication errors and measurement intolerances. After analyzing the measured results of both the antennas, the FR4-based antenna has finally been selected for wearable applications, being more flexible and lightweight. Moreover, FR4 substrate is easily available in the market at a very low cost as compared to the Duroid substrate.
MNG metamaterial design
The designed UWB antenna in the section ‘UWB antenna design’ has no ground plane to protect the human body from harmful radiations. In this section we have designed and fabricated a simple structured flexible metamaterial which not only reduces the back radiations but also enhances the overall gain and radiation characteristics of the UWB antenna. The proposed metamaterial structure is also designed on same flexible FR4 substrate on which the basic UWB antenna was designed. The proposed unit cell structure consists of a 14 × 14 mm2 square patch loaded with a concentric ring having inner and outer radius of 6.6 mm and 7.1 mm, a plus shaped slot at the center and two rectangular U-shaped slots placed adjacent to the plus shaped slot. The top view of the proposed metamaterial unit cell along with the simulation model having perfect electric and magnetic boundary conditions is shown in Figs 6(a) and 6(b). All the optimized dimensions are in mm: L = 14.8, W = 14.8, G 1 = 0.5, G 2 = 0.42, L 1 = 12.45, W 1 = 1.24, a = 3.4, b = 3. It was observed that the square patch gave the first resonating frequency centered around 4.8 GHz and further slots were introduced to generate second resonating frequency centered around 9.6 GHz. The overall characterization of the metamaterial is divided into two steps. First, the simulation of the single unit cell is done to extract S-parameters. The second step is to extract the material properties (permittivity (ε r), permeability (μ r), refractive index (n), and input impedance (z)) from the obtained S-parameters using equations (1) and (2). Each slot on the unit cell plays a key role in giving specific behavior to the metamaterial unit cell. The S-parameters (magnitude in dB) and their corresponding phase (in degrees) are shown in Figs 7(a) and 7(b). It is observed from reflection coefficient curve (S 11), that the unit cell resonates at two different frequencies of 4.8 GHz and 9.6 GHz. Further from the transmission coefficient curve (S 21), it is observed that the proposed metamaterial behaves as a dual wide band EBG material by giving two wide stop bands from 5 to 9.2 GHz and 10.3 to 16 GHz with minimum transmission coefficient values of −49 dB at 7.87 GHz and −42 dB at 15 GHz. The corresponding phase reflection curves in degrees is shown in Fig. 7(b) where zero-degree phase reflection is observed at 7.87 GHz.
(a) Top view of proposed MNG metamaterial unit cell (b) Simulation model with perfect electric (PE) and perfect magnetic (PM) boundary conditions.

S parameters of the metamaterial unit cell (a) S-parameters (Magnitude in dB) (b) S-parameters (Phase in degrees).

The material properties (ε r, μ r, n, z) of the proposed metamaterial have been extracted from the S-parameters by using the following formulas [Reference Chen, Grzegorczyk, Wu, Pacheco and Kong21, Reference Smith, Vier, Koschny and Soukoulis22].
 $$\; \; \; z = \sqrt {\displaystyle{{{\lpar {1 + S_{11}} \rpar }^2-S_{21}^2} \over {{\lpar {1-S_{11}} \rpar }^2-S_{21}^2}}}, $$
 $$n = \displaystyle{1 \over {kd}}{\rm Co}{\rm s}^{-1}{\rm \;} \left[{\rm \;} \displaystyle{1 \over {2S_{21}}}{\rm \;} \left(1-S_{11}^2 + S_{21}^2 {\rm \;} \right)\right]{\rm \;,} $$
where, k and d are the wave vector and the thickness of the dielectric, respectively. The electric permittivity and magnetic permeability can be computed from the formulas of ε = n/z and μ = nz.
From Fig. 8(a) it is observed that the real part of the permeability (μ r) shows Lorentz response behavior and is found to be negative in the frequency range from 7.2 to 9.2 GHz. When Fig. 8(a) is zoomed between 7.2 and 9.2 GHz as shown in Fig. 8(b), it is observed that maximum negative permeability of −2121.6 is observed at 7.87 GHz which is exactly the same frequency where the transmission coefficient value was minimum with exactly zero-degree phase reflection as shown in Figs 7(a) and 7(b), respectively. The real part of the permittivity (ε r), refractive index (n), and input impedance (z) are all positive in the entire frequency range as observed from Fig. 8(c). Thus, on the basis of observed results the proposed metamaterial reflects the electromagnetic waves in the stop band of the transmission coefficient almost perfectly. Further in order to show the character of the resonance (which is already mentioned as a magnetic) and to understand the physical behavior of the metamaterial structure, the magnetic field distribution, and surface current distribution at three resonating frequencies (7.3, 7.87, and 8.6 GHz) from the stop band from 5 to 9.2 GHz are shown in Figs 9(a–c) and 10(a–c).
(a) Magnetic permeability of the unit cell (b) Material properties (ε r, z, n) of the proposed metamaterial unit cell (c) Real part of the magnetic permeability from 7.2 to 9.2 GHz.

Magnetic field distribution at three resonance frequencies (a) 7.3 GHz, (b) 7.87 GHz, and (c) 8.6 GHz.

At 7.3 GHz (frequency below magnetic resonance) it is observed that magnetic field is mainly concentrated in the center plus shaped slot and adjacent U-shaped slots. Further, at 7.87 GHz (magnetic resonance frequency) the magnetic field is strongest in the U and plus-shaped slots as compared to the other two frequencies as shown in Fig. 9(b). The same field pattern is also observed at 8.6 GHz (frequency above magnetic resonance), however, the concentration of magnetic field is weakest at this frequency. These observations validate the character of resonance as magnetic ones. It is observed that the magnetic resonance behavior is mainly achieved through the adjacent U shaped and center plus shaped slots which behave as capacitive elements and further these kinds of structures can be modeled as simple LC resonant circuit with the resonant frequency of ω = (LC)−1/2, where L and C are the total inductance and capacitance in the equivalent circuit model.
The surface current distribution of the proposed metamaterial at above three resonating frequencies is shown in Figs 10(a)–10(c). It is observed that at all three resonating frequencies the surface current is mostly concentrated at the surface of U and plus-shaped slots. As observed in Figs 10(b) and 10(c), the current concentration is found to be highest at 7.87 GHz and lowest at 8.6 GHz, moreover the induced currents are found to be circulating in a loop as observed in Figs 10(a)–10(c) which confirms the existence of magnetic resonance at these three frequencies.
Surface current distribution at three resonance frequencies (a) 7.3 GHz, (b) 7.87 GHz, and (c) 8.6 GHz.

The proposed metamaterial is quite easy to design, optimize, and fabricate as compared to some complex metamaterial structures discussed in literature such as complementary split ring resonators (CSRRs). We can further change the material properties easily by modifying various dimensions of the proposed unit cell. Therefore, a new and novel artificial magnetic material has been introduced and validated by simulations.
Integrated antenna design
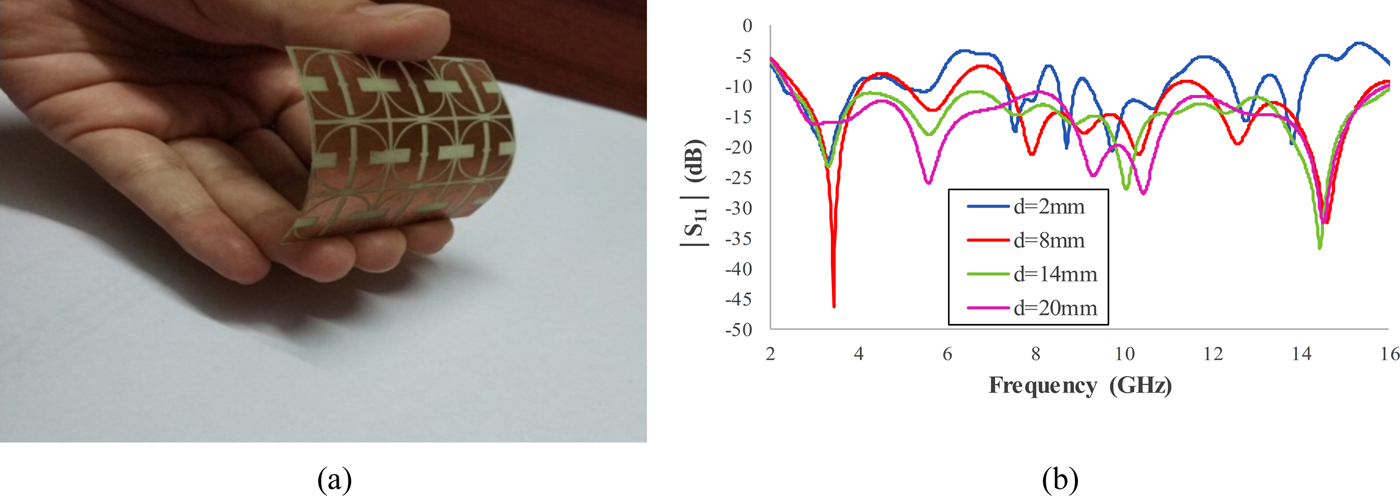
In this section, the final integrated antenna is designed by interconnecting the UWB antenna chosen in the section ‘UWB antenna design’ with the array of the metamaterial unit cell discussed in the section ‘MNG metamaterial design’. The optimum size of array is fixed as 3 × 3 elements as depicted in Fig. 11(a), as it properly covers the proposed UWB antenna and moreover overall size has been kept small so that it can be used for wearable applications. For an optimal operation of the metamaterial antenna, we cannot place an antenna directly on the metamaterial plane. Hence, a certain distance or air gap “d” must be maintained between the two elements and practically it is done by using a foam substrate. The effect of variation in the air gap “d” from 2 to 20 mm on the reflection coefficient of the integrated antenna (antenna with metamaterial) is shown in Fig. 11(b). It is observed that at the air gap of 2 mm the integrated antenna does not cover the entire UWB range. As we increase the value of “d”, the bandwidth keeps on increasing and at d = 14 mm it covered the entire UWB range from 2.3 GHz to 16 GHz. Beyond 14 mm, the obtained bandwidth remains almost the same. Thus, taking the value of “d” beyond 14 mm only increases the size and bulkiness of an integrated antenna. Similarly, it is observed that as we keep the metamaterial plane closer to the UWB antenna the impedance matching gets disturbed and as we move the metamaterial plane farther from the designed antenna, the impedance matching gets improved. Finally, it is observed that the 3 × 3 array of MNG metamaterial structure at 14 mm of air gap gave the optimum results. The fabricated integrated antenna with 14 mm of air gap (foam) is shown in Fig. 12(a).
(a) A 3 × 3 array of the fabricated MNG metamaterial (b) Effect of varying air gap “d” between the antenna and the metamaterial layer on S 11 of an integrated antenna.
(a) Fabricated integrated antenna with 14 mm of air gap (b) S 11 plot of proposed UWB antenna with/without metamaterial.

Figure 12(b) shows the simulated S 11 curves of both UWB and integrated antenna along with the measured S 11 curve of integrated antenna. The integrated antenna covers 2.3 to 16 GHz of frequency band with good impedance matching (below −15 dB) at four resonating frequencies (3.4, 5.7, 10.2, 14.5 GHz). However, in the measured curve the bandwidth increases in the lower cut off frequency along with shifting in the return loss values across the entire operational frequency band due to fabrication, alignment, and measurement errors. Figure 13 shows the simulated gain plots of both UWB and integrated antenna along with measured gain plot of the integrated antenna. Table 2 shows the gain values obtained at four resonating frequencies for both UWB and integrated antenna. It is observed that with the introduction of metamaterial the gain values have increased at all the four resonating frequencies. At three of the resonance frequencies i.e. 3.4, 10.2, and 14.5 GHz the increment in gain value is above 2 dB, whereas at 5.7 GHz, the gain value is increased by 1.8 dB. Further the simulated and measured gain curves of integrated antenna are quite similar with slight variations.
Gain plot of the proposed UWB antenna with/without metamaterial.

Gain values for UWB and integrated antenna

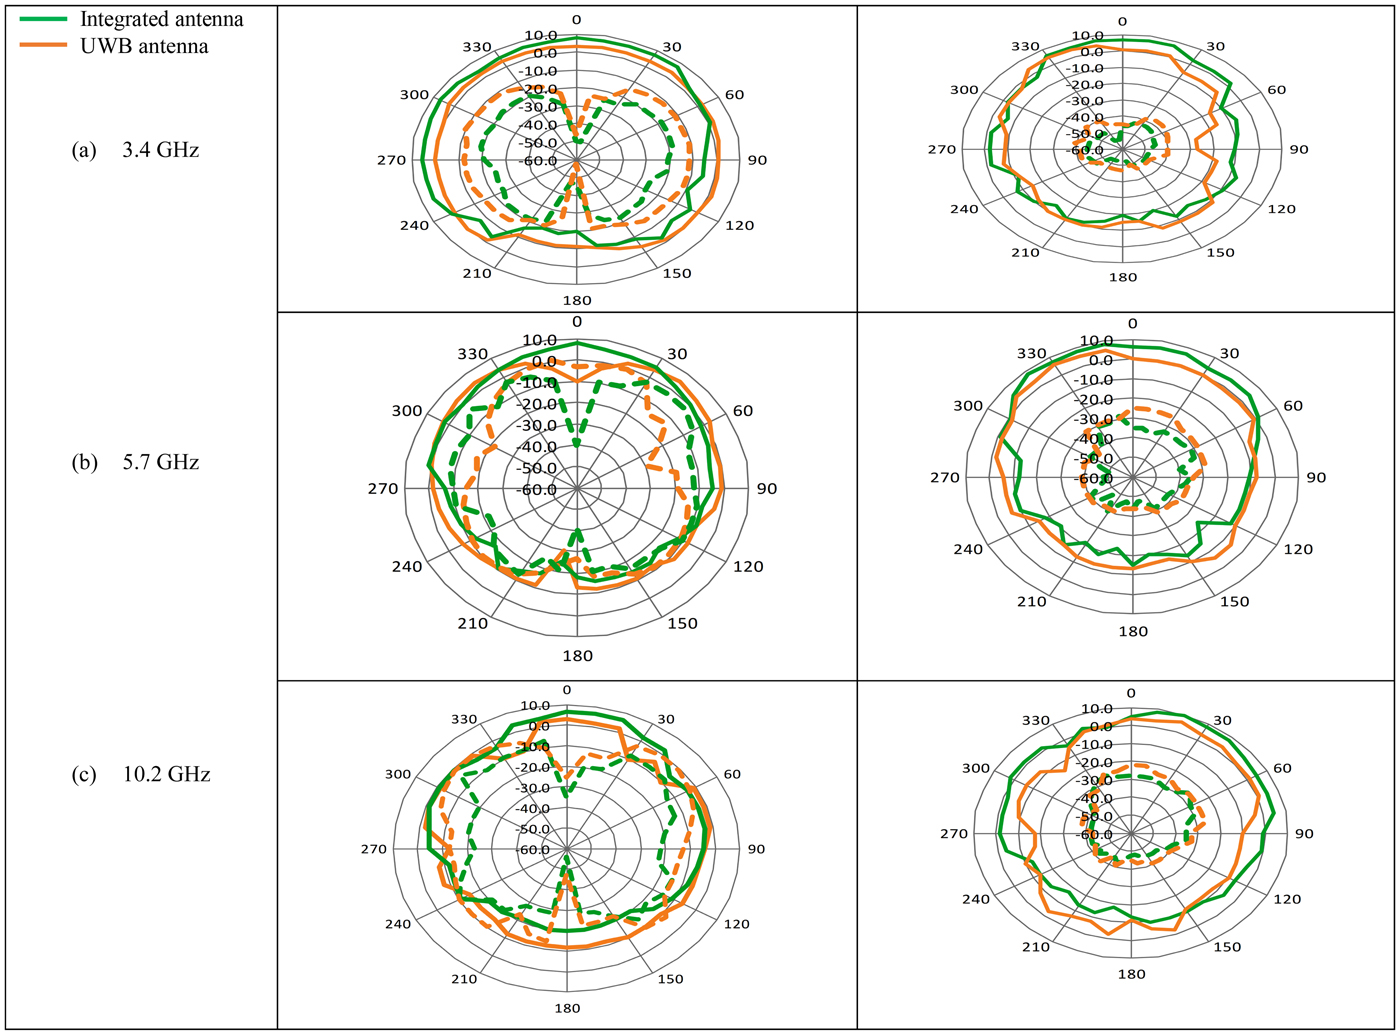
In Fig. 14 the measured and normalized radiation patterns of both UWB and integrated antenna are shown at three chosen resonating frequencies i.e. 3.4, 5.7, and 10.2 GHz. It is observed that in integrated antenna the radiation increases in the forward direction with reduced back lobes, however at higher frequencies multiple peaks or side lobes are also observed, because of radiations due to higher order modes. It is observed that in case of integrated antenna in E plane the main lobe magnitude has increased from 2.66 to 7 dBi, 1.5 to 5 dBi, and 1.06 to 5.2 dBi at 3.4, 5.7, and 10.2 GHz and similarly in H plane of integrated antenna the main lobe magnitude increased from 3.94 to 7.2 dBi, 3.1 to 6.5 dBi, and 2.9 to 7.46 dBi at 3.4, 5.7, and 10.2 GHz.
Measured and normalized 2-D radiation pattern of the proposed UWB and Integrated antenna at (a) 3.4 GHz, (b) 5.7 GHz, and (c) 10.2 GHz.

To investigate the performance of designed UWB and integrated antennas for wearable applications, we have studied their performance over the curved surface to check bending effects, above the flat and cylindrical human phantoms to study SAR and on the thin metallic sheet to study antenna on helmets, car roof or airplane body, etc.
Study of UWB and integrated wearable antennas
Effect of bending
In simulation, both UWB and integrated antennas are bent over the cylindrical surface to study their bending effect, but practical bending measurements are accomplished using integrated antenna only. The designed antennas are bent over a cylinder of 10 mm radius and the bending angle is varied from 30°–180° to see its effect on antenna's reflection coefficient curve. Figures 15(a) and 15(b) show the bending scenarios of two antennas at bending angle of 60°. Figures 16(a) and 16(b) show the effect of bending on S 11 plots of both the antennas. In Fig. 16(a) a consistent shift in resonance frequencies towards lower frequency range is observed at all the bending angles, whereas in Fig. 16(b) there is no shift in the resonance frequencies. Further, in both the plots slight variations in the values of reflection coefficient are observed in the entire UWB range.
Antenna bending scenarios at 60° bending angle (a) UWB antenna (b) Integrated antenna with 14 mm air gap.

Effect of bending on the |S11| plot of (a) UWB antenna, (b) Integrated antenna.
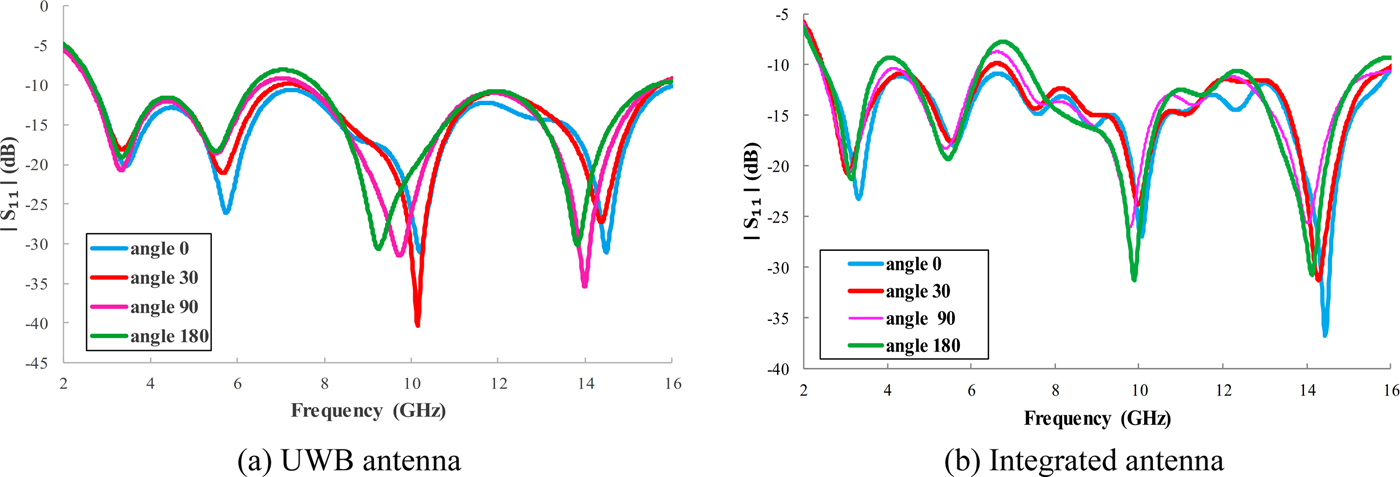
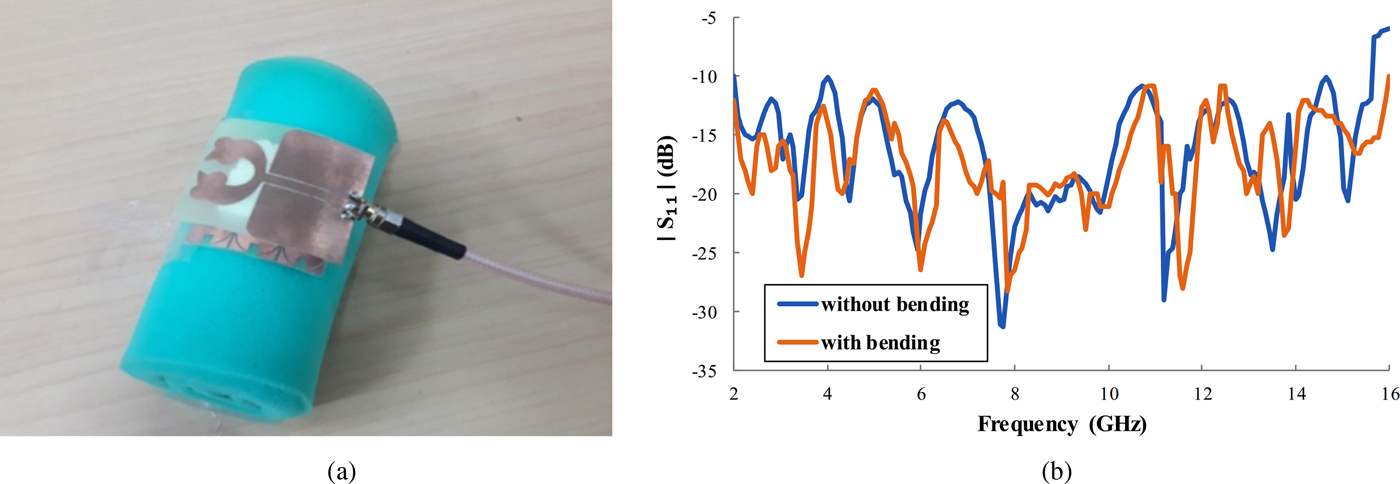
Figure 17(a) shows the experimental setup used for bending measurements, where the integrated antenna is conformed over the cylindrical foam. Figure 17(b) shows the measured reflection coefficient curves of the integrated antenna with/without bending. It is observed that measured S 11 curve is quite similar to the simulated ones with slight frequency shifting at higher resonance frequencies due to fabrication errors.
(a) Integrated antenna conformed over cylindrical foam (b) Measured reflection coefficient of integrated antenna with/without bending.
Effect of human body
The human body is a multi-layered medium made up of different organs, such as muscles, bones, blood, cells, skin, stomach, and so forth. Each layer has its own thickness and frequency dependent dielectric characteristics. Based on the works of Italian National Research Council the electrical properties of the tissues at three different resonance frequencies i.e. 3, 5, and 10 GHz are given in Table 3, which are easily available online [Reference Mersani, Lotfi and Ribero23]. To show the effect of human body on the proposed antenna parameters, an inhomogeneous three-layered body model containing skin, fat, and muscle is simulated in computer simulation technology microwave studio (CST MWS) version 16.0. The antenna characteristics are studied in the presence of both cylindrical and flat three-layered model having an average thickness of 2, 5, and 10 mm for the skin, fat, and muscle, respectively. Figures 18(a) and 18(b) shows the UWB antenna over flat and cylindrical human body phantom model at 2 mm of distance.
Electrical properties of human layers at three resonance frequencies [Reference Mersani, Lotfi and Ribero23]

Proposed UWB antenna over inhomogeneous three-layered tissue models.

In this section the distance “h” between the antenna and the human phantom is varied over both the flat and cylindrical phantoms to see their corresponding effect on antenna's reflection coefficient. The three chosen distances are 2, 5, and 10 mm for evaluation purpose. From Fig. 19(a) it is observed that the return loss increases in lower frequency range below 8 GHz, whereas only slight variations in return loss are observed above 8 GHz when UWB antenna is placed over the human phantoms. Similar trend in S 11 curve is also seen for integrated antenna in Fig. 19(b), however, the level of increment in return loss values is comparatively smaller. Further, it is observed that both the antennas over flat phantom gave lower return loss values with better impedance matching in the entire UWB range as compared to cylindrical phantom. Therefore, further analysis is done using only a three-layered flat phantom. Figures 20(a) and 20(b) show the experimental setup for reflection coefficient measurement of integrated antenna placed over human body. Figure 21 shows the measured S 11 curve of the integrated antenna with/without human body. It is observed that the measured reflection coefficient curve is almost similar to the simulated ones till 6 GHz, however above 6 GHz, the resonance frequencies shifts to the higher frequency band. Table 4 shows the effect on the various antenna parameters like gain and radiation efficiency when the two antennas are placed in free space and over the flat human phantom at three different distances.
Effect on |S11| plot when both antennas are placed over flat and cylindrical phantom (a) UWB antenna (b) Integrated antenna.

Experimental setup for reflection coefficient measurement on the human body.

Measured S 11 curve of the integrated antenna with/without human body.

Maximum Gain and Radiation Efficiency (η) achieved by UWB and integrated antenna when kept in free space and at three distances from the flat three-layered phantom model

Table 4 clearly illustrates that the maximum gain and radiation efficiency of the proposed UWB antenna gets greatly affected when kept in the close vicinity of human body. When we keep the UWB antenna at the distance of 2 mm from phantom, drop in gain and radiation efficiency by 2.32 dB and 68% is observed. Further, it is observed that to achieve the optimum value of both gain and radiation efficiency we have to keep the UWB antenna at a distance of 10 mm from the human body. In case of integrated antenna, the presence of the human body even at the closest distance (2 mm) has very small effect on the antenna parameters. Although, in integrated antenna the overall gain and radiation efficiency values obtained with phantom changes slightly in the entire operating range from 2.3 to 16 GHz but still quite high value of maximum gain and radiation efficiency is maintained even in the vicinity of the human body as compared to free space.
Figure 22 presents the measured 2-D radiation pattern showing the co- and cross-polarization of the UWB and integrated antenna in the E and H plane at 2 mm distance from the human flat phantom model at all the three resonating frequencies. Table 5 shows the amplitudes of co- and cross-polarization obtained in the E and H plane of the UWB and integrated antenna. When the UWB antenna was placed over the MNG metamaterial, the level or amplitude of co-polarization increases and cross-polarization decreases with no change in the main lobe direction in both the planes. Further, the level of increment and decrement in co- and cross-polarization amplitudes is found to be higher in E plane (Table 5) as compared to the H plane. The highest value of co polarization i.e. 9.8 dBi is found at 10.2 GHz in H plane of the integrated antenna and lowest value of cross-polarization i.e. −42.8 dBi is observed at 3.4 GHz in H plane of the integrated antenna. Further, as the main lobe magnitude has increased in the forward direction in integrated antenna, therefore we can say that the integrated antenna helped to reduce the level of back and side lobes in the antenna radiation pattern.
Measured and normalized radiation pattern (Co-polarization (solid line) and Cross-polarization (dotted line)) of the proposed UWB and Integrated antenna at (a) 3.4 GHz, (b) 5.7 GHz, and (c) 10.2 GHz.

Amplitudes of co and cross polarization obtained in the E and H plane of the UWB and Integrated antenna at three different frequencies

Effect of thin metallic surface
Like human body, the metallic surfaces are also known to change the resonance frequency, input impedance and radiation pattern of antenna when kept in close proximity with the designed antenna. Therefore, in this section, the performance of the proposed UWB and integrated antenna is analyzed over the thin sheet of PEC material at various distances from 2 mm to 16 mm. Figure 22 shows the effect of variation of “x” i.e. the gap between the PEC surface and the designed antenna, on the reflection coefficient curve of both the antennas. In Fig. 23(a), at x = 2 mm, the antenna performance gets deteriorated in the UWB band. However, as we increase the value of “x”, the antenna performance starts improving and at x = 14 mm it gave satisfactory performance by covering the entire UWB range from 2 to 16 GHz. In case of integrated antenna as shown in Fig. 23(b), even at the closest distance of 2 mm, it gave satisfactory result by maintaining good impedance matching (S 11<−10 dB) in the entire UWB band. Therefore, we can say that the metamaterial surface helped the proposed UWB antenna to maintain its S 11 curve below −10 dB even in the vicinity of a PEC metallic plate. Figure 24 shows the experimental setup for the proposed integrated antenna over the metallic surface. Figure 25 shows the measured reflection coefficient curves of the integrated antenna with and without the PEC surface. It has been experimentally observed that there is slight frequency shifting in lower frequency band with small variation in S 11 values in the entire UWB range.
Effect of thin sheet of PEC surface on both the antennas |S11| curve.

Measurement setup for the integrated antenna over metallic surface.

Measured |S11| curves of the integrated antenna with/without the PEC surface.

Table 6 shows the comparison of the various parameters of the proposed integrated antenna with some latest papers published for the wearable applications. It is observed that most of the papers have small impedance bandwidth except [Reference Poffelie, Yan and Vandenbosch8]. The proposed integrated antenna has an optimum size of 50 × 44.4 mm2, largest operating bandwidth of 13.7 GHz and gain of 8 dB. Further, the radiation efficiency is not considered in most of the papers except [Reference Al-Sehemi, Al-Ghamdi, Dishovsky, Atanasov and Atanasova7, Reference Abbasi, Nikolaou and Antoniades14, Reference Mersani, Lotfi and Ribero23, Reference Al-Sehemi, Al-Ghamdi, Dishousky, Atanasov and Atanasova24], whereas the proposed antenna gave comparatively highest radiation efficiency of 85%. Therefore, we can say that the designed antenna gave optimum and quite satisfactory results and can be considered as a good candidate for wearable applications.
Comparison of the proposed integrated antenna parameters with several existing designs

SAR analysis
SAR analysis when antennas (UWB and integrated) are moved away from human phantoms
The impact of the proposed UWB and integrated antenna on human tissue, described by the SAR, was also examined. SAR value depends on the geometry of the human tissue, antenna positioning, dielectric properties of tissue, transmitted input power, and spacing between the antenna and the human tissue. Therefore, initially, the SAR analysis is done with 0.3 W of input power using both cylindrical and flat phantoms for the two antennas at three distances of 2, 5, and 10 mm and at the frequencies of 3, 5, and 10 GHz. Based on the observations, further SAR analysis is done with 0.1 W of input power using only flat phantom. The basic formula of SAR is given in equation (3).
 $${\rm SAR} \; \lpar {{\rm W/kg}} \rpar = \displaystyle{{\sigma \times E^2} \over \rho}, $$
where σ is the conductivity of tissue (S/m), E is the root mean square value of the electric field (V/m) induced in the tissue and ρ is the tissue density (kg/m2). The American standard for SAR analysis is used i.e. the SAR value averaged over 1 g of tissue should be <1.6 W/kg. Table 7 gives the value of SAR for UWB and integrated antenna in the presence of flat and cylindrical phantom. In this analysis, input power of 0.3 W and averaging method as per IEEEC 95.3 standard is used. From Table 7 it is clear that in both the cylindrical and flat phantom, the SAR values are greatly reduced by introducing the metamaterial structure. However, the flat phantom SAR values are slightly smaller than the cylindrical ones. Further, it is also investigated that flat phantoms are mostly preferred for SAR analysis because they have simple structure and require comparatively lesser memory capacity and time period for simulation. Flat phantoms also provide maximal contact surface area with the device under test and therefore generally provide a conservative estimation of SAR [25]. It is observed that in case of UWB antenna, the SAR values greatly reduce with the increasing distance using both flat and cylindrical phantoms. In case of flat phantom, the SAR value is reduced from the maximum value of 25.15 W/kg (h = 2 mm) to a minimum value of 3.803 W/kg (h = 10 mm). Similarly, in case of cylindrical phantom SAR is reduced from maximum value of 26.29 W/kg (h = 2 mm) to a minimum value of 4.262 W/kg (h = 10 mm). However, in the case of integrated antenna, the difference between maximum and minimum SAR values is small as compared to the UWB antenna. In case of a flat phantom, SAR values varies from maximum value of 4.516 W/kg (h = 2 mm) to a minimum value of 0.4916 W/kg (h = 10 mm) and in the case of a cylindrical it varied from maximum value of 5.743 W/kg (h = 2 mm) to a minimum value of 0.677 W/kg (h = 10 mm). Therefore, we can say that the SAR values in integrated antenna do not depend much on the spacing between the antenna and the human phantom. We also observed that the SAR values obtained in the case of integrated antenna as depicted in Table 7 are still slightly higher than the 1.6 W/kg. Therefore, to reduce its value further we reduced the total input power to 0.1 W or 100 mW, everything else is kept same except that we used only flat phantom as it gave slightly better SAR values than cylindrical one.
Peak SAR values obtained with UWB and integrated antenna using both flat and cylindrical phantom when input power is 0.3 W

Table 8 clearly depicts that the SAR values are greatly reduced as we decrease the input power from 0.3W to 100 mW. The trend in SAR values is again repeated in Table 8 as was observed in Table 7. In the case of integrated antenna, the SAR values obtained at three different distances and frequencies vary slightly from maximum value of 1.505 W/kg (h = 2 mm) to the minimum value of 0.1039 W/kg (h = 10 mm). Further, the SAR values observed with integrated antenna are always below 1.6 W/kg over 1 g of the body tissue at all the three distances and frequencies, which was the desirable result.
Peak SAR values obtained with UWB and integrated antenna using flat phantom when input power is 100 mW

Variation of SAR values with phantom depth
Figure 26 demonstrates the simulation setup used for SAR analysis at three different frequencies i.e. 3, 5, and 10 GHz. The integrated antenna is placed at three different values of “h” (2, 5, and 10 mm) from the flat human phantom with input power fixed as 100 mW. The depth of phantom i.e. “z” is varied in the range from the surface of the skin (z = 0 mm) to the bottom of the muscle tissue (z = 17 mm). In all the three plots as shown in Figs 27(a)–27(c), initially the SAR value increases in skin with depth upto 2 mm, then it becomes constant in fat tissue up to 10 mm. After that in muscle the SAR suddenly drops till 12 mm and then gradually decreases to the lowest value. A similar SAR variation is observed in all the three experiments for fixed values of “h” and frequencies. Further, it is also noticed that the SAR increases as we increase the frequency and decreases with increasing distance between the antenna and the phantom. From Fig. 27(a) the highest value of SAR i.e. 1.36 W/kg is observed in skin at 10 GHz, whereas the lowest value of SAR i.e. 0.08 W/kg is observed in muscle tissue at 3 GHz at a distance of h = 2 mm. Similarly, in Figs 27(b) and 27(c) highest value of SAR is observed in skin i.e. 1.1 W/kg and 1 W/kg at 10 GHz and lowest SAR value of 0.03 W/kg and 0.01 W/kg is observed in muscle tissue at 3 GHz at a distance of h = 5 mm and 10 mm, respectively. Hence the integrated antenna reduces the SAR below 1.6 W/kg in all the tissues as observed in three plots of Figs 27(a)–27(c).
Simulation setup used for SAR analysis.

Graph between the SAR values and the depth of phantom at three different values of “h” (a) 2 mm, (b) 5 mm, and (c) 10 mm.

Conclusion
In this paper, a novel and flexible CPW fed UWB antenna with MNG metamaterial is designed, fabricated, and tested experimentally for wearable applications. The (3 × 3) array of MNG metasurface behaving as an EBG structure is used as a ground plane, which improves the overall gain, forward radiation pattern, and also provides proper isolation between the designed antenna and the human body. The final flexible integrated antenna exhibits optimum size of 50 mm × 44.4 mm with maximum gain and radiation efficiency of 8 dB and 85%, respectively over flat human phantom. It is also observed that the final integrated antenna results did not deteriorate much even at different bending angles and when placed over the human phantoms or the metallic surface. Further, the SAR achieved in the final integrated design is always below the maximum permissible limit. The results obtained are better as compared to recently reported papers listed in Table 6. Therefore, it can be considered as a powerful candidate for wearable applications.
 Deepa Negi received her B. Tech (Honors) degree in ECE from Himachal Pradesh University, M. Tech degree in ECE from Jaypee University of Information Technology, Solan in 2016. Currently, she is pursuing her Ph.D. degree from Thapar Institute of Engineering and Technology, Patiala. Her main research interests include millimeter wave technology, Ultra-wide band antennas, Band notched antennas, Meta-materials, and Wearable antennas.
 Rajesh Khanna received a B.Sc. (Engg.) degree in ECE in 1988 from REC, Kurukshetra and M.E. degree in 1998 from IISc., Bangalore. He was with Hartron R&D center till 1993. Until 1999, he was in AIR as Assistant Station Engineer. Presently, he is working as Professor in the ECED at Thapar Institute of Engineering and Technology, Patiala. He has published 80 papers in National and International journal/Conferences. He has worth Rs 1.5 crore projects to his credit. His main research interest includes antennas, Wireless Communication, MIMO systems.
 Jaswinder Kaur received her B tech and MTech degrees in ECE from Punjab Technical University, Jalandhar, in 2005 and 2009, respectively. She received her Ph.D. degree from Thapar University in 2014. Presently, she is working as an Assistant Professor in the ECED at Thapar Institute of Engineering and Technology, Patiala. She has published 26 papers in various peer reviewed journals/conferences of national and international repute. Her research interests include the analysis and design of microstrip antennas for wireless communication, 5 G MIMO antenna, CSRRs, micro-wave integrated circuits (MICs), and microwave & RF design.