

Dietary patterns are increasingly being recognised as having an important role in the maintenance of bone health. For example, diets rich in Ca have been found to reduce bone loss(Reference MacInnis, Cassar and Nowson1) and reduce fracture(Reference Kalkwarf, Khoury and Lanphear2). It has been proposed that the body's acid–base environment has an impact on bone health and is also modifiable by diet(Reference Sebastian, Frassetto and Sellmeyer3–Reference Wynn, Lanham-New and Krieg5) where a higher dietary acid load contributes to bone loss. In industrialised countries diets tend to be high in carbohydrates and low in fruit and vegetables, and this, coupled with higher intakes of protein from animal sources, results in a high dietary acid load, which is proposed to contribute to a decrease in blood pH via the increased production of hydrogen ions(Reference Sebastian, Frassetto and Sellmeyer3). It has been estimated that for a pre-agricultural diet consisting of 35 % meat and 65 % plant foods, the net endogenous acid production (NEAP) yields a negative NEAP value. This is in contrast to our current Western diet with a positive NEAP value. The shift from negative to positive NEAP is accounted for by the displacement of high-bicarbonate-yielding plant foods in the ancestral diet by cereal grains resulting in a net acid-producing diet(Reference Sebastian, Frassetto and Sellmeyer3). While the body possesses multiple mechanisms for maintaining a suitable acid–base environment, it has been suggested that prolonged acidosis contributes to a decrease in bone density via the activation of osteoclastic Ca mobilisation and an associated inhibition of bone mineralisation.
Several cross-sectional studies in older adults have examined the effect of a diet high in fruit and vegetables on bone mineral density (BMD)(Reference Macdonald, New and Fraser6–Reference Tucker, Hannan and Chen8), and the results indicate that dietary patterns high in fruits and vegetables, which are rich sources of K, have a beneficial effect on BMD. A recent review highlights that any beneficial effect on K on bone may relate to the accompanying anion: fruits and vegetables are rich in bicarbonate precursors (for example, citrate), whereas milk, meat and cereal products contain fewer bicarbonate precursors(Reference Rafferty, Davies and Heaney9). In contrast, a higher intake of Na, another feature of modern diets, has been shown to increase Ca excretion and has been associated with lower BMD(Reference Carbone, Bush and Barrow10–Reference Nordin, Need and Morris11). In one study, over 2 years urinary Na excretion was a significant determinant of bone loss at the hip and ankle sites in postmenopausal women(Reference Devine, Criddle and Dick12). In another study a low-Na Dietary Approaches to Stop Hypertension (DASH)-type diet (high in Ca and fruits and vegetables) was found to affect bone turnover by decreasing bone formation by 8–11 %, and while resorption was further reduced by 16–18 %, the authors interpret this as a net beneficial effect on BMD(Reference Lin, Ginty and Appel13). In older adults, adequate dietary protein also contributes to the maintenance of bone health(Reference Hannan, Tucker and Dawson-Hughes14), although it is unclear whether the source of the protein (animal or vegetable) is a major factor in determining the effect. Paradoxically, a higher animal to vegetable protein dietary composition has been reported to both increase the risk of hip fracture in postmenopausal women(Reference Sellmeyer, Stone and Sebastian15), and decrease the risk of fracture in a similarly matched group of subjects(Reference Munger, Cerhan and Chiu16).
The present study aimed to compare the effects on blood pressure (BP) and bone turnover of a low-Na base-producing (LNAB) diet (based on the low-Na DASH diet), which included a serving of red meat on most days, compared with a high-carbohydrate low-fat (HCLF) diet, with a higher acid load. Both diets were designed to provide adequate dietary Ca and to be significantly different in dietary acid load, which was primarily achieved by a greater intake of breads and cereals in the HCLF diet. The LNAB diet was more representative of our ancestral diet and the HCLF diet was representative of a low-fat dietary pattern that restricts red meat, that many individuals attempt to follow to reduce the risk of CVD. The diets were designed to maintain body weight and energy intake. The results of these two diets on BP are reported elsewhere(Reference Nowson, Wattanapenpaiboon and Patchett17).
Subjects and methods
Study subjects and study design
Subjects were recruited from the general community for this randomised, controlled parallel-design dietary intervention study. Women were eligible if they were experiencing menopausal symptoms or had passed through menopause and were not taking any hormone replacement therapy, had a BMI between 18 and 35 kg/m2, and, before randomisation, had a seated office systolic BP ≥ 120 and < 160 mmHg or diastolic BP ≥ 80 and < 95 mmHg at their screening visit, or had a home systolic BP ≥ 116 mmHg or diastolic BP ≥ 78 mmHg (average of 7 d), or were classified as having prehypertension or stage 1 hypertension(Reference Chobanian, Bakris and Black18). The BP criteria were designed to exclude those with low or normal BP. Subjects who were taking anti-hypertensive medication were included, provided they were willing to maintain their current therapy and dose. Subjects were excluded if they had experienced the menopause before they turned 43 years old, were taking Warfarin, Dilantin or medications for osteoporosis treatment such as bisphophonates, Fosamax, had been treated for cancer within the previous 3 years, had a cardiovascular event in the past 6 months, had insulin-dependent diabetes, consumed more than thirty standard alcoholic drinks/week or ate main meals outside the home more than twice per week. All subjects provided written informed consent before starting the study, which was approved by the Deakin University Human Research Ethics Committee.
Randomisation was stratified by BMI and anti-hypertensive use. Eligible subjects were randomly assigned to follow either the LNAB or HCLF diet for 14 weeks, during which they were seen five times, at weeks 2, 4, 8, 12 and 14. Phone follow-up was made at weeks 6 and 10. The LNAB diet was designed to have a low dietary acid load and the HCLF to have a high dietary acid load (Table 1), with a difference between diets of 19 mEq/d potential renal acid load (PRAL)(Reference Remer and Manz19) or 12 mEq/d NEAP(Reference Frassetto, Lanham-New and Macdonald20). The LNAB diet was based on the low-Na DASH diet and was rich in fruit and vegetables, lower in Na and higher in K, Mg and lean red meat compared with the HCLF diet. Both the LNAB and HCLF diets were designed to include at least 1000 mg dietary Ca, but differed in the amount of lean red meat, fruit and vegetables, breads and cereals, and dietary Na (Table 1). Subjects in both diet groups were advised to use either poly- or monounsaturated margarines and cooking oil and the amount recommended was adjusted to meet energy requirements.
Dietary recommendations for 14-week intervention study
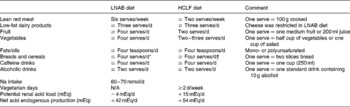
LNAB, low-Na base-producing; HCLF, high-carbohydrate low-fat; N/A, not applicable.
* Wholegrain.
† Choice of wholegrain or white.
Each week, LNAB subjects received 810 g raw lean red meat (either beef, lamb, veal or combination) in 135 g serving sizes (reduced to about 100 g when cooked), low-Na multigrain bread (75 mg Na/100 g), no-added-salt baked beans (20 mg Na/100 g), salt-free margarine and low-Na stock powder (approximately 50 mg Na/100 g). HCLF subjects received regular-salt margarine and regular-salt baked beans as required. They were also provided with canned tuna as an incentive. Dietary counselling was provided by trained dietitians. To ensure that both groups had adequate Ca intake, subjects were encouraged to consume at least three serves of low-fat milk and dairy products daily, but the LNAB subjects were asked to restrict their cheese consumption due to its high Na content. LNAB subjects were also asked to consume wholegrain breads and unprocessed cereals but limit the consumption of breads and cereals to a maximum of four serves/d, while HCLF subjects were asked to consume at least four serves bread and cereals daily and they were encouraged to use wholegrain breads and unprocessed cereals.
Dietary assessment
Dietary adherence or compliance of subjects was assessed using measurements of 24 h urinary electrolyte excretion and the numbers of servings of six key food group components, namely red meat, milk and other dairy products, bread and cereals (wholegrain), fruit, vegetables, and fats and oils (Table 1). Subjects were asked to record their consumption of these key food group components in their food group diaries over a period of three consecutive days each week. Average daily numbers of servings of each key food group were then calculated for each 2-week period.
Each fortnight subjects also completed a 24 h food record on the day before their visit. The average of two food records before randomisation was used as the baseline values, and the average of seven records kept during the intervention period was used for the intervention values. Data from the food records were analysed using Foodworks Professional Edition (version 4; Xyris Software, Brisbane, Qld, Australia). The actual red meat intake was estimated from these food records. PRAL and NEAP were calculated from the following equations(Reference Remer and Manz19–Reference Remer, Dimitriou and Manz21):
Assessments of body composition, physical activity and biochemical parameters
Height was measured to the nearest centimetre using a free-standing stadiometer and body weight measured at each visit on a digital scale with subjects wearing light clothing and no shoes. Waist and hip circumferences were measured to the nearest centimetre. Total body fat mass was measured by dual-energy X-ray absorptiometry (DPX-L; Lunar, Madison, WI, USA) at baseline and at the end of the study at week 14.
At least two 24 h urine collections were obtained at baseline and four during the intervention period at weeks 4, 8, 12 and 14. Spot urine pH was measured at each visit on a freshly voided sample, and urinary electrolytes and creatinine were measured on 24 h urine collection using a Randox Daytona automated clinical chemistry Analyser (Antrim, UK, 2002). Blood samples were collected after subjects had fasted for at least 10 h, once at baseline and three times during the intervention period at weeks 8, 12 and 14. Serum samples were stored at − 80°C until analysis of 25-hydroxyvitamin D, parathyroid hormone and bone turnover markers.
Measurements were performed in duplicate on serum samples collected at baseline and week 14 for serum 25-hydroxyvitamin D and intact parathyroid hormone by RIA (DiaSorin Inc., Stillwater, MN, USA), and bone turnover- markers. Serum osteocalcin and C-terminal telopeptide of type I collagen (CTX) were measured by ELISA (Nordic Bioscience Diagnostics, Herlev, Denmark), and intact N-terminal propeptide of type 1 procollagen (PINP) was measured by RIA (Orion Diagnostica, Espoo, Finland). One additional assay was performed on samples collected at week 8 for PINP and CTX. Replicates had a CV of less than 15 %. Intra-assay CV for bone turnover markers were less than 10 % (osteocalcin 3·9 %, PINP 9·4 %, CTX 7·0 %) and inter-assay CV were less than 8 % (osteocalcin 4·6 %, PINP 7·1 %, CTX 7·0 %).
Statistical analysis
Data analyses were performed using SPSS for Windows (version 14.0, 2006; SPSS Inc., Chicago, IL, USA). Values presented are mean values with their standard errors. A simple t test was used to assess differences between diet groups, and changes in parameters over the study period were evaluated by paired t test. A repeated-measures one-way ANOVA test was performed on serum PINP and CTX at baseline, week 8 and week 14 to assess their changes over time. A Shapiro–Wilk test was performed on the main outcome variables to determine whether or not the data were normally distributed. Log transformation was performed on serum osteocalcin, PINP, CTX, and the urinary excretion of Na, K and Ca as they were not normally distributed before the comparisons were made between diet groups; however, the geometric means were presented. A χ2 test was performed to evaluate the differences in proportions of subjects between the two diet groups. The Pearson correlation coefficient (r) was used to determine the relationship between two variables. The level of significance was set at 0·05.
Based on results from Lin et al. (Reference Lin, Ginty and Appel13), forty-eight subjects in each group would have been sufficient to demonstrate an 18 % difference in serum osteocalcin between the two diet groups after 3 months with a significance level of 5 %.
Results
Of the 246 women who attended a screening visit, 111 were eligible and were randomised into the dietary intervention (fifty-three LNAB, fifty-eight HCLF). Sixteen women dropped out of the study: four due to illness (one LNAB, three HCLF) and twelve (six LNAB, six HCLF) were unable to commit to the diet for the study length, leaving ninety-five subjects completing the dietary intervention (forty-six LNAB, forty-nine HCLF). About 37 % of these subjects (seventeen LNAB, eighteen HCLF) were receiving either single or combination anti-hypertensive therapy.
Baseline characteristics
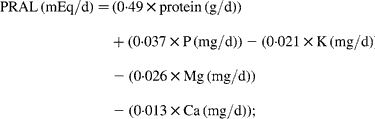
At baseline, subjects in the two diet groups were similar in regard to their age and body composition measurements. Of the ninety-five subjects, ninety (95 %) were postmenopausal for at least 1 year. The two diet groups were matched for menopausal stage (Table 2). The mean number of years past menopause was 9·4 (sem 0·9) for the LNAB group and 9·3 (sem 0·9) for the HCLF group. The HCLF group had higher intakes of total energy, protein, fat and carbohydrate; however, no significant differences between groups were observed in percentage energy derived from these macronutrients (Table 2). They were also significantly different in terms of the daily intakes of fibre, Mg and P. No significant differences were observed between diet groups for any other parameters.
(Mean values with their standard errors)
LNAB, low-Na base-producing; HCLF, high-carbohydrate low-fat; PINP, procollagen type I N-terminal propeptide; CTX, C-terminal telopeptide of type I collagen; 25(OH)D, 25-hydroxyvitamin D; PTH, intact parathyroid hormone.
* χ2 test.
† Log transformation was performed on non-normally distributed data before the comparison between groups was made.
Dietary intervention
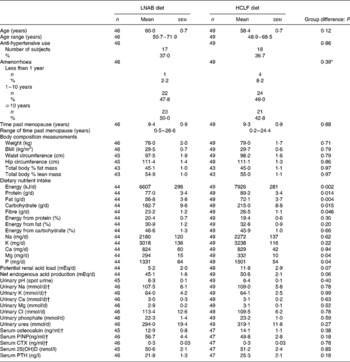
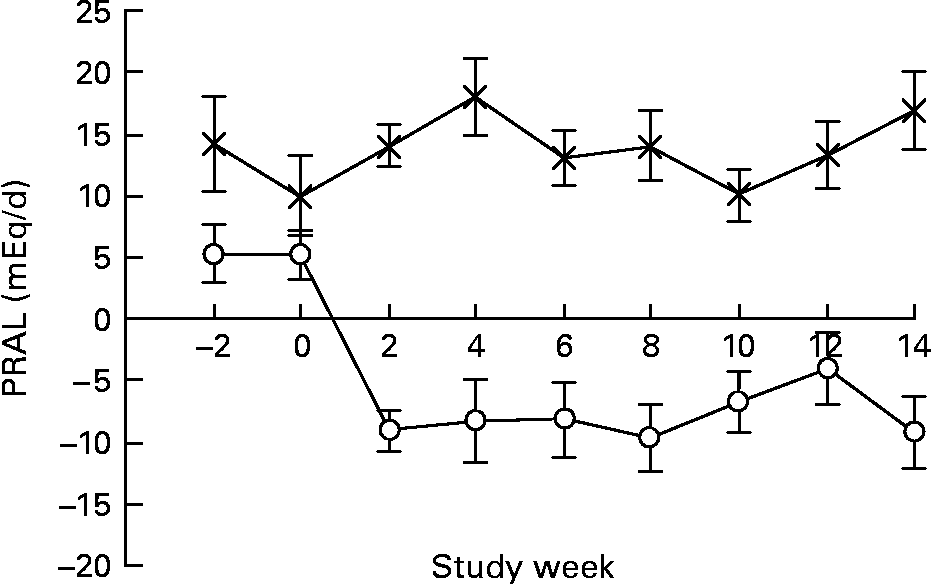
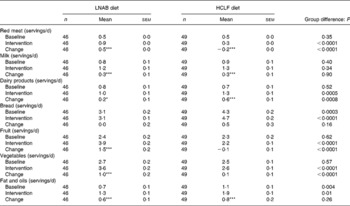
Both the LNAB and HCLF diets resulted in significant changes in nutrient intakes (Table 3), consistent with the aims of the study. Notably, PRAL, as a measure of the dietary acid load, was significantly decreased from baseline in the LNAB group from week 2 (Fig. 1 and Table 3) and was significantly lower than that of the HCLF group throughout the intervention period (Fig. 1). On the base-producing diet, the LNAB group had an average PRAL of − 9·0 mEq/d and NEAP of 38·0 mEq/d, while those on the HCLF diet had PRAL of 14·1 mEq/d and NEAP of 52·8 mEq/d. The inclusion of lean red meat in the LNAB group resulted in an increase of protein by 12·2 (sem 3·1) g/d and total fat by 12·1 (sem 3·4) g/d; however, there was no significant change in percentage energy derived from protein and percentage energy from protein did not differ between the two diet groups. After adjustment for energy, compared with the HCLF diet, the LNAB group reported a greater intake of K (35 %) and lower intake of Na (53 %) and Ca (13 %).
(Mean values with their standard errors)
LNAB, low-Na base-producing; HCLF, high-carbohydrate low-fat.
Difference from baseline was significant: * P < 0·05, ** P < 0·01, *** P < 0·001, **** P < 0·0001 (paired t tests).
The effect of the low-Na base-producing diet (○; n 46) and the high-carbohydrate low-fat diet ( × ; n 49) on potential renal acid load (PRAL) over the 14-week study. Values are means, with standard errors represented by vertical bars.
Food records showed that, during the intervention period, the LNAB subjects consumed on average 85 (sem 5) g cooked red meat per d, which was an increase of 56 g/d from baseline, and 62 g more red meat per d than the HCLF group. Analysis of weekly food group diaries confirmed red meat intakes, indicating average daily red meat intake increased from 0·5 servings at baseline to 0·9 servings during the intervention period (P < 0·0001) in the LNAB group (Table 4). The LNAB group also increased consumption of milk by 0·3 servings/d (P < 0·0001), other dairy products by 0·2 servings/d (P = 0·033), fruit by 1·5 servings/d (P < 0·0001) and vegetables by one serving/d (P = 0·006), as shown in Table 4. In contrast, HCLF subjects reduced their red meat consumption by 0·2 servings/d (P < 0·0001), increased intakes of milk by 0·3 servings/d and other dairy products by 0·6 servings/d (both P < 0·0001) from baseline. Overall the LNAB group had a greater increase in fruit, vegetables and red meat, but less of an increase in dairy products other than milk, compared with the HCLF group. During the intervention period, both groups reported using more fats and oils in their diet compared with baseline.
(Mean values with their standard errors)
LNAB, low-Na base-producing; HCLF, high-carbohydrate low-fat.
Difference from baseline was significant: * P < 0·05, *** P < 0·001 (paired t tests).
Change in body weight and total body fat mass
Although both diets were designed to maintain body weight, at the end of the study, there was a small, but significant, reduction in body weight in both groups, by 1·2 (sem 0·3) kg for the LNAB group and 1·0 (sem 0·3) kg for the HCLF group. However, there was no significant difference in weight reduction between the groups. Likewise, measurements of total body fat by dual-energy X-ray absorptiometry showed that both the LNAB and HCLF groups had a similar small reduction in total body percentage fat mass: 0·8 (sem 0·2) kg in the LNAB subjects and 0·7 (sem 0·2) kg in the HCLF subjects (both P < 0·01).
Associations of urinary electrolyte excretion and dietary acid load with bone turnover markers
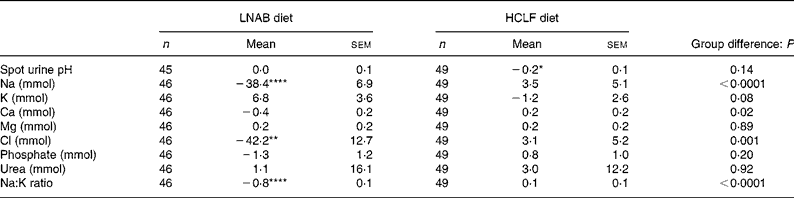
The 24 h urinary analysis confirmed that a high level of compliance was achieved in both diet groups. During the dietary intervention period, the LNAB group had a 26 (sem 6) % fall in urinary Na, and a trend for a fall in Ca excretion of 0·4 (sem 0·2) mmol/d (P = 0·07), and an increase in K excretion of 6·8 (sem 3·6) mmol/d (P = 0·07). The HCLF group had no significant change in urinary electrolyte excretion, but their urinary pH was reduced by 0·2 (P = 0·03; Table 5). When subjects were pooled, PRAL during the intervention period was correlated with urinary Na (r 0·59; P < 0·0001), K (r − 0·31; P = 0·002) and Ca (r 0·33; P = 0·0008) excretion. The reduction in urinary Na was associated with a reduction in urinary Ca, within groups, LNAB (r 0·32; P = 0·03) and HCLF (r 0·34; P = 0·02) and when both groups were pooled (r 0·39; P < 0·0001) where a 40 mmol reduction in urinary Na was associated with a reduction of 16 mg urinary Ca excretion.
(Mean values with their standard errors)
LNAB, low-Na base-producing; HCLF, high-carbohydrate low-fat.
Difference from baseline was significant: * P < 0·05, ** P < 0·01, **** P < 0·0001 (paired t tests).
Change in bone turnover markers
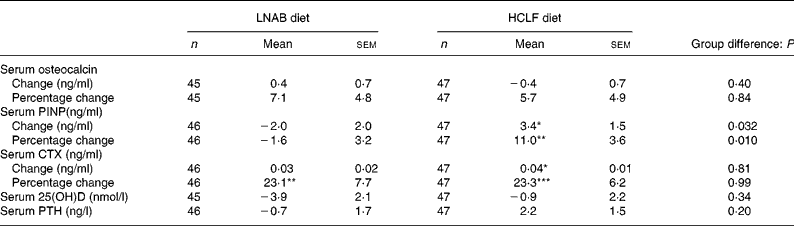
After a 14-week period of the intervention, there was a 23 (sem 5) % increase in bone resorption as assessed by serum CTX levels, but no change was observed in serum osteocalcin both in the LNAB and HCLF groups (Table 6 and Fig. 2). Whilst there was no change in osteocalcin, the HCLF group had an increase in PINP, by 11 (sem 4) % (P = 0·003), which was different from the change seen in the LNAB group (difference between groups of 13 (sem 5) %). Results of the repeated-measures ANOVA tests showed that the LNAB and HCLF groups had a similar trend of changes in serum CTX, while no trend of changes in serum PINP was observed in either group (Fig. 2).
(Mean values with their standard errors)
LNAB, low-Na base-producing; HCLF, high-carbohydrate low-fat; PINP, procollagen type I N-terminal propeptide; CTX, C-terminal telopeptide of type I collagen.
Difference from baseline to week 14 was significant: * P < 0·05, ** P < 0·01, *** P < 0·001 (paired t tests).
The effect of the low-Na base-producing diet (■; n 46) and the high-carbohydrate low-fat diet (△; n 49) on serum bone markers: (a) C-terminal telopeptide of type I collagen (CTX); (b) osteocalcin; (c) propeptide of type 1 procollagen (PINP); (d) parathyroid hormone (PTH). Values are means, with standard errors represented by vertical bars.
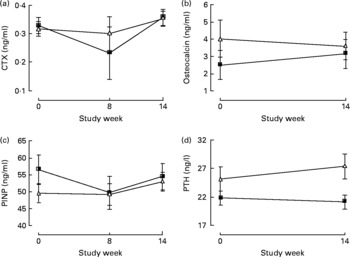
There were positive relationships only in the HCLF group between the change in CTX and the change in PRAL (r 0·33; P = 0·02; n 47) and in NEAP (r 0·38; P = 0·01; n 47), and also between the change in osteocalcin and the change in PRAL (r 0·31; P = 0·03; n 47); where dietary acid load increased, so did CTX and osteocalcin. These associations were not observed in the LNAB diet group. Neither the change in PRAL nor NEAP was associated with the change in serum PNIP in either group.
Discussion
We did not find any difference between the two diets for change in bone resorption, as both groups has a similar 23 % increase in CTX, although there was a small difference in PINP, a marker of bone formation. One diet was based on the low-Na DASH diet(Reference Sacks, Svetkey and Vollmer22), which included the consumption of meat on most days and had a low dietary acid load (LNAB), and the other was a HCLF diet generally recommended to reduce cardiovascular risk, which had a relatively higher dietary acid load. The present results differ from those of Lin et al. (Reference Lin, Ginty and Appel13) who demonstrated that a low-Na DASH-type diet for 30 d reduced CTX (bone resorption) by 16–18 % and also resulted in a fall in serum osteocalcin by 8–11 %. It has been proposed that Westernised diets that favour a net acid-producing environment may affect bone metabolism adversely by increasing bone resorption. In vitro experiments have shown that administration of exogenous acids causes the release of bone mineral base into the systemic circulation(Reference Buclin, Cosma and Appenzeller23, Reference Bushinsky24), but this has not been confirmed in vivo, as the body has a number of efficient buffering mechanisms to prevent significant changes in serum pH.
The physiological significance of the 23 % increase in CTX observed in the present study is not clear as there are few studies assessing this in ‘healthy’ women in this age group. Our group primarily included postmenopausal women, and increases in bone resorption are frequently seen in women postmenopause. Postmenopausal women have elevated levels of bone resorption markers compared with premenopausal women, particularly CTX, which has been found to be 64 % higher in postmenopausal women(Reference Reginster, Henrotin and Christiansen25). It has been proposed that consuming a diet with a high acid load results in an increased risk of chronic low-grade metabolic acidosis. A high acid environment is associated with a negative Ca balance and increased bone loss(Reference Barzel and Jowsey26, Reference Lemann, Litzow and Lennon27), and a reduction in extracellular pH, even within the physiological range, has been found to increase osteoclastic activity(Reference Arnett and Spowage28). Accordingly, it would be expected that if there were an effect of dietary acid load on bone health, this would be reflected in the rate of bone resorption; however, we found no such effect with a high dietary acid load on bone resorption. Few studies have assessed changes in bone resorption with dietary interventions. One study conducted in young men found a 12·5 % increase in serum CTX after consumption of 2·5 litres Coca Cola per d, compared with those who consumed 2·5 litres of low-fat milk(Reference Kristensen, Jensen and Kudsk29).
Both diets in the present study were designed to maintain body weight. Subjects were encouraged to consume more monounsaturated and/or polyunsaturated fats and oils in order to meet their energy requirements. However, it was found that, after 14 weeks of intervention, both groups experienced a small, but significant, fall in body weight. This is commonly seen when individuals participate in dietary studies, particularly those that restrict high-fat foods. One study, in elderly women, found that over 12 months, the group that gained more weight (about 2·5 kg) had a significant reduction of 32 % in serum CTX at 3 months(Reference Hampson, Martin and Moffat30). Accordingly the small fall in body weight could have contributed to the small increase in bone resorption seen in both groups. Consistent with this proposition, we found, when pooling the data from the two groups, that weight loss was associated with increased CTX (r − 0·23; P = 0·002).
The 11·0 % increase in PINP we observed in the HCLF group at the end of the study was relatively small compared with the change observed in hormone replacement therapy and other drug therapies(Reference Deal, Omizo and Schwartz31, Reference Peris, Alvarez and Monegal32), but it was comparable with the 11·3 % increase seen in a group of postmenopausal women after 16 weeks on Pravastatin therapy(Reference Mostaza, De la Piedra and Díaz Curiel33). The increase in PINP experienced by the higher-acid load diet group could indicate an adverse effect, indicating increased bone turnover, or it may result, in the long term, in maintenance of bone mass.
Dietary acid load and bone turnover
We achieved a difference in dietary acid load between groups which was confirmed by an decrease in spot urine pH in the HCLF group, and a difference in reported nutrient intakes, as well as an increase in urinary K and lower Na in the LNAB group. We achieved these differences through manipulation of dietary intake utilising a different combination of food groups (more fruit and vegetables in the LNAB diet and more cereals in the HCLF diet group) rather than relying on supplements. This approach is more likely to result in differences between groups in associated nutrients and minerals (which may have additional benefits), evident in different dietary patterns. This is in contrast to altering the acid–base balance with single supplements, which may have different effects from a food-based intervention. Results from a 2-year study indicated no reduction in bone turnover or increased BMD in healthy postmenopausal women supplemented with potassium citrate(Reference Macdonald, Black and Aucott34). As suggested by Macdonald et al. a change in acid load may not be significant for those with adequate dietary Ca, but may only exert a significant adverse effect on bone health when coupled with a low-Ca diet(Reference Macdonald, Black and Aucott34). Therefore, we may not have been able to detect any effect of acid load on bone resorption as both groups had a reasonable Ca intake, which was higher than their usual diets.
Dietary acid load did not appear to increase bone turnover, as we could not detect any association of PRAL or NEAP with any of the bone turnover markers. The present results confirm those of a longer-term, randomised controlled study over 2 years that compared potassium citrate supplementation with a diet high in fruits and vegetables, and found that dietary acid load had no effect on bone mineral homeostasis in postmenopausal women(Reference Macdonald, Black and Aucott34). It is possible that factors other than acid load drive bone turnover on Ca-adequate diets. It should be noted that in the high-acid load diet group only, we found a positive association between the change in dietary PRAL and both the change in CTX and osteocalcin (i.e. the higher the acid load the greater the increase in bone turnover markers), indicating a potential influence of dietary acid–base balance on bone turnover on a more Western dietary pattern. Apart from the potential beneficial reduction in urinary Ca excretion, we could not demonstrate any other beneficial effects on bone turnover with the low-Na, low-acid load dietary pattern. The LNAB diet resulted in a significant decrease in urinary Na and a greater reduction in urinary Ca excretion, with Ca excretion decreasing by 16 mg/40 mmol Na reduction. This result is comparable with other published reports which have demonstrated that a reduction in Na intake reduces urinary Ca losses(Reference Nordin, Need and Morris11, Reference Need, Morris and Cleghorn35) and may have a long-term beneficial effect by reducing bone loss(Reference Devine, Criddle and Dick12).
Subjects appeared to comply well with the dietary recommendations as evidenced by the assessment of food group diaries and confirmed by results from the repeat 24 h food records. For dietary K there was a clear increase in reported intake in the LNAB diet of 1106 mg/d (28 mmol/d), but the increase in urinary K excretion was modest at only 6 mmol/d. Although the difference in the change between groups was only marginally significant, we do believe there was a real difference in dietary K intake. We have previously found that at higher intakes of dietary K, urinary K does not accurately reflect dietary intake(Reference Nowson, Worsley and Margerison36).
Limitations of the study
The benefit of using biochemical markers is that they are non-invasive and produce results in a short timeframe(Reference Seibel37). Although the present study was relatively short (14 weeks), we expected to detect effects on bone turnover, as bisphosphates have a clear effect on bone resorption at 7 d, and changes in bone formation are seen by 2 months(Reference Sebba, Broy and Kohles38), and Lin et al. found significant differences in bone after 30 d dietary intervention(Reference Lin, Ginty and Appel13). It is possible that a longer study may capture the full extent of bone formation changes, as markers of bone formation can lag behind changes in markers of bone resorption(Reference Watts39). We acknowledge that we only had limited power to detect difference in bone turnover markers, due to the wide variability. Based on post-study calculations, we had 80 % power to detect an 11–18 % difference in serum CTX, but only between 50–80 % power to detect an 11 % difference in PINP at P < 0·05. As with other studies, we found a wide intra-individual variability of the circulating levels of bone turnover markers(Reference Hannon and Eastell40–Reference Vesper42), and it is possible that there were small changes in bone turnover that were below detectable levels. The menopausal status of subjects may be one of the factors contributing to a wide variability of bone turnover markers; however, there is significant overlap beween early and late menopausal status for markers of bone turnover, suggesting that this is an unlikely factor(Reference Hannon and Eastell40, Reference Garnero, Sornay-Rendu and Chapuy43). Seasonal variation may also have contributed to high variability in bone turnover markers; however, this too is unlikely, as there was no difference in serum 25-hydroxyvitamin D levels during the study for either group. Food intake and circadian variability seems to have strong effects on bone resorption and although we minimised these effects by taking measurements after an overnight fast, these factors may have contributed to the high variability.
Overall, bone resorption was not different between the LNAB and HCLF diets. The dietary acid load did not have a consistent effect on bone turnover and the biological significance of the changes in bone turnover, particulary the increase in PINP, a bone formation marker, with the higher-acid load diet in the present short-term study is not clear. The fall in urinary Ca excretion on the lower-Na DASH-type diet is likely to have a beneficial effect on bone in the long term. This reduction in urinary Ca was driven by the reduction in dietary Na, but longer-term studies are required to confirm the benefits of this type of dietary pattern. It would be worthwhile to assess if a lower-acid load diet assists in maintaining bone health on a lower-Ca diet, as this is particularly relevant for older individuals who usually find it difficult to consume sufficient dietary Ca from food sources.
Acknowledgements
The present study was supported by Meat & Livestock Australia. We thank Dr Mark Devlin for assisting in reviewing the literature and initial manuscript drafting.
The authors' responsibilities were as follows: C. A. N. was responsible for the study concept, design, interpretation of data and critical revision of the manuscript for important intellectual content; A. P. was responsible for the collection of data; N. W. was responsible for the analysis and interpretation of data and writing of the manuscript.
The authors had no financial or personal conflict of interest.


