


Introduction
Glaciers and their snow cover represent storage of water over a wide range of timescales (e.g. Reference Jansson, Hock and SchneiderJansson and others, 2003). Changes in glacier mass balance may have great effects on streamflow both in annual volume (e.g. Reference Huss, Farinotti, Bauder and FunkHuss and others, 2008; Reference Farinotti, Usselmann, Huss, Bauder and FunkFarinotti and others, 2012) and in magnitude of melt-water floods (e.g. Reference Nolin, Phillippe, Jefferson and LewisNolin and others, 2010; Reference Jost, Moore, Menounos and WheateJost and others, 2011). Therefore, monitoring of glaciers is relevant to water resource management such as water supply or the operation of hydroelectric facilities (e.g. Reference Hock, Jansson, Braun, Huber, Bugmann and ReasonerHock and others, 2005). As glaciers are very sensitive to climate variations (e.g. Reference Kaser, Cogley, Dyurgerov, Meier and OhmuraKaser and others, 2006), climate change is expected to have a major influence not only on ice volume but also on associated meltwater discharge both in magnitude and seasonality (e.g. Reference Dahlke, Lyon, Stedinger, Rosqvist and JanssonDahlke and others, 2012), and knowledge of mass balance is crucial for hydrologic modelling of glacierized catchments (e.g. Reference Schaefli and HussSchaefli and Huss, 2011). However, many records of glacier measurements are quite short and cover only a small part of the glacierized area as extensive field measurements are expensive and labor-intensive (Reference BraithwaiteBraithwaite, 2002). Glacier mass-balance changes over long time-spans can be determined, for example, from surface elevation changes using laser scanning (e.g. Reference Geist, Elvehøy, Jackson and StotterGeist and others, 2005) or aerial photography (e.g. Reference KaabKaab, 2000; Reference Haug, Rolstad, Elvehøy, Jackson and Maalen-JohansenHaug and others, 2009). To fill the gaps in determining mass balance at the regional scale and at high temporal resolution, previous studies have either extrapolated available measurements (e.g. Reference HussHuss, 2012) or used mass-balance models of different complexities (for a review see Reference HockHock, 2005). For the latter, approaches range from simple temperature-index models (e.g. Reference Johannesson, Laumann and KennettJohannesson and others, 1995) to complex surface energy-balance models (e.g. Reference Hock and HolmgrenHock and Holmgren, 2005). The required input for those models ranges from measurements at a nearby weather station to output of regional climate models (Reference Machguth, Paul, Kotlarski and HoelzleMachguth and others, 2009). However, the requirement of temporally and spatially distributed input data is often a limiting factor for mass-balance modelling over long time-spans (Reference Andreassen and OerlemansAndreassen and Oerlemans, 2009) or over large areas.
In mainland Norway, glacier mass balance is especially important for the country’s hydropower potential as well as an indicator of climate variations. Measurements of glacier mass balance have been carried out on more than 40 glaciers, with the oldest and longest continuous series starting in 1949 (Reference Andreassen, Elverøy, Kjøllmoen, Engeset and HaakensenAndreassen and others, 2005). The results are published annually (e.g. Reference Kjøllmoen, Andreassen, Elvehøy, Jackson and GiesenKjøllmoen and others, 2011) in reports of the Norwegian Water Resources and Energy Directorate (NVE). Although many glaciers are measured, the records are not able to show a complete picture of the temporal and spatial variability. Some studies have attempted to fill the gaps by the reconstruction of mass-balance data using upper-air meteorological data (e.g. Reference Rasmussen, Andreassen and ConwayRasmussen and others, 2007; Reference Andreassen, Kjøllmoen, Rasmussen, Melvold and NordliAndreassen and others, 2012a).
The aim of this study is to provide an overview of the temporal evolution of glacier mass balance in mainland Norway. Therefore, we used the operationally gridded temperature and precipitation datasets from seNorge and a distributed temperature-index approach including potential direct solar radiation (Reference HockHock, 1999) in order to model the mass balance of the glacierized surface of Norway for the period 1961–2010.
Mass-Balance Data
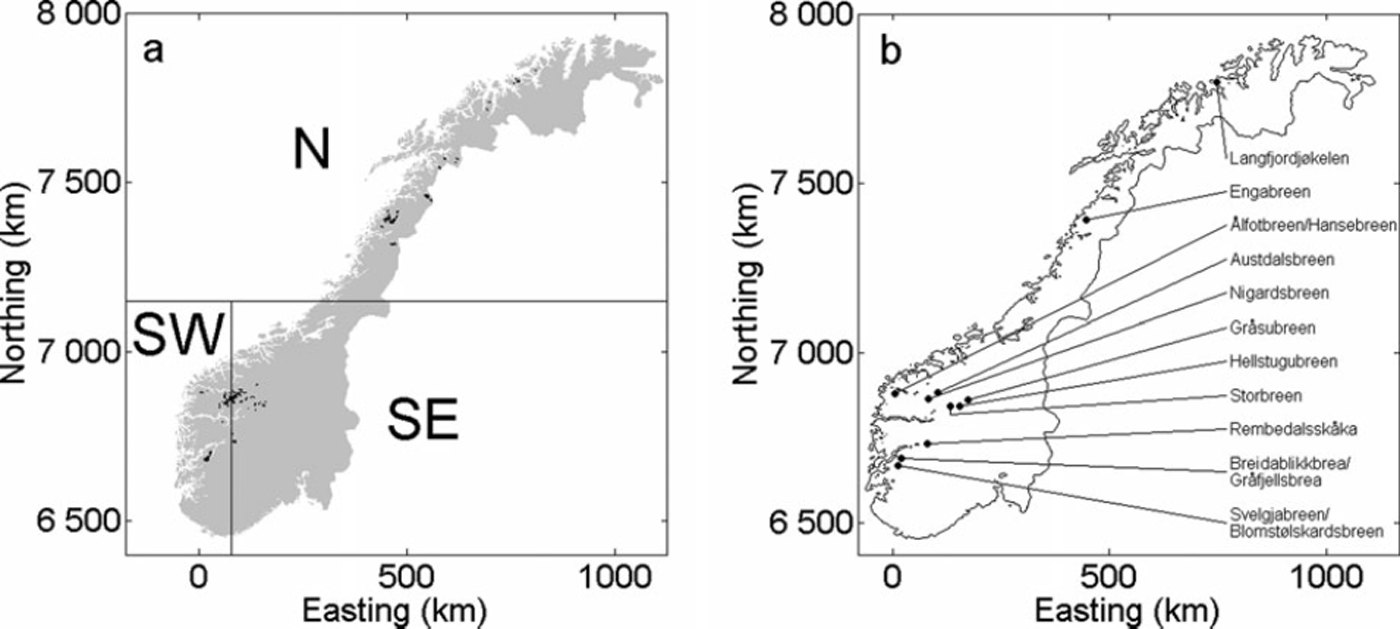
The total glacierized area in mainland Norway (Fig. 1) is 2693 km2 (Reference Andreassen, Winsvold, Paul and HausbergAndreassen and others, 2012b), of which 92% is located between 800 and 1900 ma.s.l. (Fig. 2a). It comprises glaciers of different types and sizes; common types are ice caps, valley glaciers and cirque glaciers. The climate conditions vary significantly over the country not only in terms of temperature and precipitation, but also in terms of potential solar radiation given the large range in latitude (59.7–70.58 N).
(a) Glacierized area of mainland Norway divided into three regions, north (N), southwest (SW) and southeast (SE), with each having about equal areas of glacierized surface. Coordinates are given in Universal transverse Mercator (UTM) grid zone 33. Data source: Statens kartverk (the Norwegian Mapping Authority). (b) Position of mass-balance measurements with >10 years time series.
Hypsometry of the glacierized area in Norway and of the area where glacier mass-balance measurements were carried out in 2010, based on the seNorge grid altitudes.
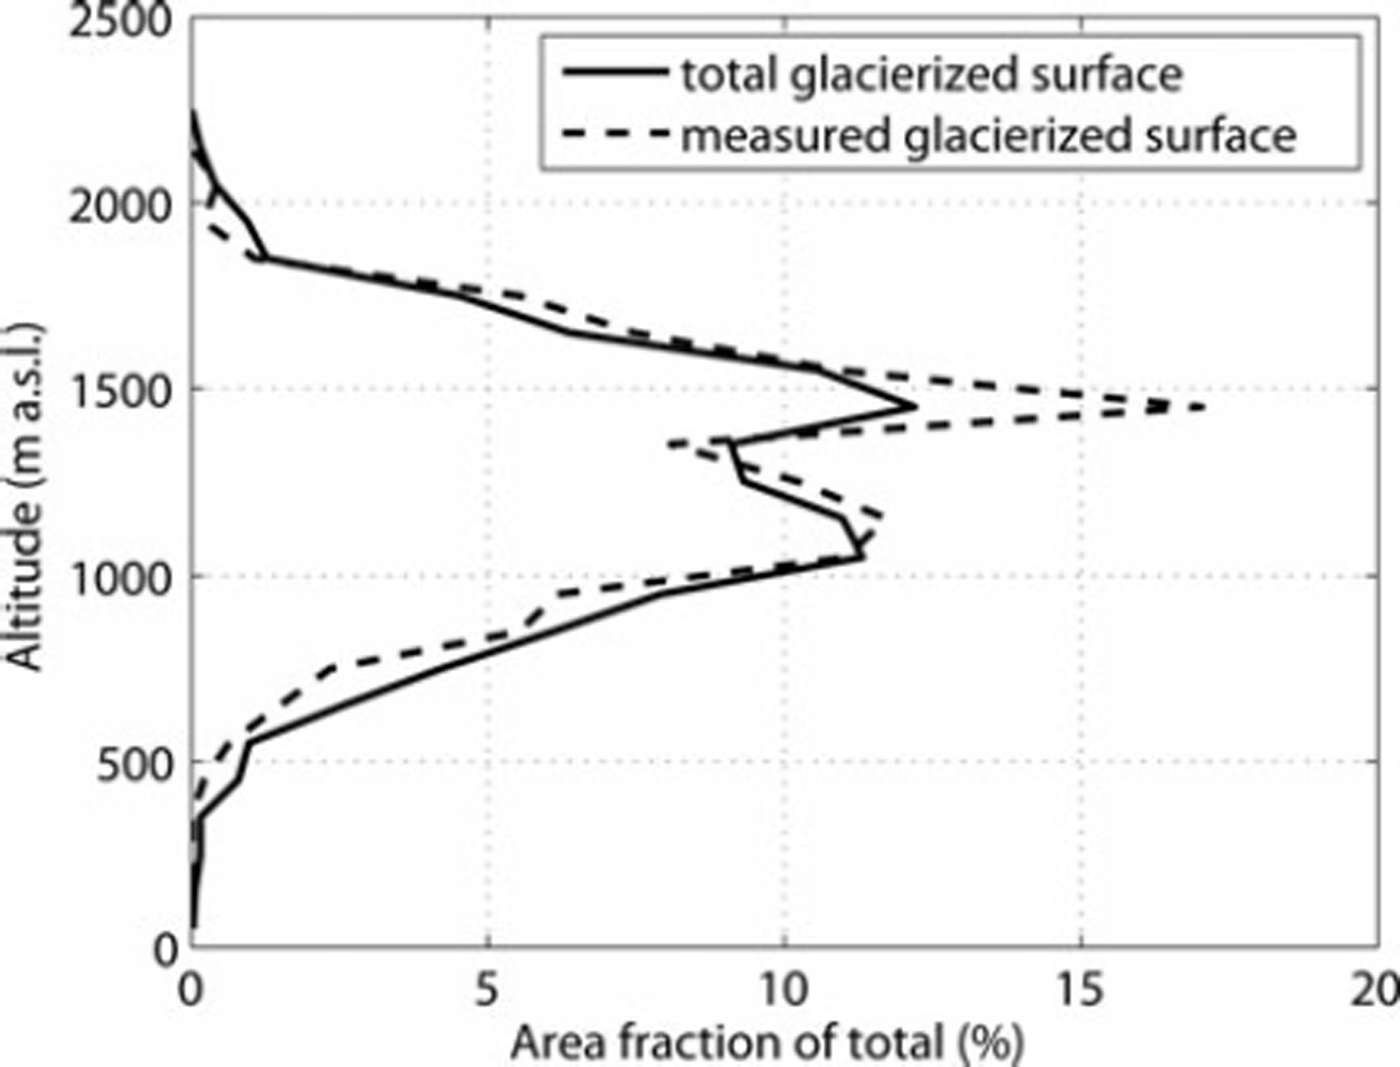
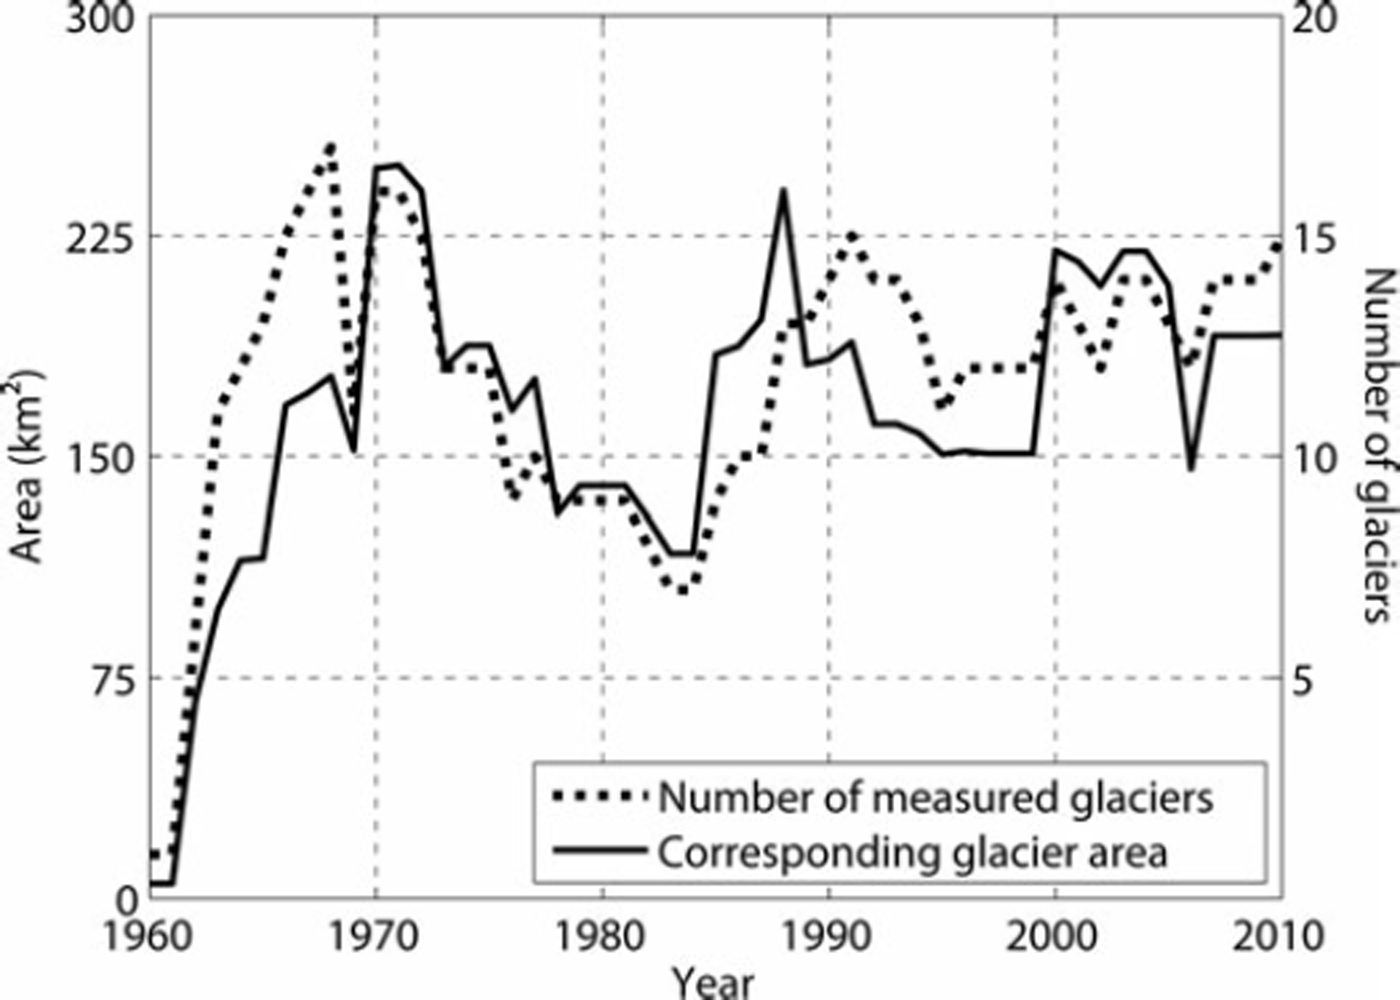
Mass-balance measurements have been performed in Norway since 1949, starting on Storbreen, a glacier in the Jotunheimen mountain massif in central-southern Norway. Over the period 1961–2010, mass-balance measurements have been performed on a total of 42 glaciers in mainland Norway (Reference Kjøllmoen, Andreassen, Elvehøy, Jackson and GiesenKjøllmoen and others, 2011). In 2010, mass-balance measurements were performed on 15 glaciers with a total glacier area of 191 km2 and representing ∼ 7 % of the glacierized area in mainland Norway. Comparing the hypsometric distribution of the surveyed glaciers with that of the total glacierized area reveals that the surveyed glaciers span a representative range of altitudes (Fig. 2). However, the available mass-balance records are biased towards glaciers selected for hydrologic reasons, i.e. demands for development and operation of hydroelectric power stations. Therefore, many mass-balance datasets are quite short, covering only a few years. Measurements have never been carried out at more than 17 glaciers during the same year, and the corresponding glacier area for which mass-balance data are available varies since 1964 between 1, 20 and 250km2 (Fig. 3) representing 5-10% of the total glacierized area. The number of surveyed glaciers displays a maximum during the International Hydrological Decade (1965-74) and an increasing trend after a minimum in the early 1980s. A detailed overview of all glacier mass-balance measurements for the period 1949–2003 together with characteristics of the surveyed glaciers is given by Reference Andreassen, Elverøy, Kjøllmoen, Engeset and HaakensenAndreassen and others (2005).
Number and corresponding area of glaciers where mass-balance measurements were carried out between 1961 and 2010. Data source: NVE.
The reported annual glacier-wide mass balances are derived by hypsometric integration of separate measurements of winter and summer mass balances at each glacier. The winter balance is obtained by measuring the bulk snow density and probing the snow depth along different profiles in order to capture spatial accumulation patterns. Stake readings and snow coring are used to confirm the probing. The summer balance is obtained from measurements at a network of stakes. The annual balance is calculated as the sum of the winter and summer mass balance. In this study we used the seasonal glacier-wide mass balances of the surveyed glacier area for model parameter calibration.
Methods
In 2003, the Norwegian Meteorological Institute, NVE and the Norwegian Mapping Authority (Statens kartverk) launched the service seNorge (Norwegian for ‘See Norway’), which provides gridded meteorological and hydrological information for mainland Norway on its website (http://senorge.no). The temperature and precipitation fields are interpolated from available station measurements. In the present version (v.1.1) of seNorge, gridded products of daily (06.00 to 06.00 UTC) meteorological and hydrological fields at 1 km horizontal resolution are available for all of mainland Norway. The grids have been generated for the period from 1957 to the present and are regularly updated. Derived quantities such as snow depth, snow water equivalent or snowmelt are determined by a degree-day model (Reference Engeset and JarvetEngeset and others, 2004). A detailed review of the interpolation methods of temperature and precipitation is provided by Reference MohrMohr (2008). Despite some weaknesses with the precipitation inter- and extrapolation in the mountainous regions, different evaluation studies found the gridded data of seNorge to be valuable, especially due to their high spatial resolution (Reference MohrMohr, 2009; Reference DyrrdalDyrrdal, 2010; Reference Engelhardt, Schuler and AndreassenEngelhardt and others, 2012; Reference SalorantaSaloranta, 2012).
To calculate mass balances for the glacierized area of Norway, a model was set up using the gridded temperature and precipitation data from seNorge as input. The glacier outlines are available as shapefiles based on aerial photography from the Norwegian Mapping Authority. The outlines were intersected with the seNorge grid, and the model was run at daily time-steps for these glacier gridpoints for the period of available seNorge data (1957-2010). Changes of the individual glacier areas during the model period were not accounted for. Precipitation was accumulated as snow when the air temperature was below the threshold temperature for snowfall (Ts). According to observations by Reference AuerAuer (1974), the probability of snow occurrence is ∼ 5 0% at a temperature of 2°C. We adopt this threshold and apply a transition interval (1°C, 3°C) where the precipitation shifts linearly from snow to rain. Daily melt Mof snow or ice was calculated when the air temperature was above the threshold temperature for melt (Tm = 0°C) using a distributed temperature-index approach including potential direct solar radiation (see Reference HockHock, 1999):

with the melt factor MF, the radiation coefficients RC for snow and ice, the potential direct solar radiation I and the seNorge air temperature Tsn. Differences in potential solar radiation due to exposition or shading effects of surrounding slopes were not accounted for as the grid resolution of 1 km would not resolve such phenomena appropriately. However, since potential solar radiation depends first of all on latitude, the use of radiation coefficients is a way to account for latitudinal differences in melt energy along the large north-south extent of Norway. To retrieve seasonal mass balances from the diurnal mass-balance series, we defined the start and the end of each season as the day when the glacier-wide mass balance was at its annual maximum (end of winter) or at its minimum (end of summer). To build up reasonable snow cover on the glacier surface, we used the period 1957-60 as model spin-up time and excluded it from the calibration and validation periods.
The winter mass balance is mainly dependent on precipitation. In seNorge, the measured precipitation values are interpolated to the grid at sea level using triangulation (Reference Jansson, Tveito, Pirinen and ScharlingJansson and others, 2007) and adjusted to the respective seNorge grid altitude using vertical precipitation gradients of p1 = 10%(100ma.s.l.)–1 for elevations H< 1000 ma.s.l. and p2 = 5% (100 m a.s.l.)-1 for H> 1000 m a.s.l. (Reference Jansson, Tveito, Pirinen and ScharlingJansson and others, 2007). Previous validation studies evaluated seNorge precipitation data with measurements of winter mass balances or snow water equivalent (Reference Engelhardt, Schuler and AndreassenEngelhardt and others, 2012; Reference SalorantaSaloranta, 2012). Results indicate that seNorge both under- and overestimates precipitation depending on location.
Accordingly, we calibrated the seNorge precipitation gradients for the given threshold temperature, to best reproduce the winter mass-balance measurements for the whole glacier area in Norway. The melt factor and the radiation coefficients are calibrated to best reproduce the summer mass-balance measurements. Since melt can also occur during the winter season and snowfall during the summer season, the seasonal parameters are not independent of each other and have to be optimized in an iterative process. The calibration was performed by varying parameter values within physically plausible limits over ranges of predefined steps, aiming to minimize the resulting root-mean-square error (rmse) between modeled and measured seasonal mass balances. The different glacier sizes within this area were accounted for by including a weighting factor representing the surveyed glacier area for each year. The calibration process covers every second year (starting with 1961) of the model period (years of calibration). The remaining years were used to evaluate the calibrated parameter set (years of validation). By this method, we obtained a constant model parameter set which is for both time and space adjusted to the available measurements of the entire model domain.
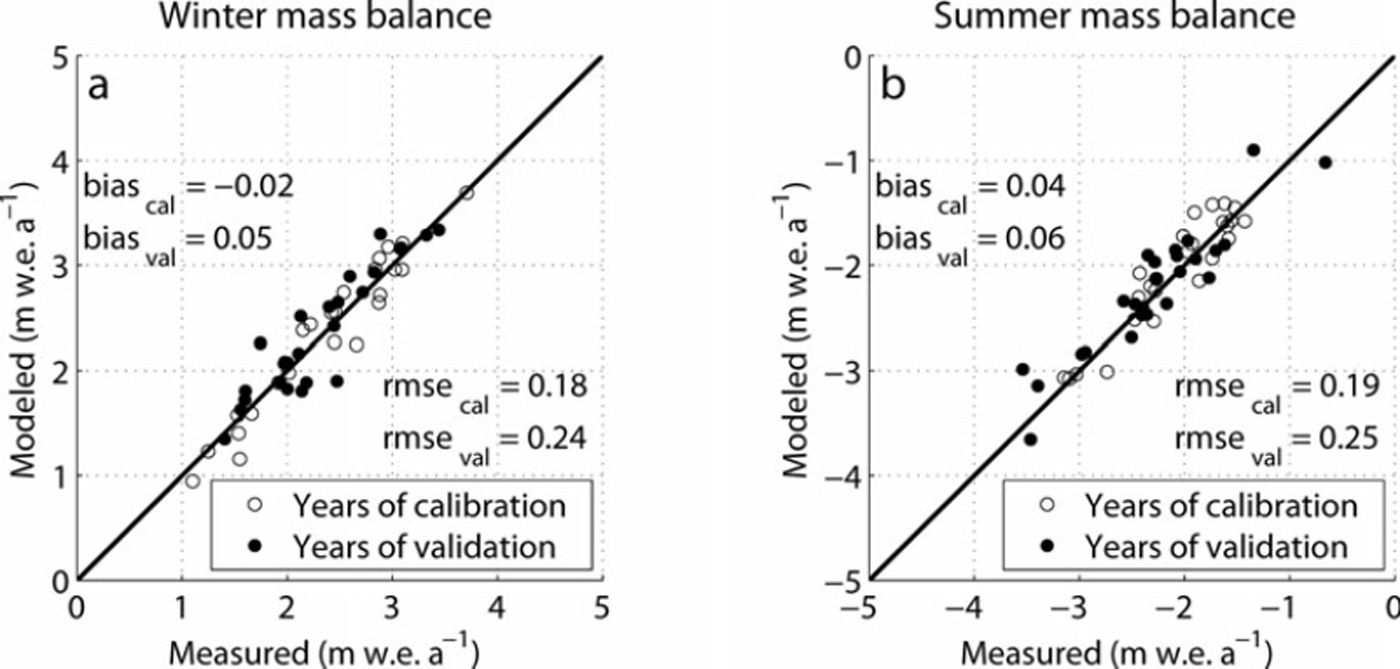
Results
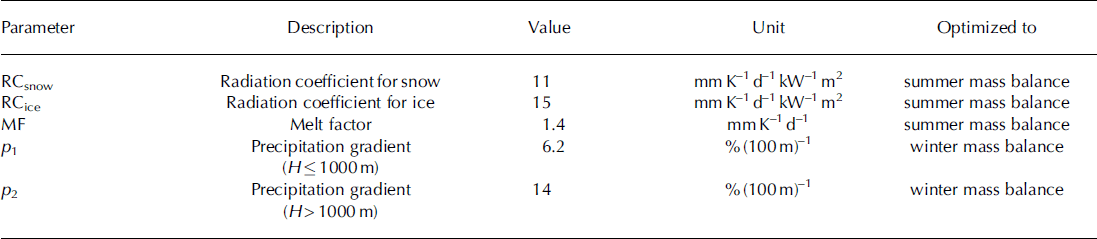
Calibrated parameter values controlling melt and optimized precipitation gradients are presented in Table 1 . In general, measured and modeled mass balances are in good agreement for both winter and summer, yielding an rmse of 0.18–0.19 m w.e. a–1 for the years of calibration and 0.24–0.25 m w.e. a–1 for the years of validation, with a slightly better agreement of winter mass balances (Fig. 4). During the model period, no significant periods of over- or underestimation can be found for the winter balances (Fig. 5a). In contrast, the summer balances were modeled to be less negative for the whole period 1975–85, which corresponds to a period of fewer glacier measurements (Fig. 3b) and therefore of lower weight in the calibration process. The uncertainty of glacier-wide balances is on average 0.19 mw.e. a–1 for winter and 0.18 mw.e. a–1 for summer, but, for individual glaciers, model biases can reach 1 m for winter (Fig. 5b) and summer balances (Fig. 5c). However, no weighting factor representing the change in glacier area covered by measurements is included in this analysis.
Specific (a) winter and (b) summer glacier mass balances for each year from 1961 to 2010 for the surveyed glacier area and corresponding model results with an rmse for the years of calibration (odd-numbered years) and validation (even-numbered years).
(a) Modeled and measured seasonal mass balances for the surveyed glacier area of Norway for 1961–2010 and (b, c) annual uncertainties of the seasonal model results based on glacier-wide differences between measurements and model output for (b) winter balances and (c) summer balances.

Applied parameter set in the model that is optimized to all measured mass-balance series in mainland Norway
Evaluating the parameter set in Table 1 for different locations in Norway, we modeled the seasonal mass balances for three glaciers with an observation period of >40 years: Engabreen, Nigardsbreen and Storbreen. Applying the parameter set to these single glaciers yields larger deviations of the model results compared with the respective measurements, with an rmse of the seasonal balances between 0.29 and 0.54m w.e. a–1 (Fig. 6). Results reveal further that, for Engabreen, modeled winter balances are too negative, while modeled summer balances are too positive (Fig. 6a). For Nigardsbreen both modeled winter and summer balances are too positive (Fig. 6b), whereas both seasonal balances are too negative for Storbreen. Furthermore, results for Storbreen show an increasing bias of the model results for years of large winter balances (Fig. 6c).
Modeled versus measured seasonal mass balances from (a) Engabreen, (b) Nigardsbreen and (c) Storbreen using the parameter set of Table 1 .

Modeled mass balances for the whole glacierized area of Norway show a large year-to-year variability with values between +1.0 and +3.4mw.e. a- 1 for the winter mass balances and between -1.2 and -3.6mw.e. a- 1 for the summer mass balances (Fig. 7). Whereas the winter balances show an increasing trend until the 1990s, no obvious trend can be detected for the summer balances for this period. During the first decade of the 21st century, both seasonal balances display noticeably lower values than for the first four decades considered. In the period 1961-2010, the resulting annual mass balances vary between -1.7 and +1.7 m w.e. a- 1 , with a slightly increasing trend until the 1990s, followed by a drastic decline (Fig. 7). Ten-year averages of winter mass balance show a gradual increase by ∼0.5mw.e.a– 1 between 1961 and 2000, whereas the summer mass balances appear more constant, with only minor changes of 0.15 m w.e. a- 1 during this period (Table 2). The slightly more negative summer mass balances in the 1990s were thus overcompensated by increased winter mass balances. The resulting annual mass balances were therefore increasing from values close to zero in the 1960s and 1970s to +0.37 m w.e. a- 1 in the 1990s. However, in the first decade of the 21st century, the annual mass balances declined to - 0 . 8 6 m w.e. a- 1 , with a parameter uncertainty of 0.15 m w.e. a - 1 . The decline is due to both increased summer ablation and decreased winter accumulation in roughly equal proportions (Table 2). Therefore, the cumulative mass balances reached a maximum at the turn of the century and declined in the period 2000-10, leading to a cumulative mass balance close to zero for the whole modeling period 1961-2010.
Modeled winter (squares), summer (triangles) and annual (circles) mass balances for the glacierized area of Norway for 1961– 2010 with 10 year central moving average.

Ten-year average modeled mass balances of the glacierized area of Norway (mw.e. a–1)

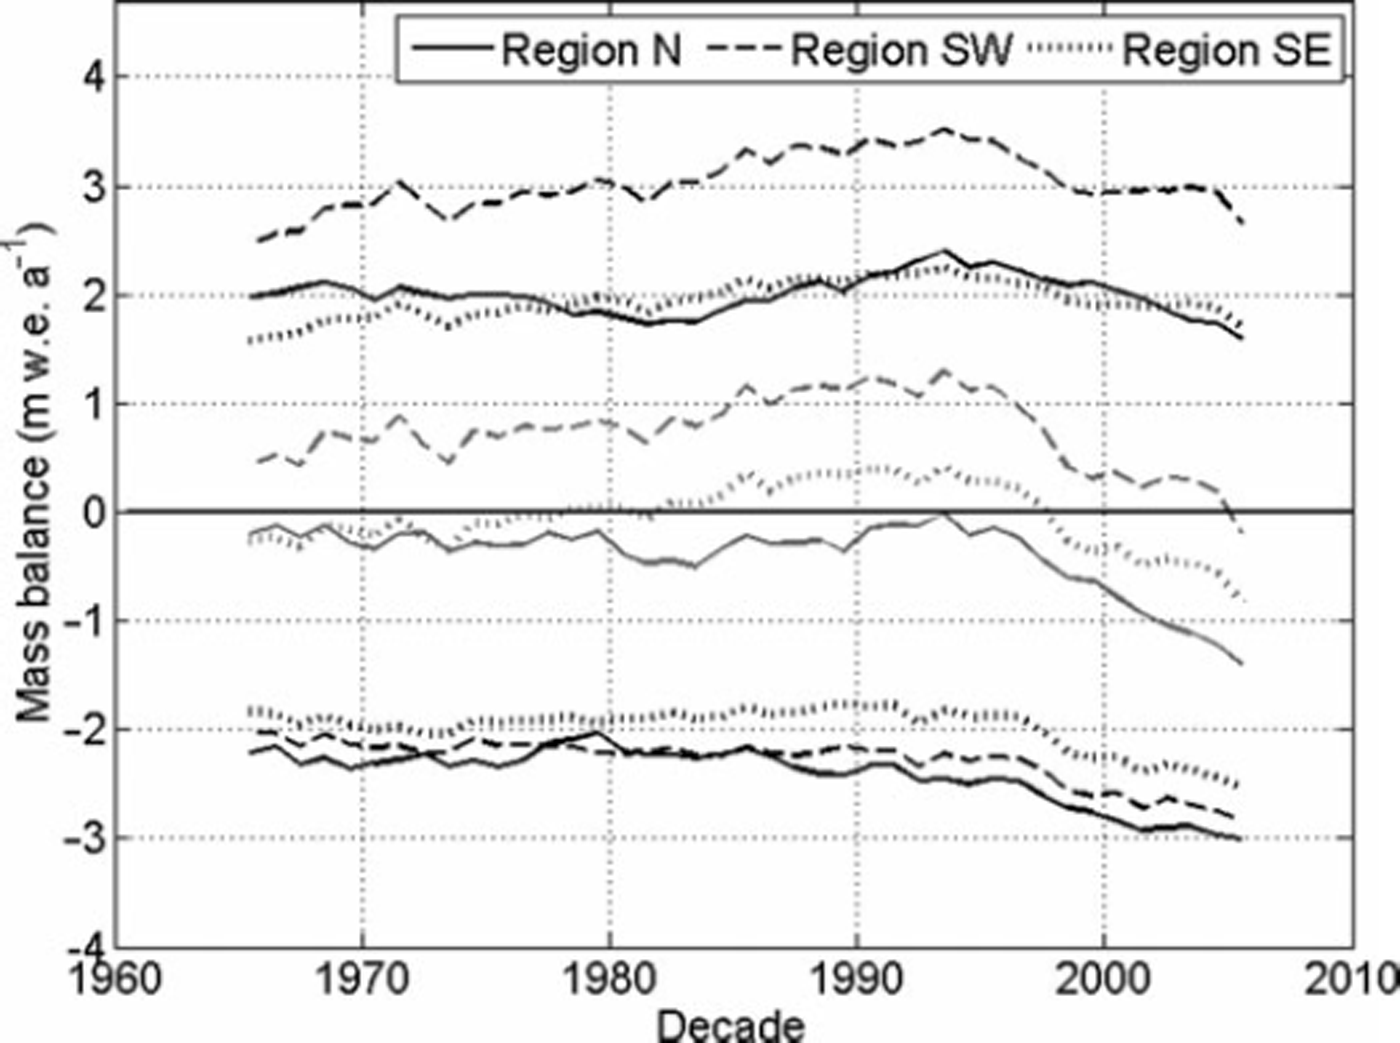
Although the parameter set is less valuable at the local scale, we try to retrieve spatial variability of glacier mass balance (Fig. 8) for the three regions of Norway shown in Figure 1a. These regions were defined such that the northern region (N) comprises the geographically more isolated cluster of glaciers. The remaining glacier area, in the south, was further subdivided into two regions, the maritime region along the southwest coast (SW), and the more continental region in the southeast (SE), yielding roughly equal glacier areas for all three regions. In region SW, the winter mass balances are ∼1 m higher and show a larger increase between the 1960s and 1990s than in the other two regions where the 10year moving averages of winter mass balance were more constant. Thus, variations in the average winter mass balance in the country are mostly dependent on variations in region SW. The summer mass balances are most negative in region N and least negative in region SE. However, the regional differences in summer mass balance are much smaller than those for winter mass balance. For all three regions the summer mass balances were almost constant over the last four decades of the 20th century, but about 0.6 m lower in the first decade of the 21st century. The variations of the annual mass balances are thus similar in space and time to those of the winter mass balances and reveal an accelerating mass loss due to both decreasing snow accumulation and intensified melt for the last decade of the modeling period in all three regions. Whereas in region SW the moving average of the annual balances has been positive during almost the whole model period, with values between +0.5 and +1.2 m w.e. a- 1 , it became negative in the most recent decade. In region N, the annual balances have always been slightly negative during this period, with an increasing negative trend for the last decade. In fact, the strongest thinning for all glaciers in mainland Norway has been observed for Langfjordjøkelen (Reference Andreassen, Kjøllmoen, Rasmussen, Melvold and NordliAndreassen and others, 2012a), a glacier situated in this region.
Ten-year moving average winter (black upper lines), annual (grey center lines) and summer (black lower lines) mass balances for the three regions in Norway defined in Figure 1 .
Discussion
Modeling glacier mass balance on large temporal and spatial scales is a challenge due to the importance of local effects on temperature lapse rate or precipitation gradients, which are underrepresented in the input data. This could lead to a miscalculation of local mass-balance gradients. Some uncertainty is related to the temperature and precipitation input datasets from seNorge, which are available at 1 km horizontal resolution where small glaciers cannot be resolved appropriately. The gridded data depend on the quality of the station measurements, the availability of which varies significantly both in space and time (personal communication from M. Mohr, 2011).
Uncertainties in the mass-balance measurements give rise to imperfect parameter calibrations. Differences between geodetic and direct methods are found at many glaciers both in Norway (Reference Østrem and HaakensenØstrem and Haakensen, 1999; Reference Andreassen, Elvehøy and KjøllmoenAndreassen and others, 2002; Reference Haug, Rolstad, Elvehøy, Jackson and Maalen-JohansenHaug and others, 2009) and in other countries (e.g. Reference KrimmelKrimmel, 1999; Reference FischerFischer, 2011). These can be due to either incorrect interpolations of point measurements or measurement uncertainties of each of the methods (e.g. Reference Rolstad, Haug and DenbyRolstad and others, 2009). For example, Engabreen’s cumulative mass-balance record from glaciological measurements is assumed to be overestimated as geodetic measurements indicate a glacier close to balance for the period 1985-2002 (Reference Haug, Rolstad, Elvehøy, Jackson and Maalen-JohansenHaug and others, 2009). Preliminary results from recent lidar campaigns confirm this disagreement. At Langfjordjø-kelen, the comparison between geodetic and direct methods for the period 1994-2008 reveals better agreement, but the results from the glaciological measurements are still ∼ 0 . 2 m w. e . a – 1 less negative than those derived from geodetic methods (Reference Andreassen, Kjøllmoen, Rasmussen, Melvold and NordliAndreassen and others, 2012a). The mass-balance record of Engabreen is currently being homogenized and revised (Reference Andreassen, Kjøllmoen, Rasmussen, Melvold and NordliAndreassen and others, 2012a). Similar work has also started for other glaciers in this study. Revised versions of the direct measurements could lead to a different optimized model parameter set than presented here, and alter the subsequent results.
As the surveyed glaciers account for only 5-10% of all Norwegian glaciers, another source of uncertainty is the use of a single parameter set to model the accumulation and ablation for all glaciers. Although the hypsometry of the surveyed glaciers is representative of the whole glacierized area (Fig. 2), optimized model parameters might be biased to the climate conditions where glacier measurements are performed.
Our model results show the mass-balance distribution for a fixed glacier surface over the model period representing a reference surface mass balance (Reference Elsberg, Harrison, Echelmeyer and KrimmelElsberg and others, 2001; Reference CogleyCogley and others, 2011). We choose to use a reference surface since changes in glacier mass balance of a reference surface are more directly linked to climate variations than in a traditional mass-balance record. With further glacier retreat, the traditional mass balance could decrease less than the temperature increase would suggest, or even increase in some places as glacierized areas at low altitudes disappear. For our study period, glacier area variations, especially for larger glaciers, are small compared with the model resolution of 1 km. Whereas Langfjordjøkelen, the glacier with the strongest thinning in mainland Norway (Reference Andreassen, Kjøllmoen, Rasmussen, Melvold and NordliAndreassen and others, 2012a), experienced a decrease in area from 5.2 km2 to 3.6 km2 between 1966 and 1994 and a further decrease to 3.2 km2 between 1994 and 2008, Nigardsbreen shows only a minor decrease from 47.8 km2 to 47.2 km2 between 1984 and 2009. Moreover, according to a study on Swiss glaciers by Reference Huss, Hock, Bauder and FunkHuss and others (2012), about half of the mass balance offset by using reference instead of conventional surface mass balance is compensated by more negative mass balance due to reduced surface heights.
Our adjusted precipitation for elevations below 1350 ma.s.l. is up to 20% lower than in seNorge. This is in agreement with other studies finding seNorge precipitation too high compared with observed snow measurements (Reference StrandenStranden, 2010; Reference SalorantaSaloranta, 2012). An underestimation of precipitation at higher elevations (>1500 m a.s.l.) has also been found in a previous validation study comparing seNorge precipitation with winter mass-balance measurements at stake positions at various glaciers (Reference Engelhardt, Schuler and AndreassenEngelhardt and others, 2012). Locally adjusted precipitation gradients would certainly show significant spatial and temporal heterogeneity. The study of Reference Machguth, Purves, Oerlemans, Hoelzle and PaulMachguth and others (2008) found that modeled glacier mass balance is most sensitive to uncertainties in precipitation data. Therefore, the constant correction of the precipitation gradients might not be appropriate in some regions. However, the aim of the gradient adjustment in our case was to find an average precipitation correction suitable for all glacierized areas of the country and for the whole model period.
We used a spatially uniform and temporally constant parameter set of melt and precipitation factors to reproduce seasonal mass balances for Norway. Using parameters calibrated for each year individually would certainly improve the model results as melt depends on the full energy balance and the single relation of temperature and melt rate varies over time (Reference Huss, Funk and OhmuraHuss and others, 2009). Since, in our case, data availability differs strongly from year to year, such an approach would reflect not only the temporal but also the spatial variability of the parameters. In order to take the different data availability into consideration, we use an annual weighting factor depending on the area of observations of each year. With the derived parameter set we can reproduce the seasonal mass balances to within 0.25 m w.e. a–1 for the years of validation, which corresponds to a relative uncertainty of 10% of the seasonal balances. However, for individual glaciers the bias of annual mass balances can be quite high (+0.35m w.e. a–1 for Nigards-breen; Fig. 6b) or, as in the case of Storbreen, show an increasing trend for larger winter balances. For small glaciers in particular, local conditions cannot be resolved and the results should be treated as a general picture for the glacierized area of Norway.
The modeled increase of winter mass balance between 1960 and 2000 reflects the measured increase in winter precipitation in Norway (Reference Hanssen-Bauer and NordliHanssen-Bauer and Nordli, 1998). This increase was most pronounced in western Norway, which led to a readvance of various maritime glaciers (Reference Andreassen, Elverøy, Kjøllmoen, Engeset and HaakensenAndreassen and others, 2005). A similar readvance of glaciers was observed in New Zealand between 1980 and 2000 (Reference Chinn, Winkler, Salinger and HaakensenChinn and others, 2005). However, this was in contrast to the global trend showing negative mass balance and associated glacier retreat for most glaciers over this period (Reference Haeberli and BenistonHaeberli and Beniston, 1998; Reference OerlemansOerlemans, 2005).
Conclusion
Driven by seNorge data, our calibrated model provides for the first time homogeneous and complete time series of seasonal glacier mass balances at high spatial and temporal resolution for all of mainland Norway. This approach is useful to give an overview of both temporal and spatial variability of glacier mass balance since glacier monitoring covers only a small part of the glacierized area and has irregular temporal coverage. The results may be used to assess spatial patterns of mass balance in the present and past and may also contribute to hydrological applications. For smaller regions, locally adjusted parameter sets may be more appropriate. Modeled specific seasonal and annual glacier mass balances for Norway from 1961 to 2010 reveal that although year-to-year variability is high, there were positive trends of winter and net balance between 1961 and 2000. Since 2000 a remarkable decrease in both summer and winter mass balance has occurred. The resulting net mass balance of close to –1m w.e. a–1 for the first decade of the 21st century might only be a glimpse of what can be expected for thefuture.
Acknowledgements
This publication is contribution No. 8 of the Nordic Center of Excellence SVALI, ‘Stability and Variations of Arctic Land Ice’, funded by the Nordic Top-level Research Initiative (TRI). We thank the glacier group of NVE for providing stake data, Matthias Mohr of the Norwegian Meteorological Institute for providing further information about seNorge, and all staff of NVE and Statkraft who contributed in collecting and providing data for this study. We also thank Scientific Editor Matthias Huss and Daniel Farinotti and Bernhard Hynek for careful reviews, which significantly improved the paper. Helpful comments by Gwenn Flowers are also gratefully acknowledged.



