


1. Introduction
This article explores the role of token frequency in conditioning optional paradigm uniformity in Japanese voiced velar nasalisation (henceforth simply nasalisation). We begin with a review of the salient findings of Breiss et al.’s (Reference Breiss, Katsuda and Kawahara2022) corpus study of Yamanote Japanese, where the probability of nasalisation is influenced by overall compound frequency, the frequency of the second element (N2) and, unexpectedly, the total number of mora in the compound. We then report two wug-tests with speakers of the phonologically conservative Tōhoku dialect of Japanese (spoken in northern parts of the main island of Japan). The first experiment demonstrates that the frequency-conditioning observed in corpus data is reproduced in existing and novel compounds and holds at the level of the individual speaker. The second experiment focuses specifically on whether, after controlling for frequency, overall compound length influences nasalisation, and finds that it does not, instead revealing sensitivity to only the size of N2, regardless of the size of N1 (the first element in the compound). We conclude by discussing the implications of these findings for existing theories of token frequency in the grammar.
1.1. Token frequency and phonological patterns
The influence of lexical frequency on phonological patterning has been much debated in the literature. In the classic generative tradition, frequencies – or statistical information in general – are considered to lie outside of grammatical competence, as argued, for example, in Chomsky’s (Reference Chomsky1957) Syntactic Structures. The classic argument given in that book was that the transitional probability in English from fragile to whale is plausibly zero, but a sentence containing this sequence is not therefore ungrammatical. The Sound Pattern of English (SPE; Chomsky & Halle Reference Chomsky and Halle1968) and much subsequent work that followed its tradition did not seriously consider the effects of lexical frequency or other statistical information on phonological patterns either (Coetzee & Kawahara Reference Coetzee and Kawahara2013). Phonological rules, as formulated in the SPE style, were not sensitive to usage frequencies. More generally, effects related to statistical information, including usage frequency were, implicitly or explicitly, considered to be a matter of performance and not competence (Newmeyer Reference Newmeyer2003; see the reviews presented in Coetzee & Kawahara Reference Coetzee and Kawahara2013 and Shaw & Kawahara Reference Shaw and Kawahara2018).
On the other hand, there was a recurrent observation that, for example, deletion of a phonological segment is more likely in frequent words than in infrequent words (Bybee Reference Bybee, Darnell, Moravcsik, Noonan, Newmeyer and Wheatley1999). This observation was made as early as Hooper (Reference Hooper1976), who observed that schwa is more likely to be deleted in frequent words like memory than in infrequent but phonologically similar words like mammary. A perhaps more well-studied phenomenon is [t/d]-deletion in English, which is very common in frequent words like and and list, but not as very common in less frequent words like mast or jest (Coetzee & Kawahara Reference Coetzee and Kawahara2013). Likewise, the experiment by Kawahara (Reference Kawahara2011) demonstrates that OCP-induced geminate devoicing in Japanese loanwords is judged to be more natural in words with higher lexical frequencies. File-Muriel (Reference File-Muriel2009) argues that in some dialects of Spanish, weakening of /s/ is more likely in high-frequency words than in low-frequency words. Zuraw (Reference Zuraw2007) examines frequency-conditioned application of markedness-reducing phonological processes in a corpus of written Tagalog and finds higher rates of repair within higher-frequency units (words, clitic groups, etc.), subject to the markedness principles of the language.
Lexical frequency has also been found to be related to the degree to which a lexical item deviates from grammar-wide trends in phonological alternations. Smith & Moore-Cantwell (Reference Smith and Moore-Cantwell2017) found that higher-frequency comparative constructions are more likely to flout grammar-wide trends driven by markedness. For example, the adjective likely itself forms the analytic comparative more likely more than 99% of the time, while lower-frequency phonologically comparable forms take the analytic comparative only around 45% of the time. In a similar vein, Anttila (Reference Anttila2006) and Mayer (Reference Mayer2021) found that higher-frequency morphologically complex forms were more likely to behave opaquely with respect to grammar-wide phonological processes.
These cases show that lexical frequency interacts with phonological patterns to a non-negligible degree, and any adequate theory of phonology must have a means to model its effects. In usage-based phonology (Bybee Reference Bybee, Darnell, Moravcsik, Noonan, Newmeyer and Wheatley1999) as well as exemplar-theoretic phonology (Gahl & Yu Reference Gahl and Yu2006), usage frequency is directly encoded in grammatical models. In the generative tradition, too, Coetzee & Kawahara (Reference Coetzee and Kawahara2013) argue that it is necessary – and possible – to incorporate the effects of lexical frequency in the formal phonological grammar. Whether, and to what extent, lexical frequencies affect phonological patterns, and which aspects of phonological patterns are (un)affected, all remain important questions in current phonological research. In this article, we provide experimental data bearing on this question and discuss how different contemporary generative models of lexicon–phonology interaction might model the role lexical token frequency has on conditioning nasalisation in both existing and novel compounds.
2. Voiced velar nasalisation
2.1. The basic patterns
In many phonologically conservative dialects of Japanese, [ŋ] and [g] are allophonically distributed; here, we summarise the generalisations in the literature about the Yamanote dialect, a classic and conservative speaking style of the dialect spoken in the centre of Tokyo (see Hibiya Reference Hibiya1995 for more on the sociolinguistic significance of nasalisation). In dialects that exhibit nasalisation, /g/ is realised as [ŋ] in prosodic-word-medial position, as in /kagami/ [kaŋami] ‘mirror’ vs. /gimu/ [gimu] ‘obligation’.
This complementary distribution has been discussed extensively in the generative and pre-generative literature on Japanese phonology (e.g., Kindaichi [1942] Reference Kindaichi1967; Trubetzkoy [1939] Reference Trubetzkoy1969; Labrune Reference Labrune2012). Although properly a static phonotactic restriction, the prominence of compounding in Japanese word-formation means that there are many contexts where the same morpheme can surface both on its own, with initial [g], and as the second member (N2) of a compound, with initial [ŋ]. Thus, there is ample opportunity to study the status of the phonotactic restriction in the synchronic grammar via the alternation it induces, as in (1)–(3). It is in this context that Ito & Mester (Reference Ito, Mester and Roca1996, Reference Ito and Mester2003) treat the phenomenon; in the latter work, they formalise a constraint-based analysis of the alternation observed in compounds. Most relevant for the current article, they highlight the optionality of the alternation in cases where the second member of the compound is also a free-standing word, as illustrated by the examples in (1)–(3).


The gist of their analysis is that the optionality is the result of two competing forces acting on the realisation of a /g/-initial N2: (1) a paradigm uniformity effect favouring faithfulness to its base form (Steriade Reference Steriade, Broe and Pierrehumbert2000), which prefers [g] to [ŋ] and (2) a markedness constraint that drives nasalisation in intervocalic positions, favouring [ŋ] over [g]. This analysis captures both the variability of compounds with free N2s and also the obligatoriness of nasalisation when N2 is a bound morpheme, as in cases like (4).

2.2. The corpus study of Breiss et al. (Reference Breiss, Katsuda and Kawahara2022)
Breiss et al. (Reference Breiss, Katsuda and Kawahara2022) carried out a quantitative investigation of the variability and optionality of nasalisation noted by Ito & Mester (Reference Ito, Mester and Roca1996). We reproduce their quantitative analysis here, but refer the interested reader to the full text for a more detailed treatment.
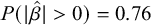
The data for the analysis were drawn from the NHK pronunciation and accent dictionary (NHK Broadcasting Culture Research Institute 2016), which represents a consensus view of expert dialectologists about normative pronunciation in the Yamanote dialect, and were annotated with frequency information from the Balanced Corpus of Contemporary Written Japanese (BCCWJ; Maekawa et al. Reference Maekawa, Yamazaki, Ogiso, Maruyama, Ogura, Kashino, Koiso, Yamaguchi, Tanaka and Den2014). Figure 1 plots the number of words whose pronunciation was labelled as ‘undergoing’ or ‘preferring to undergo’ nasalisation in the dictionary, divided into whether the N2s were bound morphemes (left panel) or free-standing morphemes (right panel).Footnote 1
Division of the corpus of compounds according to whether a given compound undergoes (or prefers to undergo) nasalisation or not (horizontal axis), divided by whether or not N2 is able to occur as a free form (panels). The vertical axis plots the number of unique compounds in each category.

The data in the left panel show that bound morphemes invariably undergo nasalisation. The data in the right panel support the claim of optionality in cases of a free-standing N2, offering quantitative evidence supporting Ito & Mester (Reference Ito, Mester and Roca1996).
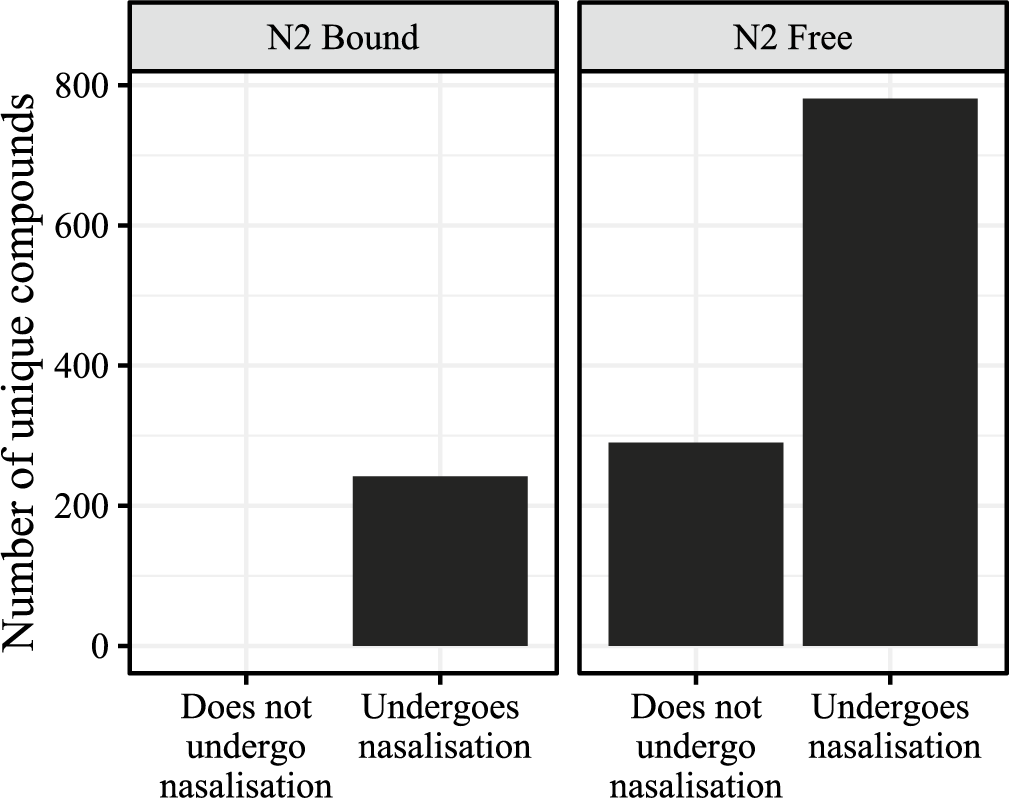
Turning next to the determinants of variation in compounds with free N2s, Breiss et al. (Reference Breiss, Katsuda and Kawahara2022) found the frequency of the whole compound and its second member to both be reliable predictors of whether a given compound would undergo nasalisation in dictionary data. These data are plotted in Figure 2. The left panel shows that more frequent compounds are more likely to show nasalisation; the right panel shows, on the other hand, that compounds with more frequent N2s are less likely to show nasalisation.
The effects of whole compound frequency (left panel) and N2 frequency (right panel) on the probability of nasalisation, with binomial smooths. One dot represents one lexical item; vertical jitter has been added for readability.

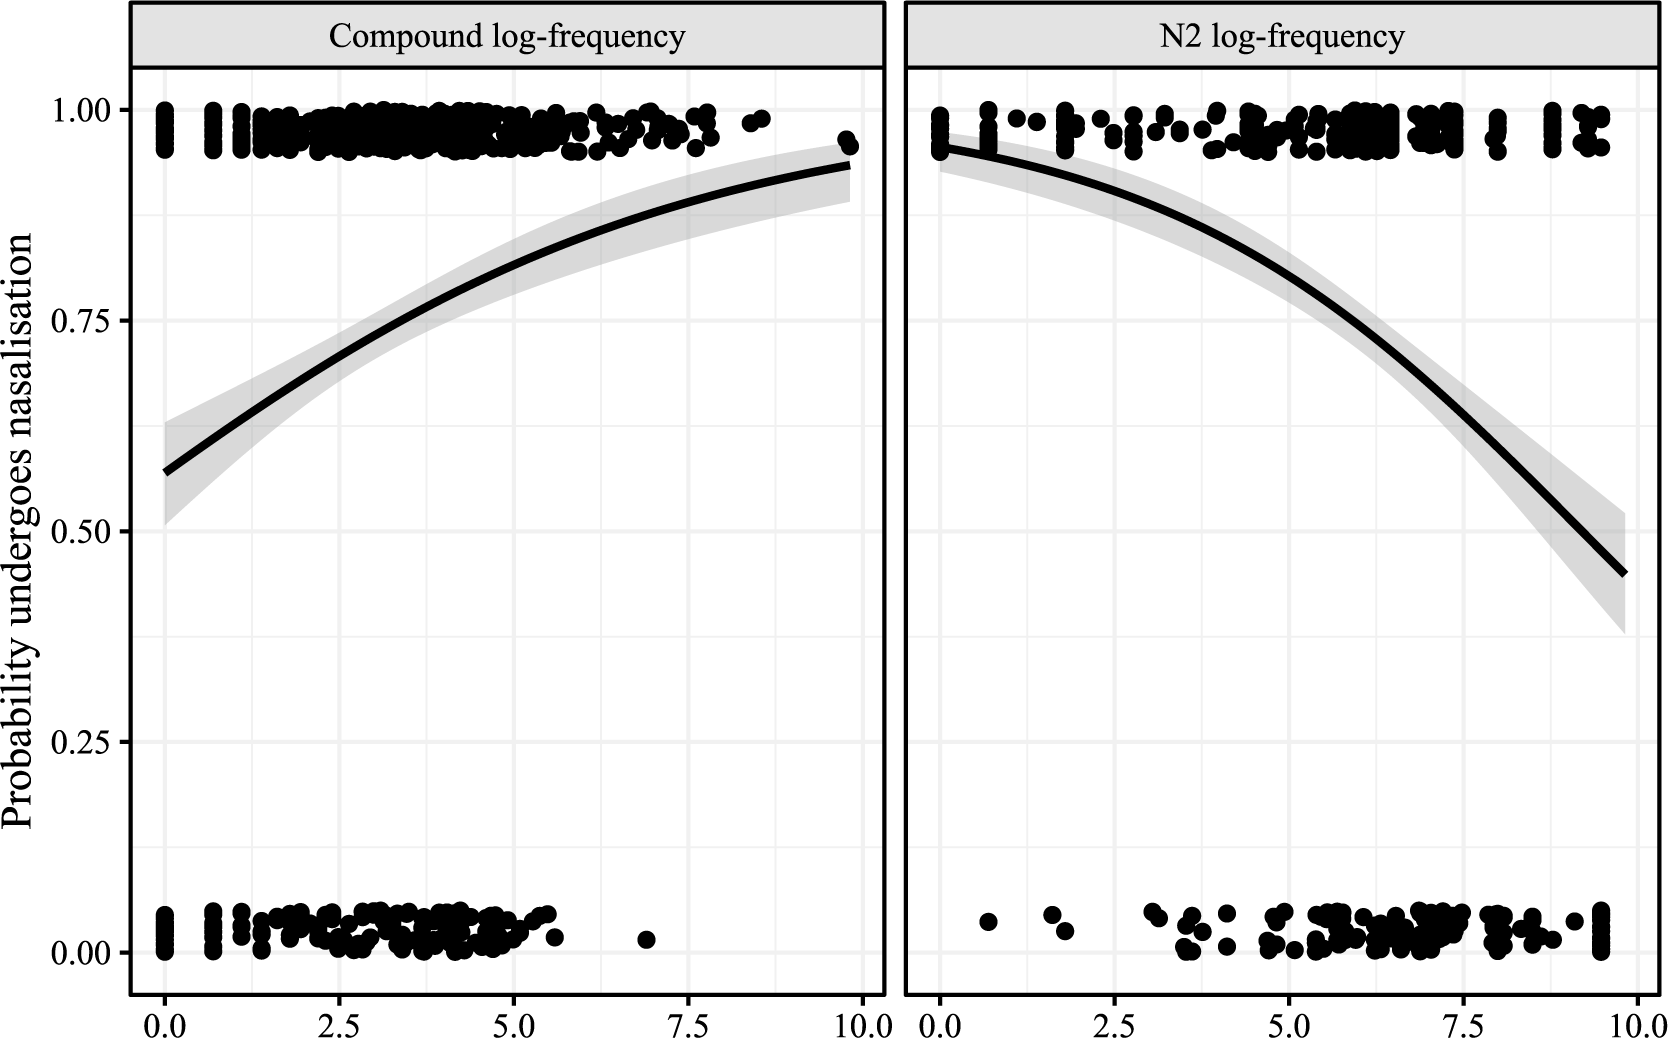
Breiss et al. also found that the prosodic length of a compound was strongly related to whether it underwent nasalisation, with shorter compounds being more likely to undergo, and longer compounds being more resistant to alternation. Figure 3 plots these findings.
The effects of compound length in mora on the probability of nasalisation in the corpus study of Breiss et al. (Reference Breiss, Katsuda and Kawahara2022), reproduced with slightly different axis labels for consistency.

Taken at face value, these data suggest that the synchronic grammar of the Yamanote dialect of Japanese exhibits a dependency between global prosodic length and a local segmental alternation, which flies in the face of an often-cited claim that ‘phonology doesn’t count’ (McCarthy & Prince [1986] Reference McCarthy and Prince1996 among many others). Though this is not as ironclad a generalisation as it is often assumed to be (see, in particular, the arguments and data presented in Paster Reference Paster2019), the trend in Figure 3 is striking, with few typological parallels noted in the literature.Footnote 2 An alternative explanation not explored by Breiss et al., however, is that this relationship is illusory, a function of Zipf’s (Reference Zipf1935) Law of Abbreviation. This law states that ‘the magnitude of words stands in an inverse (not necessarily proportionate) relationship to the number of occurrences’ (Zipf Reference Zipf1935: 23); that is, more frequent words tend to be shorter. If we assume that this relationship also governs compounds in the Japanese lexicon, we would expect to find the pattern shown in Figure 3, where compounds appear both shorter and more likely to undergo nasalisation, both stemming from their high frequency.
As with all analyses of existing lexical items relying on corpus data, it is not clear how much evidence these data can provide about the synchronic grammars of speakers of such conservative dialects, and whether the frequency effects (functionally motivated) or the apparent length effect (typologically very unusual) are in fact cognitively represented as such. Resolving these questions is of critical importance to how we construct our phonological theories, including whether (and if so, how) the usage frequency of morphemes affects the synchronic grammar.
3. Experiment 1
3.1. Aims
Our first experiment has three empirical goals. The first is to determine whether the optionality of paradigm uniformity in existing compounds found in the corpus is operative at the level of the individual speaker. This is an important methodological point that is hard to resolve in corpus-based studies of variation, including Breiss et al. (Reference Breiss, Katsuda and Kawahara2022), because it is possible that apparently non-categorical patterns in a corpus actually result from collapsing across different speakers with different categorical grammars.Footnote 3 The second goal is to see whether the frequency-conditioning of this variability is also active at the speaker level. The third goal is to see whether the frequency effect extends to novel compounds composed of existing morphemes of varying frequencies, or whether it is limited to whole forms which the speakers might plausibly have stored in their mental lexicon.
The status of novel compounds is of great relevance for distinguishing between phonological theories of frequency effects: The UseListed theory of Zuraw (Reference Zuraw2000) holds that effects of frequency in phonology, such as those discussed in §1, can be explained as competition between two routes of processing: whole-word retrieval and in-the-moment grammatical assembly. The data from existing compounds are compatible with this architecture, but also with one where the workings of the phonological grammar itself are influenced by frequency. Novel compounds are an important testing ground for theories that put frequency in the lexicon, and finding an effect of N2 frequency in modulating nasalisation in these forms would indicate that the phonological grammar itself is sensitive to the lexical frequency of the items in manipulates, as Coetzee & Kawahara (Reference Coetzee and Kawahara2013) and Coetzee (Reference Coetzee2016) have suggested.
Finally, the experiment included a priming manipulation, designed to probe whether characteristics of the lexical entry other than frequency might impact their phonological behaviour. Breiss (Reference Breiss2021) found in several experiments on English derivational morphology that priming non-local paradigm members influenced the way that novel derivatives were formed; for example, a novel derivative in -able based on the stem lábor was more likely to be pronounced labórable, with stress on the second syllable, when the form labórious, with matching stress placement, was primed. Breiss (Reference Breiss2021) implemented the manipulation by performing a vocabulary check with a random subset of non-local paradigm members (like labórious) before the main task of -able-formation, with the rest after; thus, for any individual, half of the items were primed, and the other half were not. In this experiment, all but one of the participants completed two repetitions of the experiment, so on each of two runs, the participants saw one half of the items primed.
3.2. Methods
Supplementary material for this experiment, as well for Experiment 2, can be accessed at https://osf.io/avnpw/?view_only=cd2afdcc183f4de3ac1261b4af66f08d.
3.2.1. Stimuli
Stimuli for the experiment were 301 compounds, 81 of which were existing forms (largely drawn from the corpus used in Breiss et al. Reference Breiss, Katsuda and Kawahara2022), and the rest of which were novel. The complete list of stimuli is available in the supplementary material. The existing compounds were selected to represent a range of nasalisation probabilities, based on the frequency of the whole compound and that of the N2. Because of the challenges in controlling length and morphological composition, there was variation in these aspects among the existing compounds. Specifically, their lengths ranged from 2 to 8 moras in total, and certain compound members were multimorphemic (e.g., in /kagaku/ + /giʒutsu/ ‘science and technology’; both N1 and N2 are bimorphemic: /ka+gaku/ ‘science’, /gi+ʒutsu/) ‘technology’). Existing compounds were all formed with /g/-initial N2s. The novel compounds were formed by combining six bimoraic N1s (e.g., /d͡ʒuu/ ‘heavy, multiple’, /tei/ ‘low’) with 30 bimoraic N2s (e.g., /gin/ ‘silver’, /gjaku/ ‘reverse’), with the N2s selected to be of varying frequencies. Examples of novel compounds are /d͡ʒuugin/ (/d͡ʒuu/ ‘heavy, multiple’ + /gin/ ‘silver’) and /toogan/ (/too/ ‘Chinese’ + /gan/ ‘wild goose’). Due to the difficulty of finding enough monomorphemic N2s, 10 out of the 30 N2s were bimorphemic (e.g., /ge+ta/ ‘wooden clogs’, /go+ma/ ‘sesame’). The study also included 40 novel compounds whose N2 was /k/-initial, in order to examine the synchronic status of the opaque interaction of nasalisation with rendaku (on which see the extensive discussion in Ito & Mester Reference Ito, Mester and Roca1996, Reference Ito and Mester2003). These results are not reported here and are thus not discussed further; the data reported for novel compounds in this article are the result of 180 distinct novel compounds with a /g/-initial N2.
3.2.2. Participants
We recruited 20 speakers of the Tōhoku dialect of Japanese by word of mouth and snowball sampling to participate in the experiment. We chose to examine the Tōhoku dialect because most (if not all) of the speakers of the Yamanote dialect documented in the literature and reflected in the NHK dictionary are no longer living, or were judged unlikely to be able to participate in an online experiment. The Tōhoku dialect, spoken in northern parts of the main land of Japan, is also phonologically conservative and has been documented as also exhibiting the voiced velar nasalisation alteration. We should nevertheless bear in mind that the Tōhoku dialect is distinct from the Yamanote dialect that was analysed by Breiss et al. (Reference Breiss, Katsuda and Kawahara2022).
All participants completed a short dialect questionnaire, which used existing monomorphemes to determine whether the speaker enforced the complementary distribution of [g] and [ŋ] – the phonotactic restriction which drives the alternation in compounds. If the speaker did not, they were not invited to continue to the experimental task. Of the 20 interviewed, eight met this criterion.Footnote 4 As two of the three goals of the experiment (see §3.1) address questions at the level of the individual speaker’s grammar, all but one person (Speaker 7) participated in the experiment in two separate rounds, each separated by a period of a few weeks to several months. The two different rounds counterbalanced stimulus randomisation orders, and also which N2s were primed (on which see §3.2.3). The participants were paid approximately $20 USD per experimental session.
3.2.3. Procedure
The format of the experiment was an elicited production task; participants were presented with a series of forms in a PowerPoint presentation and were asked to produce them aloud. All of the experimental sessions were carried out over Zoom by the second author and were recorded for posterity. As the participant carried out the production task, the second author coded based on auditory impression whether [ŋ] or [g] was produced on a given trial. The decision was usually clear-cut for the experimenter, who is a phonetically trained linguist and also a native speaker of Japanese. In cases of uncertainty, tokens were coded based on visual inspection of a spectrogram: tokens involving clear striations for bursts were coded as [g], while ones without them were coded as [ŋ]. The present study does not address the question of phonetic gradience in the implementation of nasalisation, as to the best of our knowledge, no studies have demonstrated gradience in the nasalisation process; future analysis of the recorded data, however, may yield insight into these questions. Here, we follow the practice in the sociolinguistic (Hibiya Reference Hibiya1995) and phonological literature (cited above) and treat nasalisation as a binary reflection of the intended outcome of the speaker’s grammar.
Each recording session proceeded in the following way: first, participants were given the dialect questionnaire; if they showed complementary distribution of [g] and [ŋ], they proceeded to the main task. In the main task, participants completed a preliminary vocabulary familiarity survey before producing compound forms, and a post-hoc vocabulary familiarity survey after producing all the compounds. In each vocabulary survey, participants were asked to produce one of the existing compounds or one of the N2s out loud, and indicate how familiar they were with the word on a 5-point Likert scale (5 = ‘extremely familiar’, 1 = ‘I don’t know this word’).
As noted in §3.1, we took advantage of the two experimental sessions with each participant to examine what effect priming an N2 might have on whether it exhibits nasalisation when produced in a compound. All of the existing compounds included as stimuli were always in the post-hoc vocabulary survey, while the N2s were distributed around the compound-production task such that each participant saw one set of N2s before the compound-production task and the other after. In participants who participated in the experiment twice (all but one of them), the N2s primed were varied between sessions.
In the compound-production task itself, which is of primary interest, participants were asked to simply read aloud compounds followed by a semantically neutral sentence-ending particle. These compounds, a mix of novel and existing forms, were presented in random order. All compounds were presented in kanji characters, which do not distinguish between [g] and [ŋ]. Thus, we can infer that the forms the speakers produced (with [g] or [ŋ]) are minimally biased by the experimental setup.
3.3. Statistical analyses
After the data collection was complete, each compound member was classified as to whether it was known to the speaker (familiarity score
 $>$
1) or not (familiarity score = 1). Then, for each speaker, compounds with unknown N2s were excluded. This allows us to make inferences about the phonological grammar at the level of the speaker, rather than simply assuming that all speakers know all words. All data and scripts are available in the supplementary materials of this article, available at the OSF repository linked at the beginning of §3.2.
$>$
1) or not (familiarity score = 1). Then, for each speaker, compounds with unknown N2s were excluded. This allows us to make inferences about the phonological grammar at the level of the speaker, rather than simply assuming that all speakers know all words. All data and scripts are available in the supplementary materials of this article, available at the OSF repository linked at the beginning of §3.2.
Statistical analyses were carried out using Bayesian mixed-effects logistic regression models implemented in the brms package (Bürkner Reference Bürkner2017) using the R programming environment (R Core Team 2021). There are several advantages of Bayesian models as opposed to frequentist (non-Bayesian) ones, which we summarise only briefly here. First, rather than focusing on hypothesis testing, the results of our Bayesian regression models can be interpreted as directly reflecting the distributions of likely values for each parameter. Second, it is known that Bayesian models are more likely to converge than corresponding frequentist linear mixed-effects models, and the latter have particular difficulty achieving convergence with when the model has a complex random effect structure, as is the case here. In a Bayesian model, we formalise our prior knowledge or expectations (if any) about the values of the parameters we are interested in using statistical distributions, and then knit it together with the evidence from the data, producing a posterior distribution of values for our parameters of interest that are a compromise between our priors and our data. This posterior distribution is the object which we mine for analytic insights. For more comprehensive tutorial introductions to Bayesian data analysis applied to linguistic and related subject material, see Kruschke (Reference Kruschke2014) and Vasishth et al. (Reference Vasishth, Nicenboim, Beckman, Li and Kong2018); for a primer on the brms package specifically in a linguistic context, see Nalborczyk et al. (Reference Nalborczyk, Batailler, Lœvenbruck, Vilain and Bürkner2019).
In this article, we report two common metrics of the posterior distribution for model parameters of interest: the median and 95% credible interval (CI) which is presented as a bracketed range, and the probability of direction, notated
 $P(|\hat {\beta }|>0)$
. The first measure indicates the median posterior value of the parameter, and the range which encompasses the central 95% of likely values. The second measure can be taken as a way of assessing the amount of evidence we have in favour of any effect in the direction of the parameter coefficient, regardless of magnitude; this ranges from 0.5 (equal evidence for an effect in the direction of the parameter as in the opposite direction) to 1 (very strong evidence in favour of an effect in the direction of the parameter value).
$P(|\hat {\beta }|>0)$
. The first measure indicates the median posterior value of the parameter, and the range which encompasses the central 95% of likely values. The second measure can be taken as a way of assessing the amount of evidence we have in favour of any effect in the direction of the parameter coefficient, regardless of magnitude; this ranges from 0.5 (equal evidence for an effect in the direction of the parameter as in the opposite direction) to 1 (very strong evidence in favour of an effect in the direction of the parameter value).
Each model used as its dependent variable the realisation of the initial segment of N2 ([g] or [ŋ]), and contained fixed effects specified below and random intercepts for speaker and compound, with random slopes of all fixed effects by speaker and a random slope of priming (primed or not primed) by compound. The models used normal (0,1) priors on the intercept and coefficients; sensitivity analyses (Roos et al. Reference Roos, Martins, Held and Rue2015) revealed that no meaningful changes in inference were associated with a range of prior values, indicating that the data we collected were sufficiently informative that our prior beliefs about likely parameter values mattered only nominally; see the supplementary materials for details.
We pause here to draw attention to the fact that out of a desire to have enough types of real and novel compounds, spanning a range of frequencies, we were unable to make the existing compounds uniform in size, nor could we make either the existing or the novel compounds uniform in morphemic composition. Because we have no reason to believe these factors to be causally related to the propensity to undergo nasalisation, and on the basis of the second two authors’ native-speaker intuition that the bimorphemic compound members were much more salient as whole words than as compositions of their parts, we do not consider these as theoretical quantities of interest in our statistical or grammatical analysis. We expect the random intercept for compound included in all of the statistical models we fit to absorb any idiosyncrasy attributable to morphemic composition or length, treated as item-level quirks that need not hold from sample to sample, in the same way that idiosyncratic participant-level variation is absorbed by the random intercept for participant. Readers interested in investigating the causal link between nasalisation and these other factors for themselves may access the raw data in the supplementary materials.
3.4 Results
In what follows, we first visualise and qualitatively discuss the results of the experiment, then perform parameter estimation using a Bayesian model to confirm the statistical reliability of our observations.
3.4.1. Existing compounds
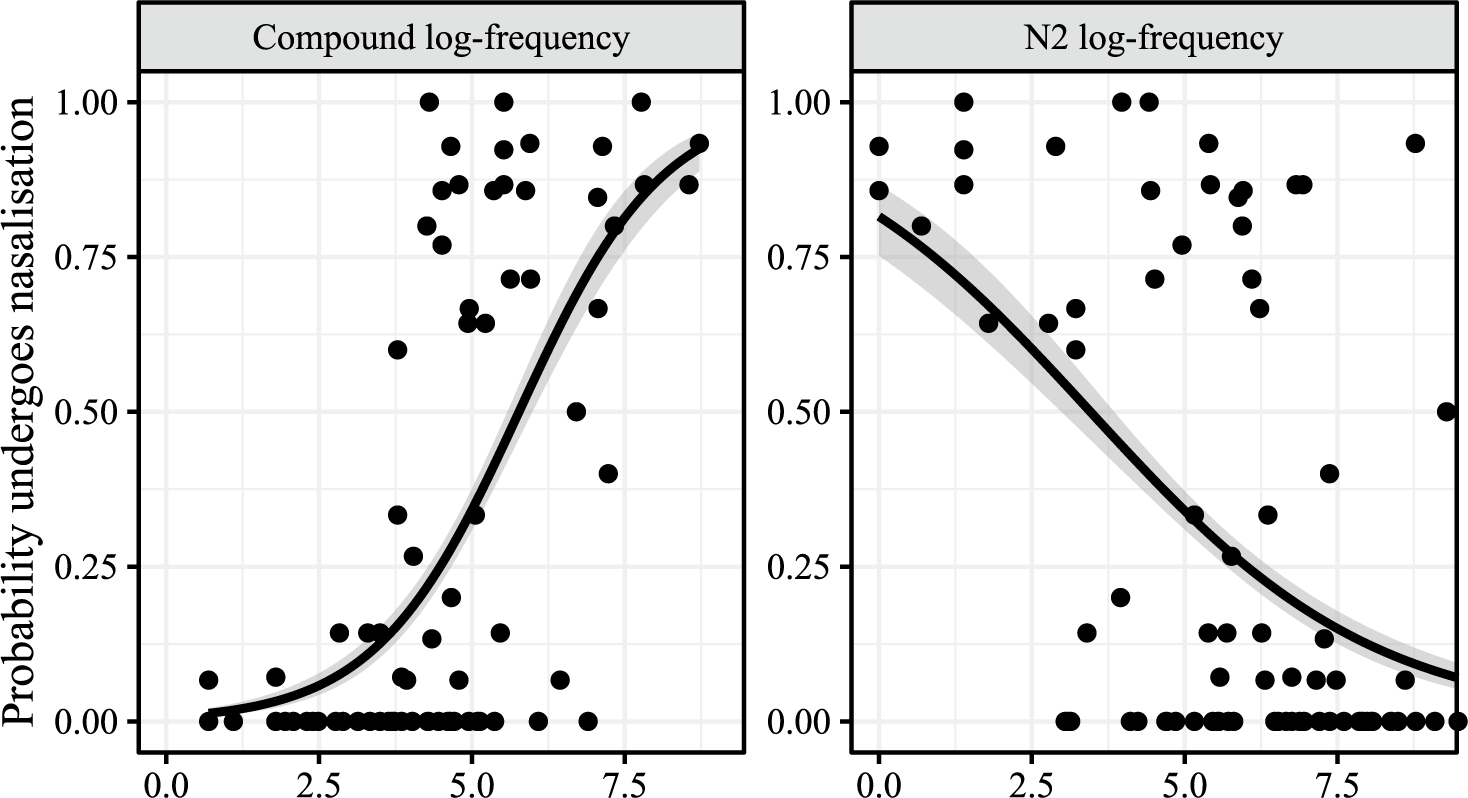
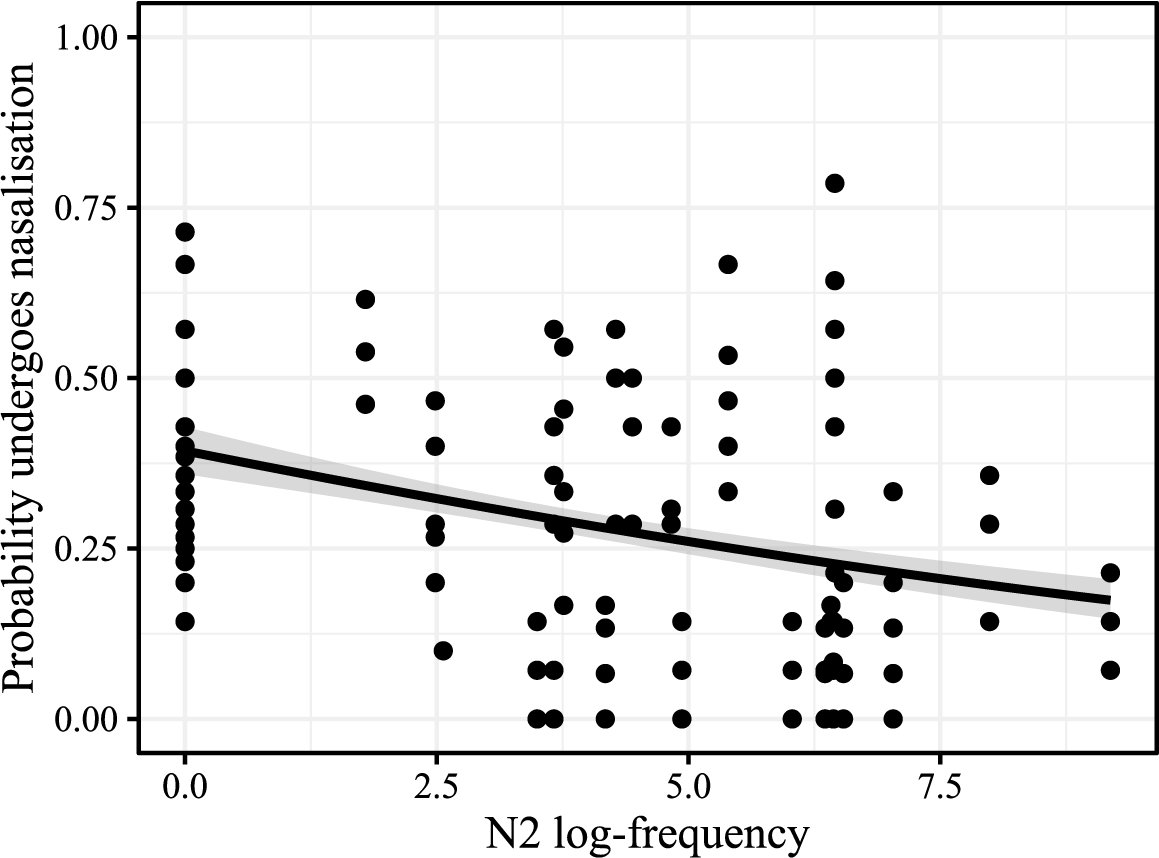
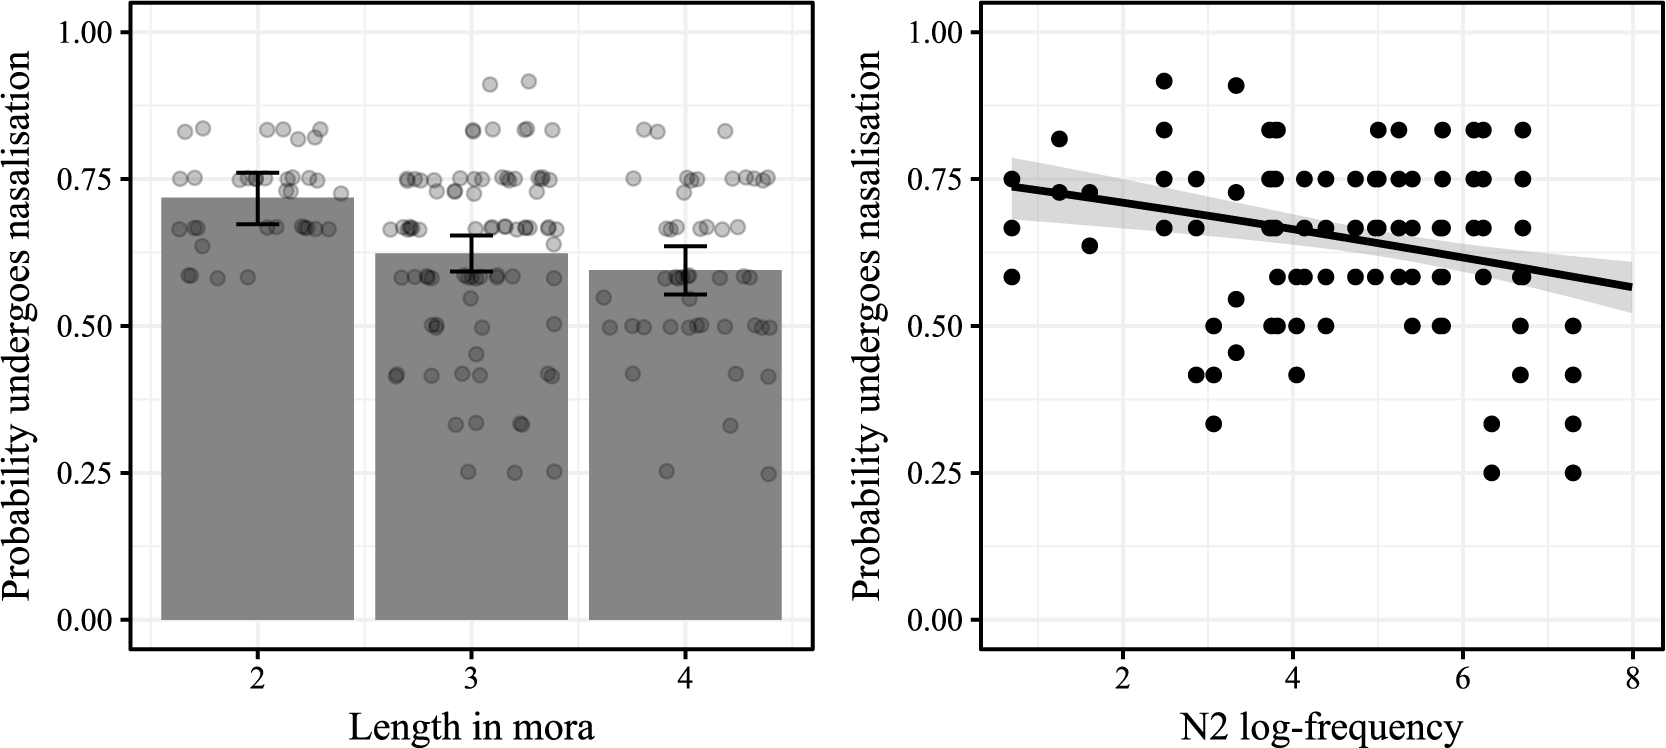
We first examine existing compounds with /g/-initial N2s and ask whether the token frequency of the compound or the N2 explains variation in nasalisation; this is plotted in Figure 4. Note that while Breiss et al. (Reference Breiss, Katsuda and Kawahara2022) considered relative frequency of the N2, here we consider the frequency of the N2 and compound in their own right. Finally, we use the natural logarithm of the token frequency, rather than its raw value, as is standard practice.
Probability of nasalisation (vertical axis) plotted against compound log-frequency (left facet) and N2 log-frequency (right facet), with binomial smooths.

We find that the frequency effect is robust, bearing out the spirit of the effect seen in the lexical analyses reported in Breiss et al. (Reference Breiss, Katsuda and Kawahara2022). As N2 frequency rises relative to a fixed value of compound frequency, the probability of an individual compound exhibiting nasalisation drops (Figure 4, right facet); holding N2 frequency steady while increasing the frequency of a compound from low to high also increases the probability of nasalisation (Figure 4, left facet).
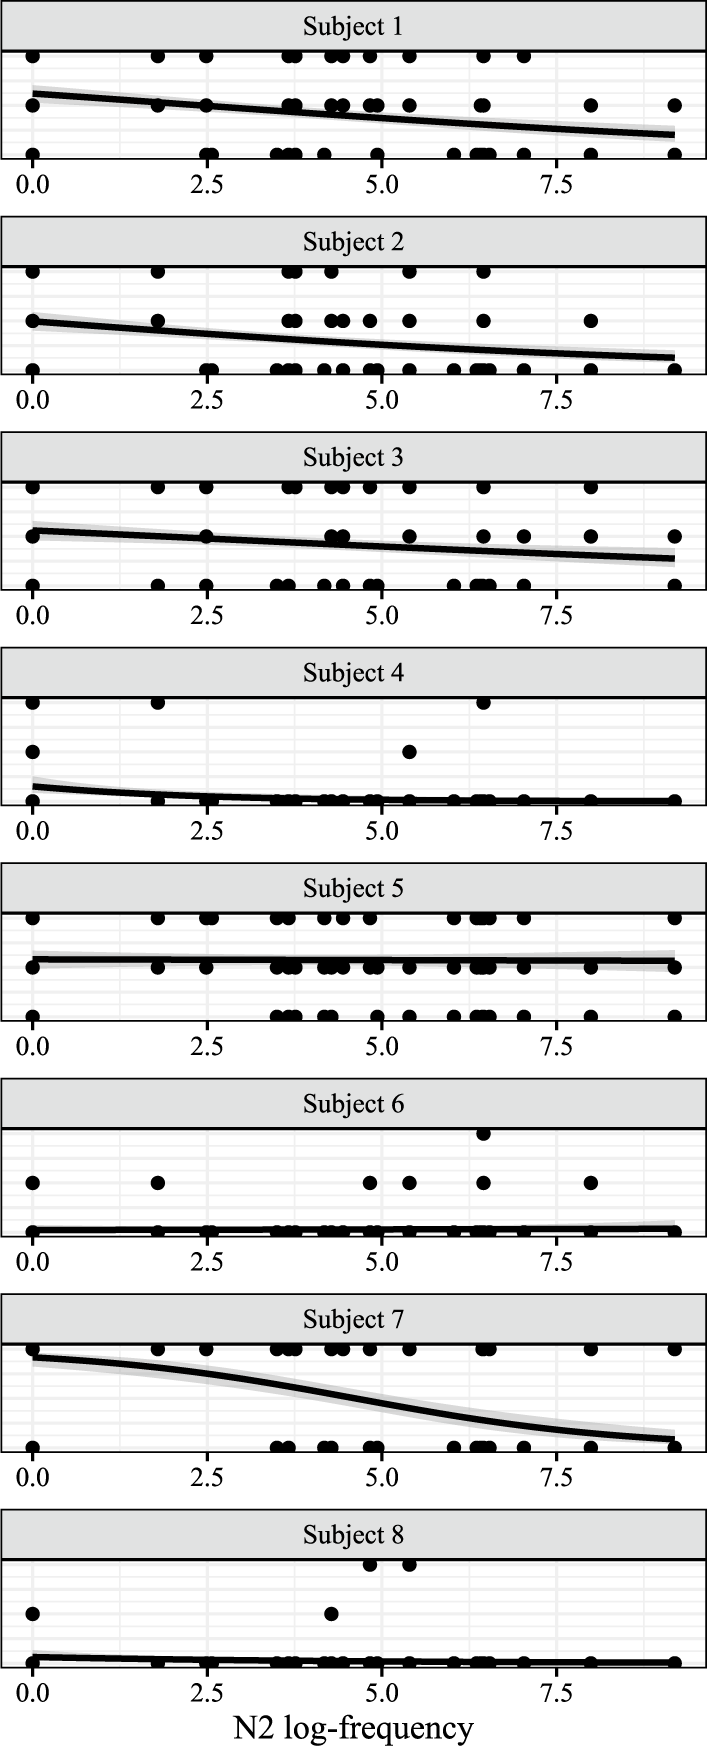
Having found that paradigm uniformity is conditioned by frequency in existing compounds at the group level, we now examine whether the conditioning holds at the level of the individual grammar, plotting each participant in their own row in Figure 5.
Probability of nasalisation (vertical axis) plotted against compound log-frequency (left facet) and N2 log-frequency (right facet) for each individual speaker (row), with binomial smooths.

On visual inspection, it seems clear that the effect does exist at the individual level, but may differ in strength between speakers. We return to this question with a quantitative eye when we discuss the statistical model fit to this data.
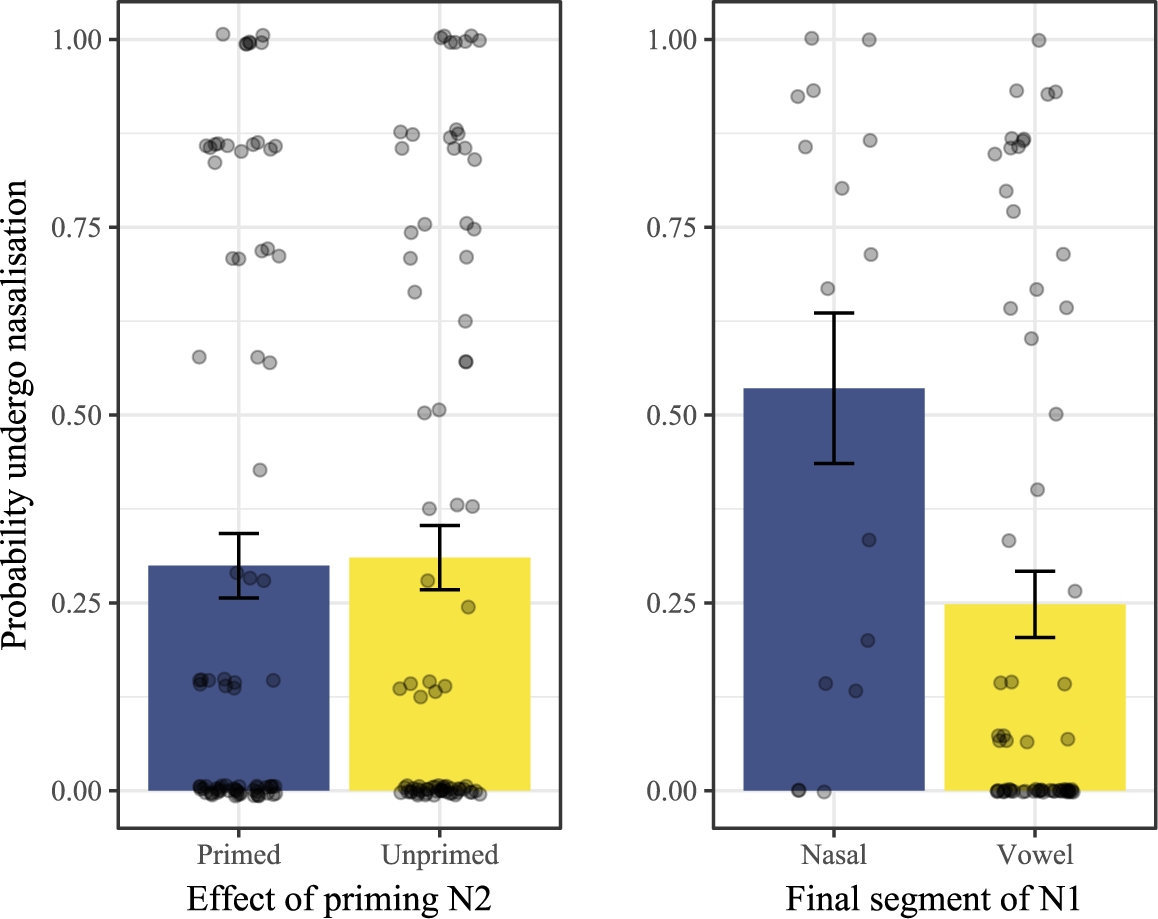
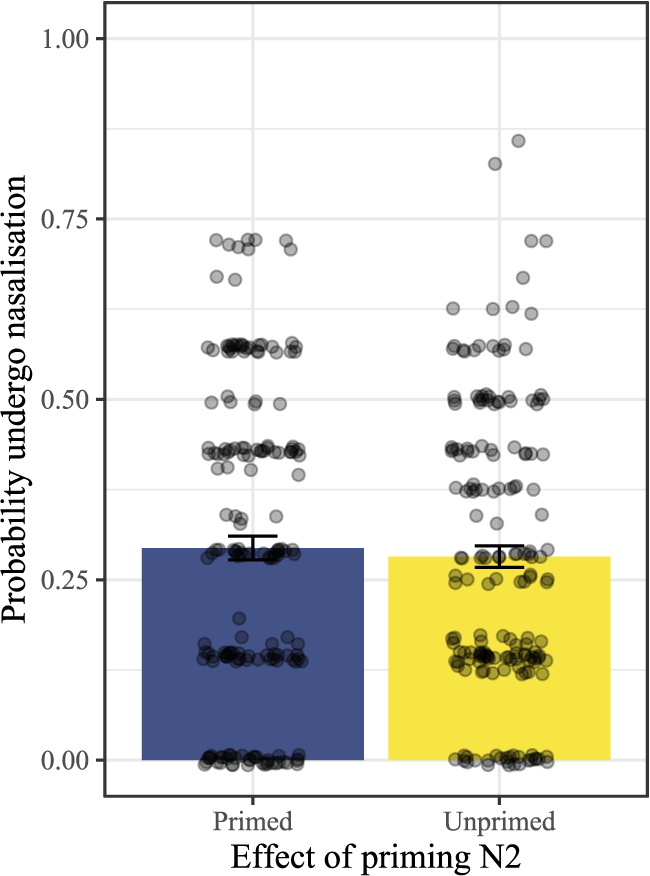
Before doing so, however, we report two null results in the set of existing compounds that we had expected to find based on the literature, namely, priming of N2 and OCP[nasal]. We had anticipated that priming N2 would impact the likelihood of nasalisation, based on the findings and rationale of Breiss (Reference Breiss2021), described in §3.2.3. However, priming seemed to have no meaningful effect on rates of nasalisation (left plot of Figure 6). Thus, we conclude that the experimental manipulation (placement of the N2 in the vocabulary check sequence) failed to influence the salience of the N2 in the lexicon of the participant in a way experimentally detectable in their behaviour on the production task. Though further research is needed to confirm, we suspect that the lack of a priming effect in this study was because the manipulation tried to target too many N2s at once, leading to a lack of concentrated activation on any particular item relative to the rest. This post-hoc account predicts that studies that try to prime fewer items (as was the case with Breiss Reference Breiss2021) should have a greater chance of estimating the effect of priming on the phonological grammar, but more targeted work on this topic is needed to better support this hypothesis.
Probability of nasalisation with standard error (vertical axis) plotted against priming of N2 (left) and final segment of N1 (right).

Second, we expected, based on the findings of Breiss et al. (Reference Breiss, Katsuda and Kawahara2022) in Japanese compounds and more broadly in Japanese phonology (Kawahara et al. Reference Kawahara, Ono and Sudo2006), to find a decrease in nasalisation in compounds whose N1s were nasal-final, so as to avoid creating a sequence of two nasals. We found the opposite trend in the experimental data, as shown in the right panel of Figure 6, but only superficially. Although the left bar is higher than the right bar, the uncertainty about this measure is also much larger, likely stemming from the relatively few compounds (
 $n=16$
) that have nasal-final N1s, and so the statistical model we fit does not suggest that the visual trend is to be trusted. Based on the conflicting evidence in the literature and this article, we make no strong conclusions about the interaction of OCP[nasal] and nasalisation in Japanese, and await more targeted experiments that address this question directly.
$n=16$
) that have nasal-final N1s, and so the statistical model we fit does not suggest that the visual trend is to be trusted. Based on the conflicting evidence in the literature and this article, we make no strong conclusions about the interaction of OCP[nasal] and nasalisation in Japanese, and await more targeted experiments that address this question directly.
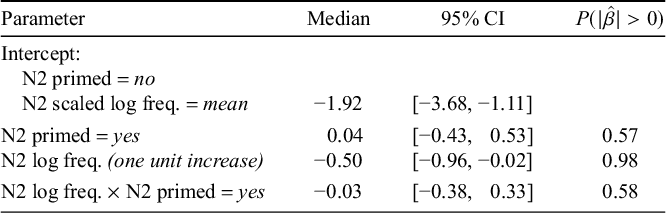
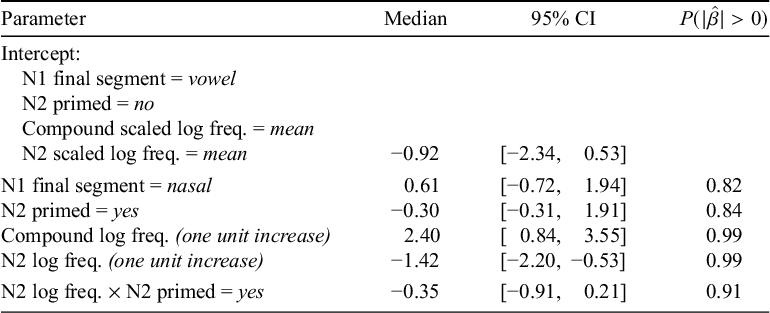
Table 1 presents the results of a Bayesian mixed-effects logistic regression model fit to determine the statistical robustness of the data patterns just reviewed. The model structure and random effects were as described in §3.3 and included fixed effects of the scaled log-frequency of the N2 and compound, whether N2 was primed, the interaction of priming with frequency of N2, and the nasality of the final segment of N1.
Model of existing compounds with free N2s. Coefficients are in log-odds, with positive signs indicating an increase in probability of nasalisation relative to the intercept.

We note that, relative to the intercept, a one-unit increase in compound log-frequency strongly increases the log-odds of the compound undergoing nasalisation, and a one-unit increase in N2 log-frequency decreases the log-odds of nasalisation. We judge this by the fact that the central 95% of credible values for the two frequency coefficients exclude zero. For all other fixed effects, the 95% CI does include zero, so we are less confident in attributing a meaningful effect on the data to these factors.
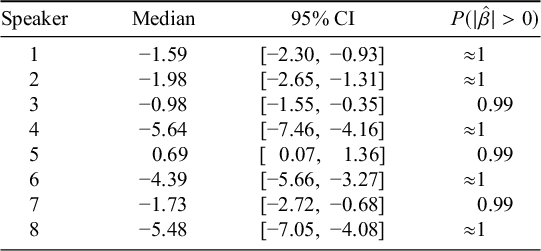
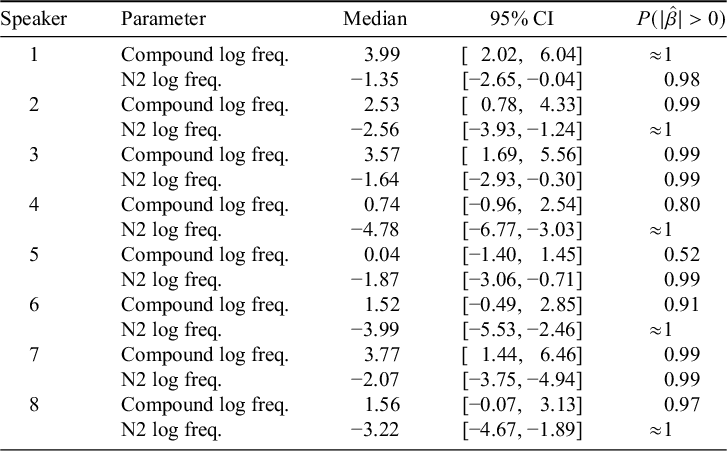
We estimate the speaker-specific parameter value for both compound and N2 frequency by examining samples extracted from the model; these are summarised in Table 2 using the same metrics as for the model in Table 1. For all participants, an increase in N2 frequency was associated with a decrease in nasalisation with greater than 99% probability. For compound frequency, an increase in frequency was associated with a decrease in nasalisation with greater than 90% confidence for six of eight speakers; for Speaker 4, the effect was less certain (80%); and only Speaker 5 truly exhibited no evidence for an influence of compound frequency on nasalisation rate (though this speaker did exhibit a strong influence of N2 frequency).
Summaries of individual-level estimates of the effect of the two frequency parameters derived from the model in Table 1.

Based on this evidence, we think it is reasonable to impute the frequency effect in existing compounds to the level of the individual grammar, though the factors influencing individual-level variation in effect size remain for future research.
3.4.2. Novel compounds
Turning to novel compounds, we find that the frequency effect holds here as well, though with a smaller magnitude. Figure 7 plots only N2 frequency; since the compound is entirely novel, its frequency is naturally zero. The downward-sloping smooth qualitatively matches the one found in the right panels of Figures 4 and 5.
The probability of undergoing nasalisation, plotted against N2 log-frequency (novel compounds), with a binomial smooth to aid readability.

Breaking this result out by individual in Figure 8, we find that visually there appears to be a wide range of variation in the strength of the effect across participants, though all but one go in the expected direction. We return to by-subject estimates from a fitted model below.
Probability of nasalisation (vertical axis) plotted against N2 log-frequency (horizontal axis) for each individual (row), with binomial smooths.

Finally, consistent with the null effect observed in the existing compounds, we found no strong evidence that priming the N2 influenced nasalisation in novel compounds; this is shown in Figure 9. Since none of the six N1s we selected for constructing the novel compounds were nasal-final, we were not able to evaluate the effect of OCP[nasal] in this subset of the data.
The probability of undergoing nasalisation with standard error (vertical axis) based on whether the N2 was primed (horizontal axis) in novel compounds.

The results of a Bayesian logistic regression model fit to the data for compounds with novel /g/-initial N2s are reported in Table 3.
Model of novel compounds with free N2s. Coefficients are in log-odds, with positive signs indicating an increase in probability of nasalisation relative to the intercept.
Consistent with the existing compounds, we find a strong effect of N2 log-frequency, with greater values inhibiting nasalisation. None of the other main effects were statistically reliable.
At the individual level, we find strong evidence for a frequency effect of N2 in all individuals; in all but one, the effect is as expected, with higher-frequency N2s forming compounds that are less likely to exhibit nasalisation. In one individual, Speaker 5, however, the effect is in the opposite direction; this is unexpected, and further puzzling because the same speaker exhibits a robust frequency effect of N2 in the expected direction in existing compounds (though no strong evidence for an effect of compound frequency in that data, interestingly). We have no explanation for this pattern, other than to note that the effect holds in all other participants; future work is needed to understand the factors that might yield different effects of frequency in different individuals (Table 4).
Summaries of individual-level estimates of the effect of the N2 frequency parameter derived from the model in Table 3.
3.4.3. Within-speaker consistency
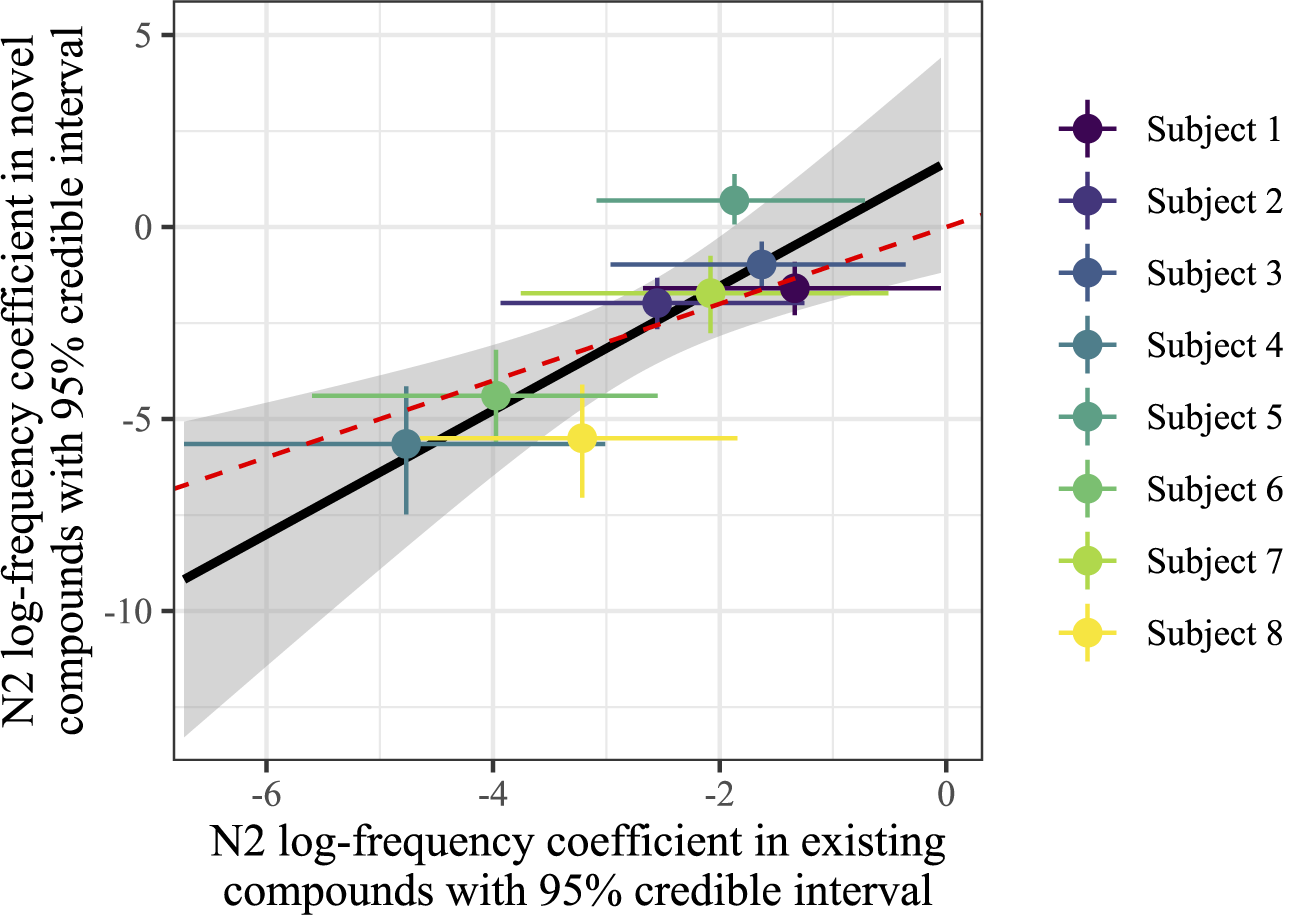
Finally, we examined within-speaker consistency in the frequency effect, comparing existing compounds to novel ones. If the frequency effect is active at the level of the individual speaker, it is reasonable to assume that some speakers might be more sensitive to or affected by frequency than others, and that this effect affects the treatment of existing and novel compounds by the phonological grammar. Figure 10 plots the coefficient of N2 frequency in novel compounds (vertical axis) against that of N2 frequency in existing compounds (horizontal axis); points represent the median value of the posterior, and the error bars encompass the 95% CI. A linear smooth is added for readability, and a red dashed line with slope 1 is provided for comparison.
The coefficient of N2 log-frequency in novel compounds, derived from the model in Table 1, is plotted on the horizontal axis, and the coefficient for N2 log-frequency in existing compounds, derived from the model summarised in Table 3, is plotted on the vertical axis. Points represent median values of the posterior; ranges encompass 95% CI; colours represent speakers; and a linear smooth has been added for readability, with the line of slope 1 intersecting the origin in dotted red.

While it is clear that individual speakers exhibit variation in how strongly they are affected by lexical frequency (note the differences of magnitude of the relevant median coefficient values in Tables 1 and 3), what is important to note here is that individuals are self-consistent in their variation: speakers who are more sensitive to N2 log-frequency in existing compounds are also more sensitive in novel compounds, and similarly for those that are less sensitive (Pearson’s
 $\rho = 0.86$
,
$\rho = 0.86$
,
 $p = 0.006$
). Further, we can qualitatively observe that the effect of frequency is of roughly the same magnitude across the two compound types, corresponding to the overlap between the grey smooth’s uncertainty and the red dashed line of identity in Figure 10. This suggests that however token frequency influences the phonological grammar, it does so indiscriminately, ignoring the phonological or morphological nature of the items themselves (here, existing vs. novel compounds).
$p = 0.006$
). Further, we can qualitatively observe that the effect of frequency is of roughly the same magnitude across the two compound types, corresponding to the overlap between the grey smooth’s uncertainty and the red dashed line of identity in Figure 10. This suggests that however token frequency influences the phonological grammar, it does so indiscriminately, ignoring the phonological or morphological nature of the items themselves (here, existing vs. novel compounds).
In summary, Experiment 1 demonstrates that the conditioning effect of both compound frequency and N2 frequency holds in productions of existing compounds, as suggested by the corpus analysis of Breiss et al. (Reference Breiss, Katsuda and Kawahara2022). It also demonstrates that the frequency conditioning holds at the level of the individual speaker, precluding an explanation of the variable pattern in terms of averaging across individual categorical grammars. Finally, and most importantly for the construction of phonological theories of lexicon–grammar interaction, it confirms that the frequency of N2 plays a role even in entirely novel compounds, indicating that the grammar must be sensitive to the lexical frequency of morphemes it manipulates.
4. Experiment 2
Experiment 2 complements the coverage of Experiment 1 by systematically varying the length of the compound (two, three or four moras) and the frequency of N2. It also more carefully controls for morphological composition, which was somewhat compromised in Experiment 1 in favour of having a greater range of frequencies and a sufficient number of stimuli. Recall that the goal of the length manipulation in Experiment 2 was to test the corpus pattern that suggested a relationship between overall compound size and propensity to nasalise, a possible case of phonology ‘counting’. Although Jiang (Reference Jiang2023b) carried out a similar test of the relationship between nasalisation and compound size and found that it did not generalise to novel compounds, his study was not restricted to speakers of a phonologically conservative dialect that preserves the nasalisation pattern. Therefore, we consider it important to double-check this finding, especially given that it touches on a core question of phonological theory. Finally, since the stimuli in Experiment 2 are all novel compounds, it serves as a replication of the frequency effect in novel compounds from Experiment 1.
4.1. Methods
4.1.1. Stimuli
Six N1s were selected, three monomoraic (e.g., [ta] ‘many’) and three bimoraic (e.g., [tai] ‘pair’), and were fully crossed with 28 N2s, roughly balanced between monomoraic (
 $n=12$
; e.g., [go] ‘Go’, [ga] ‘moth’) and bimoraic (
$n=12$
; e.g., [go] ‘Go’, [ga] ‘moth’) and bimoraic (
 $n=16$
; e.g., /gin/ ‘silver’, /gjaku/ ‘reverse’). All compound members were monomorphemic. Within each N2 length, stimuli sampled a wide range of log frequencies (monomoraic: 1.39–7.40, mean 4.61; bimoraic: 3.56–8.0, mean 5.51), and did not differ significantly in overall frequency via a two-sided t-test (
$n=16$
; e.g., /gin/ ‘silver’, /gjaku/ ‘reverse’). All compound members were monomorphemic. Within each N2 length, stimuli sampled a wide range of log frequencies (monomoraic: 1.39–7.40, mean 4.61; bimoraic: 3.56–8.0, mean 5.51), and did not differ significantly in overall frequency via a two-sided t-test (
 $t=-1.41$
;
$t=-1.41$
;
 ${df}=18.98$
,
${df}=18.98$
,
 $p=0.17$
). This yielded 168 novel compounds for analysis.
$p=0.17$
). This yielded 168 novel compounds for analysis.
We also included 32 compounds where the N2 was /k/-initial, as part of a separate experimental condition designed to test the interaction of rendaku and nasalisation. The research questions at stake in that condition are disjoint from those pursued in this article, so these stimuli are excluded from our analysis and not discussed further.
4.1.2. Participants
A total of 13 participants were recruited to participate in Experiment 2 by word of mouth and snowball sampling. As in Experiment 1, each participant was screened using the dialect questionnaire to ensure that they spoke a dialect where [g] and [ŋ] are allophonically distributed in monomorphemic words. Of the 13 interviewed, 12 met this criterion (see §3.2.2). Three participants had also participated in Experiment 1, while the other nine had not.Footnote 5 Unlike Experiment 1, speakers only participated in this experiment once, because of time and resource constraints.
4.1.3. Procedure
The procedure for Experiment 2 was identical to Experiment 1, as were data processing and statistical analysis.
4.2 Results
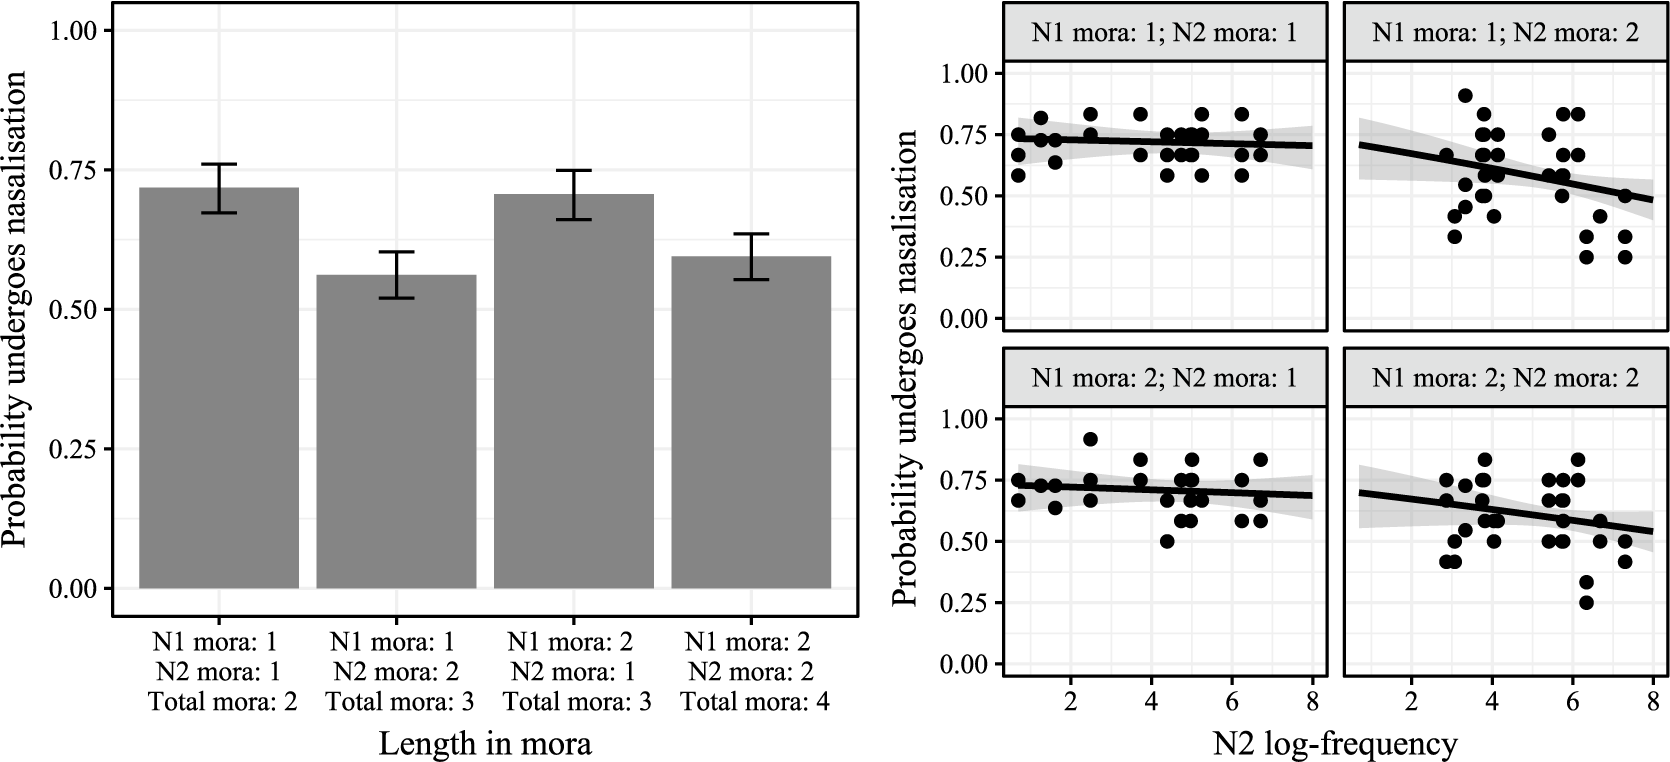
We begin with the central question of Experiment 2: does compound length in mora – above and beyond other factors, such as frequency – influence how often speakers apply nasalisation in novel compounds? Figure 11 plots the mean nasalisation rate by compound length and N2 frequency.
Probability of nasalisation plus standard error (vertical axis) plotted against the length of the compound in mora (horizontal axis, left) and N2 log-frequency (horizontal axis, right), with a binomial smooth.

We find that shorter compounds appear to undergo nasalisation more often than longer compounds, suggesting that the effect of global prosodic length seen in Figure 3 may be active in the grammar of Tōhoku Japanese speakers; the N2 frequency effect in novel compounds observed in Experiment 1 seems to replicate in Experiment 2.
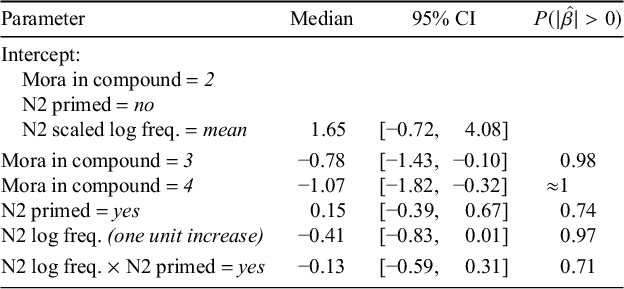
To assess the credibility of the visual trends observed in Figure 11, we fit a Bayesian mixed-effects logistic regression model to the experimental results, which is given in Table 5. The model structure followed the outline in §3.3, and had a three-level ordered factor of compound length in mora (levels 2–4); N2 log-frequency; whether N2 was primed; and the interaction between priming and N2 log-frequency. Since all N1s in Experiment 2 were vowel-final, we did not assess possible avoidance of adjacent nasals across the N1–N2 boundary.
Model of novel compounds with free N2s in Experiment 2. Coefficients are in log-odds, with positive signs indicating an increase in probability of nasalisation relative to the intercept.

The negative coefficient for N2 log-frequency indicates that there is substantial statistical support for the visual impression that compounds with higher-frequency N2s undergo nasalisation less often. Post-hoc pairwise comparisons between levels of Mora in compound using the emmeans package (Lenth Reference Lenth2020) revealed that three-mora compounds underwent nasalisation at a credibly lower rate than two-mora compounds, following the visual intuition in Figure 11, but that the difference in nasalisation rate for three- and four-mora compounds was of a smaller magnitude, and had a posterior distribution of credible values that overlapped zero, though around 80% of the credible values are compatible with a small positive effect (
 $\hat {\beta } = 0.28$
;
$\hat {\beta } = 0.28$
;
 $\textrm {95%~CI} = [-0.44,~1.00]$
;
$\textrm {95%~CI} = [-0.44,~1.00]$
;
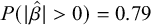 $P(|\hat {\beta }|> 0) = 0.79$
). Finally, as in Experiment 1, neither priming nor its interaction with N2 log-frequency meaningfully predicted nasalisation in participant responses (not plotted for space). In sum, Experiment 2 replicates the finding from Experiment 1 that the phonological treatment of even novel compounds is subject to the lexical frequency of their N2s and also provides partial support for the global prosodic length effect observed in the corpus, a topic to which we now turn in more depth.
$P(|\hat {\beta }|> 0) = 0.79$
). Finally, as in Experiment 1, neither priming nor its interaction with N2 log-frequency meaningfully predicted nasalisation in participant responses (not plotted for space). In sum, Experiment 2 replicates the finding from Experiment 1 that the phonological treatment of even novel compounds is subject to the lexical frequency of their N2s and also provides partial support for the global prosodic length effect observed in the corpus, a topic to which we now turn in more depth.
4.3. Discussion
Since the planned analysis of overall compound length revealed only a partial effect, we carried out an exploratory analysis on the compounds to better understand the nature of whatever length effect might exist.
In contrast to the gentle downward trend in nasalisation for longer compounds seen in the aggregated data (Figure 11), when we examine the data at the level of the compound’s moraic composition, we find a strikingly different pattern. Rather than being intermediate between two- and four-mora compounds, the two three-mora groups diverge in behaviour according to the length of their N2. Compounds with monomoraic N2s pattern with two-mora compounds (which have monomoraic N2s) in having a higher overall nasalisation rate, while those that have bimoraic N2s pattern with four-mora compounds (which also have bimoraic N2s). Thus, a more detailed examination of the Experiment 2 results suggests that it is not global compound length, but rather N2 length specifically, that is the dominant prosodic determinant of nasalisation in the novel compounds. This contradicts the typologically unusual pattern suggested in Figure 3, suggesting that the speakers of the Tōhoku dialect do not generalise a relationship between global prosodic length and a local segmental alternation (see also similar non-generalisation of a similar length-referring pattern in an artificial grammar learning paradigm by Jiang Reference Jiang2023a).
We also observe that the effect of frequency seems to be much more pronounced in compounds with bimoraic N2s (right column of the right graph in Figure 12), compared to those with monomoraic N2s. To assess whether this difference was statistically reliable, we fit a model with structure similar to the one summarised in Table 5, but with fixed effects of N1 mora (1 vs. 2), N2 mora (1 vs. 2) and the interaction of both N1 mora and N2 mora and N2 log-frequency (thought not the three-way interaction); the model also included the fixed effect of priming and its interaction with N2 log-frequency. We found that while the effect of N2 mora was strong and credible (
 $\hat {\beta } = -1.33$
;
$\hat {\beta } = -1.33$
;
 $\textrm {95% CI} = [-2.25, -0.35]$
;
$\textrm {95% CI} = [-2.25, -0.35]$
;
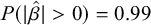 $P(|\hat {\beta }|> 0) = 0.99$
), the interaction between N2 mora and N2 log-frequency was not credibly different from zero (
$P(|\hat {\beta }|> 0) = 0.99$
), the interaction between N2 mora and N2 log-frequency was not credibly different from zero (
 $\hat {\beta } = -0.18$
;
$\hat {\beta } = -0.18$
;
 $\textrm {95% CI} = [-0.71, 0.35]$
;
$\textrm {95% CI} = [-0.71, 0.35]$
;
 $P(|\hat {\beta }|> 0) = 0.76$
), suggesting that the apparent differences in frequency effect between the columns in the right half of Figure 12 are artefacts of conversion from the unbounded space of log-odds used by the model to the bounded interval of probabilities that characterises the data.
$P(|\hat {\beta }|> 0) = 0.76$
), suggesting that the apparent differences in frequency effect between the columns in the right half of Figure 12 are artefacts of conversion from the unbounded space of log-odds used by the model to the bounded interval of probabilities that characterises the data.
Probability of nasalisation plus standard error (vertical axis) plotted against the moraic composition of the compound (horizontal axis, left; panels, right) and N2 log-frequency (horizontal axis within panels, right), with binomial smooths.

4.4. Global prosodic length does not directly influence nasalisation
Having observed that N2 length – not overall compound length – is a predictor of nasalisation above and beyond frequency, we speculate that the distinct behaviours observed between monomoraic and bimoraic N2s are due to prosodic factors (noting that this is a post-hoc analysis, which needs to be more fully addressed in a new study). Specifically, it may be that nasalisation is blocked by prosodic word boundaries, and bimoraic N2s are more likely to form an independent prosodic word than monomoraic N2s for prosodic reasons. We urge caution with this interpretation though, since these prosodic domains are typically posited in the research on compound accentuation for Tokyo Japanese, and so because our speculation here is entirely based on this body of work its transportability to a different dialect – Tōhoku Japanese – may be limited.
In examining compound accentuation in Tokyo Japanese, Ito & Mester (Reference Ito and Mester2018; Reference Ito and Mester2021) propose that monomoraic or bimoraic N2s form a foot, while N2s longer than this project their own prosodic word. This assumption was made to capture the traditional distinction between compounds with a ‘short’ N2 and compounds with ‘long’ N2. Although the details of compound accentuation are not our primary concern, in general terms, compounds with a short N2 have compound accent located at the end of N1 (e.g., [tinomí+go] ‘suckling child’), while ones with a long N2 either preserve the original accent of N2 (e.g., [hon+káigi] ‘main session’) or place an accent at the beginning of N2 (e.g., [kuchi+génka] ‘oral quarrel’). The essence of the analysis is that the presence or absence of an accent on N2 depends on whether N2 constitutes an independent prosodic word. However, this claim is not without exceptions; indeed, Ito & Mester (Reference Ito and Mester2018) discuss instances where bimoraic N2s with lexical initial accent retain this initial accent (e.g., [watashi+búne] ‘ferry boat’), and to account for such cases they assume that these bimoraic N2s exceptionally form a prosodic word.
Finally, a question that remains unresolved by this speculation is why the size of N2 should matter, and not the size of N1. A more articulated theory of the relationship between prosodic length, foot structure and accentuation is required for Tōhoku Japanese is needed, which will then support future experimental work with a larger range of compound member sizes. For the purposes of our discussion here, we can say that Experiment 2 does not support the claim that global prosodic length directly influences nasalisation, while noting that the size of the individual compound members does play such a role, though the details of this picture are still quite murky.
5. Implications for phonological theories
To summarise the contributions of the two experiments described above, we found that the variability reported in Ito & Mester (Reference Ito, Mester and Roca1996, Reference Ito and Mester2003) and Breiss et al. (Reference Breiss, Katsuda and Kawahara2022) for the Yamanote dialect is reproduced experimentally with speakers of the Tōhoku dialect in existing compounds (Experiment 1) as well as novel ones (Experiments 1 and 2) and showed that this variability holds at the level of each individual speaker. We also investigated a potential case of ‘phonological counting’ where nasalisation appeared to be conditioned by the overall mora count of the compound (Experiment 2). Instead, we revealed that the nasalisation was sensitive only to the size of N2 and speculated what type of metrical structures might – short of a counting-based analysis – account for this pattern.
These data pose challenges for existing models of frequency-dependent phonological behaviour, primarily because we find frequency-dependent behaviour exhibited in entirely novel morphological constructions. Many existing theories rely on the speaker maintaining multiple representations at different levels of granularity in their lexicon or long-term memory (here, the compound as a unit as well as the N2 as a unit). However, theories that locate frequency in the lexical representation of the larger unit that displays variation (here, the compound) have difficulty accounting for the probabilistic and frequency-conditioned behaviour of morphemes in novel contexts. For example, Zuraw et al.’s UseListed model (Zuraw Reference Zuraw2000; Zuraw & Peperkamp Reference Zuraw and Peperkamp2015; Zuraw et al. Reference Zuraw, Lin, Yang and Pepperkamp2021) proposes that a stored form competes with a grammatically composed form in speech production, and the relative frequency of the stored form regulates its competitiveness. Under this analysis, compounds might be stored with nasalisation (following ideas in Martin Reference Martin2011), and the nasalised form competes with a grammatically derived form (cf. the implementation in Zuraw Reference Zuraw2007). Depending on the details of the theory, the grammar itself might allow probabilistic nasalisation in its outputs, but this does not depend on the lexical frequency of the item directly. Thus, any observed frequency-dependent nasalisation in existing compounds results from greater lexical frequency favouring direct retrieval of the nasalised form. However, in the case of novel compounds, where the frequency of N2 regulates the probability of nasalisation, the UseListed theory has no obvious stored form to compete with the one derived online. Therefore, whatever rate of nasalisation is set in the grammar must be derived online and cannot relate to frequency.
Theories that attribute idiosyncratic behaviour to individual morphemes or larger units through constraint indexation or similar mechanism assume that the item which is indexed is itself the exceptionful one. In the case of existing items, lexical frequency is often adduced as not only a possible conditioning factor on their variation, but a critical one in both allowing speakers to learn item-specific behaviour (Moore-Cantwell & Pater Reference Moore-Cantwell and Pater2016; Smith & Moore-Cantwell Reference Smith and Moore-Cantwell2017; Zymet Reference Zymet2018) and to exhibit type-level ‘frequency matching’ of a probabilistic phonological process in novel forms (cf. Zuraw Reference Zuraw2000; Ernestus & Baayen Reference Ernestus and Baayen2003; Hayes et al. Reference Hayes, Siptár, Zuraw and Londe2009; Jarosz et al. Reference Jarosz, Cerys, Andrew, Brandon, Maggie, Seoyoung and Max2025). In the case of entirely novel compounds, however, there is (presumably) no indexed constraint for a never-before-heard item, and so this mechanism also seems insufficiently expressive.
Other types of analysis that attach the frequency conditioning to the item itself (here the N2) fare better with the data from novel compounds. These analyses break down roughly into ones that hold that differing token frequency has representational consequences for the N2 itself, and those that attribute the frequency conditioning to the constraint violations that the N2 incurs. Examples of analysis in the representation-driven style include those where the first segment of the N2 is represented as a blend of segments based on the frequency of attestation (in free forms or compounds, depending on the implementation; e.g., gradient symbolic representations, as in Smolensky & Goldrick Reference Smolensky and Goldrick2016, or Representational Strength Theory, as in Moore-Cantwell Reference Moore-Cantwell2021), or where N2 has two stored allomorphs, among which choice is governed by frequency.
A second class of theories includes those in which the lexical frequency of a form may not have direct representational consequences, but which appeal (implicitly or explicitly) to the notion of frequency as a psycholinguistic quantity which characterises the accessibility or prominence of lexical representations for the grammar. Phonological models have been proposed that scale the weights (Coetzee & Pater Reference Coetzee and Pater2006, Reference Coetzee and Pater2008; Coetzee Reference Coetzee2016; Coetzee & Kawahara Reference Coetzee and Kawahara2013) or violations (Breiss Reference Breiss2021) of faithfulness constraints by a quantity that relates to the lexical frequency of the form. Since these types of theories locate the effect of frequency in (or near) N2 itself, they are at least in a position to address the data from novel compounds.
Beyond this, however, it is difficult to say exactly which mechanisms are required to capture the frequency conditioning in novel forms without an implemented computational model of the experimental data, which we leave for future work. What does seem clear, at least qualitatively, is that theories that enrich the grammar and/or the lexicon only for morphologically complex items (here, just compounds) are likely insufficient.
Finally, any theory that works well for the frequency-conditioning data in novel compounds will also need to be able to model the two additional frequency effects in play in existing compounds: higher compound frequency (holding N2 frequency constant) increases the likelihood of nasalisation, while simultaneously higher N2 frequency (holding compound frequency constant) decreases the likelihood of nasalisation. A successful model will need to be able to capture these effects in the same model of indexation, listing or representational enrichment – or to demonstrate that adopting a hybrid approach achieves empirical coverage that outweighs the penalty in parsimony and model complexity that having a hybrid system incurs.
6. Conclusion
The present article leaves open a number of puzzles – empirical and theoretical – that may be fruitfully taken up in future work.
On the empirical side, although we have identified strong effects of N2 and compound frequency in governing the rate of nasalisation, it is not clear whether this bears out Ito & Mester’s (Reference Ito and Mester2003) claim that the compound’s morphological status (free vs. bound) itself specifically matters, above and beyond the effect of morpheme frequency. Answering this question would require a more targeted comparison of N2s, which are obligatorily bound with frequency-matched N2s, which can be free-standing.
On the theoretical side, we have presented data that we think are important contributions to the enterprise of phonological theory-building and comparison and suggested that our results favour those analyses that allow individual morphemes to exhibit frequency-sensitive behaviour, whether this is accomplished representationally or computationally. However, we did not carry out an in-depth qualitative – let alone quantitative – comparison of the different classes of analysis discussed in §5; in the development of a robust and psycholinguistically informed phonological theory, this is an equally important contribution that remains for future work. We hope this article serves as fuel for those who will carry it out.
Data availability statement
Data and code for both experiments can be accessed at https://osf.io/avnpw/?view_only=cd2afdcc183f4de3ac1261b4af66f08d.
Acknowledgements
Thanks to audiences at UCLA, AMP 2021, WCCFL 39 and the 45th Penn Linguistics Conference. The experiments were carried out under the ethical approval granted by the second author’s university.
Funding statement
This work was supported in part by the NSF Graduate Research Fellowship DGE-1650604 to C.B. and JSPS Grant No. 22K00559 to S.K.
Competing interests
The authors declare no competing interests.


 Open access