

Diabetes is a major global health issue, with the WHO reporting the prevalence to be 8·5 % of the adult population in 2014( 1 ). Epidemiological studies suggest a reduced risk of development of type 2 diabetes (T2D) in habitual coffee drinkers who consume≥1 cup/d( Reference Odegaard, Pereira and Koh 2 – Reference van Dam, Willett and Manson 6 ); however, differences in preparation method, coffee type, strength and serving size may confound results. Despite this, many studies report a dose-dependent effect on T2D risk with the greatest risk reduction observed at the highest coffee intakes. Interventional studies, however, have so far provided little corroboratory evidence. Studies investigating the acute effects of caffeinated coffee on the postprandial glucose response have frequently demonstrated an increased postprandial glucose excursion following coffee ingestion( Reference Louie, Atkinson and Petocz 7 – Reference Gavrieli, Karfopoulou and Kardatou 9 ), suggesting a potentially detrimental effect of coffee on glucose metabolism, in direct contrast to the epidemiology.
Few interventional studies have investigated the longer-term effects of coffee on glucose metabolism, the majority of which have examined the effects only in habitual coffee drinkers( Reference Kempf, Herder and Erlund 10 – Reference Wedick, Brennan and Sun 12 ). It could be argued that habitual coffee drinkers are not the most appropriate population to study as they will already have achieved any potential longer-term benefits of coffee drinking before the intervention. Despite this obvious limitation, to our knowledge, there has only been one study to date to investigate the longer-term effects of coffee drinking on glucose metabolism in coffee-naïve individuals. That study recruited overweight, non-coffee drinkers with impaired fasting glucose (IFG) and observed a reduction in the postprandial glycaemic response following consumption of five cups/d of instant coffee for 16 weeks( Reference Ohnaka, Ikeda and Maki 13 ). It is not known whether a similar result would be observed in healthy individuals.
The rs762551 SNP in the CYP1A2 gene affects the rate of caffeine metabolism( Reference Yang, Palmer and de Wit 14 ), with carriers of the C allele being classed as ‘slow’ caffeine metabolisers whereas those who are homozygous for the A allele are considered to be of a ‘fast’ metaboliser phenotype. Associations between coffee drinking and increased risk of myocardial infarction( Reference Cornelis, El-Sohemy and Kabagambe 15 ), hypertension( Reference Palatini, Ceolotto and Ragazzo 16 , Reference Guessous, Dobrinas and Kutalik 17 ) and IFG( Reference Palatini, Benetti and Mos 18 ) have been observed in individuals who are carriers of the ‘slow’ C allele but not in those with the ‘fast’ AA genotype. It is likely that these polymorphisms in the CYP1A2 gene will modulate the effects of coffee on glucose and lipid metabolism however, to our knowledge, this has not previously been investigated.
The present study investigated the effects of 12 weeks of caffeinated coffee consumption on glucose and lipid metabolism in healthy coffee-naïve individuals, with secondary analysis by rs762551 genotype.
Methods
Participants
In all, thirty adult males and females, aged over 18 years, were recruited from the staff and student population of the University of Surrey (UK) and from the local community. Participants were required to have been weight stable for the previous 3 months, to be taking no prescription medication other than oral contraceptives and to have no history of heart disease, diabetes, liver disease or any gastrointestinal or endocrine disorders. Smokers and habitual tea/coffee drinkers (>4 servings/week) were excluded. One participant dropped out mid-trial for personal reasons and two were excluded following genotype analysis. Baseline characteristics for the remaining twenty-seven participants are presented in Table 1. This study was conducted according to the guidelines laid down in the Declaration of Helsinki and all procedures involving human subjects were given a favourable ethical opinion by the University of Surrey Ethics Committee. Written informed consent was obtained from all participants. The study was registered with the ISRCTN, trial no. ISRCTN42321643 (http://www.controlled-trials.com/) and was carried out between September 2013 and July 2014.
Baseline participant characteristics (Medians and ranges; mean values and standard deviations)
SBP, systolic blood pressure; DBP, diastolic blood pressure; CHOL, total cholesterol.
*There were no statistically significant differences between coffee and control groups at baseline (P>0·05; Mann–Whitney U test)
†There were no statistically significant differences between coffee and control groups at baseline P>0·05; independent-samples t test).
Coffee pre-trial
Interested potential participants underwent a 2-d coffee pre-trial, before full enrolment on the study, to ensure they could tolerate the treatment and thus reduce attrition rate. Following screening, they were given eight individually wrapped coffee portions, containing 2 g instant coffee (a commercially available, 100 % Arabica bean blend), the equivalent of 1 teaspoon, and asked to consume four per d over the course of 2 d. Instant coffee was selected to ensure a consistent dose of caffeine and other coffee components, as other forms, such as espresso and filter coffee, result in greater variation in the end product, due to the complexity of the brewing process( Reference Mills, Oruna-Concha and Mottram 19 – Reference McCusker, Goldberger and Cone 21 ). Furthermore, instant coffee is the most popular form of coffee in the UK, accounting for almost 75 % of retail sales in 2015( 22 ). The coffee was dissolved in boiling water and taken without any additions, such as milk, cream, sugar or sweetener. Those who completed the pre-trial and wished to take part in the study then underwent a 14-d caffeine washout period before their first study visit. During this time they were instructed to consume no caffeine-containing food or drinks, such as coffee, tea, energy drinks and chocolate. This included decaffeinated products as the decaffeination process does not completely remove all caffeine. Participants also completed a 4-d food and drink diary, which they returned to the investigators at their first study visit.
Study design
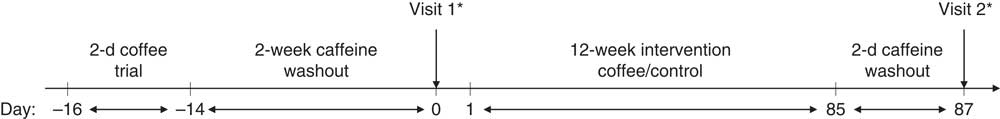
An open-label parallel-arm design was employed, with participants randomised, stratified by sex, into unequal treatment groups (2:1, coffee:control group). After a 14-d caffeine washout period, participants attended their baseline study visit. Participants were not advised which group they had been allocated to until after they had completed their first study visit. Following this visit, those in the coffee intervention group were provided with a supply of instant coffee portions and asked to consume four per d for 12 weeks, in the same manner as in the 2-d pre-trial. They were required to consume no caffeine-containing food or drinks, other than the supplied coffee, for the duration of the intervention. Those in the control group were asked to remain caffeine free for 12 weeks. Following the intervention, participants returned for their final study visit. An overview of the study timeline is presented in Fig. 1. All participants were visited once or twice at random during the 12-week intervention and asked to provide saliva samples which were frozen at −20°C immediately after collection; at the end of the study, salivary caffeine concentrations were analysed in order to monitor compliance. Participants in the coffee group were asked to return any unused coffee portions at the end of the study. These were counted and individual mean daily coffee intakes estimated.
Study timeline. Following a 2-d coffee pre-trial and 2-week caffeine washout period, participants attended their first study visit where baseline measures were taken. Following this, they were notified of their randomly allocated group (either coffee or control). The coffee group then consumed four cups/d of instant coffee for 12 weeks, whereas the control group remained caffeine free. After a final caffeine washout period (2 d), all participants returned for their second study visit. * Blood samples were taken at 0, 15, 30, 60, 90 and 120 min.
Study day protocol
Participants abstained from vigorous exercise for 2 d before each study visit and consumed a standardised meal the evening before (macaroni cheese, providing 3280 kJ (784 kcal) energy, 31·2 g protein, 35·2 g fat, 80·5 g carbohydrate and 10·1 g dietary fibre) and then fasted for 12 h overnight. In addition, those in the coffee group stopped taking the coffee sachets and were asked to consume no caffeine-containing food or drink for 2 d before their second study visit to ensure all study investigations were in an identical caffeine-free condition.
Participants arrived for each study visit between 08.00 and 09.00 hours. Blood pressure, body weight and body fat were measured and a buccal swab was taken for subsequent DNA analysis. A cannula was inserted into an antecubital vein and a fasted blood sample was taken. A liquid meal tolerance test (LMTT) was then carried out: participants consumed a standard liquid meal (2×200 ml Fortisip (Nutricia), providing 2510 kJ (600 kcal) energy, 24 g protein, 23 g fat and 74 g carbohydrate) and further venous blood samples were taken at 15, 30, 60, 90 and 120 min postprandially.
Blood sampling
Blood samples were collected into Vacuette® Z serum clot activator tubes (Greiner Bio-One) and left to stand at room temperature for 30 min to allow clotting before being transferred onto ice. Blood samples, for the preparation of plasma, were collected into fluoride oxalate tubes (Teklab) and put straight onto ice. At the end of the study day all samples were centrifuged at 1912 g , 4°C for 10 min. Plasma and serum aliquots were taken and frozen at −20°C for batch analysis at the end of the study.
Plasma glucose and serum total cholesterol, HDL-cholesterol, NEFA and TAG were measured on an ILab 650 analyser (Instrumentation Laboratory). Inter-assay CV were 2, 4, 9, 8 and 9 % respectively and intra-assay CV were≤4, 9, 9, 7 and 8 %, respectively. Serum insulin concentrations were measured by RIA using a Human Insulin Specific RIA kit (Millipore). Inter-assay CV were 11 % and intra-assay CV were≤9 %. Serum inflammatory markers, IL-6 and TNF-α, were analysed by the Clinical Immunology Service (University of Birmingham), using a bead-based multiplex assay (Bio-Plex Precision Pro Human Cytokine Assay kit; Bio-Rad). The plate was analysed on a Luminex-100 plate reader (Bio-Plex Systems; Bio-Rad Laboratories) using a low ‘RP1’ (low PMT – photomultiplier tube) target setting. Intra-assay CV were<10 %.
Salivary caffeine analysis
A 0·5-ml aliquot was taken from each saliva sample and 0·5 ml ethanol added. Samples were then microcentrifuged for 10 min at 19 071 g , 4°C. Caffeine concentration was measured by reversed-phase HPLC, using a Synergi Hydro ODS (C18) 4·6×250 mm column (Phenomenex), with 35 % methanol in water, run in isocratic mode at 0·75 ml/min; column temperature was 30°C, injection volume was 20 µl and run time was 10 min. Caffeine content was determined by measuring the absorbance at 260 and 280 nm.
Coffee analysis
The coffee was analysed for caffeine, trigonelline and chlorogenic acid (CGA) content by Sciantec Analytical Services. The results of this analysis are presented in Table 2.
Instant coffee analysis: caffeine, trigonelline and key chlorogenic acids
CQA, caffeoylquinic acid.
DNA extraction and analysis
DNA was extracted from buccal cells into MasterAmp DNA extraction solution (Epicentre Biotechnologies) and frozen at −20°C until required. The extracted DNA was then analysed for the rs762551 SNP using a 5'-nuclease allelic discrimination assay (Taqman drug metabolism genotyping assay SNP ID rs762551, gene CYP1A2; Applied Biosystems).
Statistics
As this was the first study to compare glycaemic response by genotype, there was no similar study to base a power calculation on. Sample size was therefore set at thirty participants, with ten participants in the control group and twenty participants in the coffee group (target ten participants per genotype subgroup). This is in line with standard practice in glycaemic index testing, which recommends a minimum of ten participants per test food to ensure sufficient statistical power( Reference Brouns, Bjorck and Frayn 23 ). A retrospective power calculation was performed, using the Harvard statistical power calculator for parallel trials( Reference Schoenfeld 24 ). Based on change in glucose incremental AUC (IAUC) in the coffee group, it found that, for twenty participants (ten per genotype), there was an 80 % probability (two-sided 0·05 significance level) that the study would detect a difference in treatment if the true difference between treatments was 59·3 mmol/l×120 min, based on the assumption that the sd for change in glucose IAUC was 44·71 mmol/l×120 min. Statistical analysis was carried out using IBM SPSS Statistics 21. The Matsuda index (10 000/√((fasting glucose×fasting insulin)×(mean glucose×mean insulin during LMTT)))( Reference Matsuda and DeFronzo 25 ) was calculated as a measure of postprandial insulin sensitivity. Homogeneity of variance was checked using Mauchly’s test for sphericity; any violations of the assumption were corrected with the Greenhouse-Geisser adjustment. Insulin, Matsuda index, TAG and TNF-α data were not normally distributed, therefore log transformation was applied and parametric tests carried out on the log-transformed data. Age, IL-6 and HDL-cholesterol data were not normally distributed, either before or after log transformation, therefore non-parametric tests were carried out on the original data. All other data (glucose time-points, glucose IAUC, NEFA, total cholesterol, weight, body fat, BMI, systolic and diastolic blood pressure) were normally distributed. Statistical significance was taken as P<0·05. Differences between coffee and control groups (primary analysis) and between AA and ACgenotypes (secondary analysis), for all single measures (fasted blood measures, Matsuda index and anthropometrics), were compared by either independent-samples t test (glucose, insulin, TAG, NEFA, total cholesterol, TNF-α, Matsuda index, weight, body fat, BMI, systolic and diastolic blood pressure) or Mann–Whitney U test (age, IL-6 and HDL-cholesterol). The same tests were used to compare changes in these measures between groups over the course of the intervention. Baseline differences between coffee and control groups for the postprandial time-point data (glucose, insulin, TAG and NEFA, measured at six time-points over a 2-h period) were compared by a repeated-measures (six time-points) full factorial fixed effects (treatment, time) linear model. The effects of the intervention on the postprandial time-point data were compared using a repeated-measures (six time-points) full factorial fixed effects (treatment, visit, time) linear model. Similarly, for the secondary analysis, baseline differences between genotypes for the postprandial time-point data were compared by a repeated-measures (six time-points) full factorial fixed effects (genotype, time) linear model and the effects of the intervention on the postprandial time-point data were compared using a repeated-measures (six time-points) full factorial fixed effects (genotype, visit, time) linear model. Sex is a potential confounder to these results, as differences between men and women in postprandial glucose, insulin, TAG and NEFA response have been reported( Reference Couillard, Bergeron and Prud’homme 26 – Reference Sumner, Kushner and Lakota 28 ), so these models were also run with sex as an additional fixed effect. This additional analysis has only been reported where the results differ from the original model.
Results
Participant compliance
All participants in the coffee group had at least one random saliva sample with a caffeine concentration over 3 µm. There were no significant differences between genotypes in the coffee group for mean salivary caffeine concentration (independent samples t test, P=0·202). In the control group, all samples were less than 1 µm. Based on returned coffee portions, the median daily coffee intake was 3·9 servings (range: 3·5–4·3 servings/d).
Genotyping
The distribution of genotypes was as expected within the population and did not deviate from the Hardy−Weinberg equilibrium (Pearson’s χ 2 test with 1 df, P >0·05). There were two participants with the CC genotype, both of which had been randomized to the control group, resulting in a bias between coffee and control groups for this genotype. Although one C allele is deemed sufficient to confer a ‘slow’ caffeine metaboliser phenotype and two A alleles are required for a ‘fast’ caffeine metaboliser phenotype( 29 ), a decision was made to exclude the two participants with the CC genotype before analyses to reduce the risk of bias when comparing groups.
It is considered that the ‘fast’ metaboliser phenotype requires induction by, for example, smoking( Reference Ghotbi, Christensen and Roh 30 , Reference Gunes, Ozbey and Vural 31 ) or heavy coffee consumption( Reference Djordjevic, Ghotbi and Jankovic 32 ). Several dietary components have also been demonstrated to affect CYP1A2 activity; five portions per d of brassica vegetables have been reported to increase CYP1A2 activity, whilst five daily portions of apiaceous vegetables decrease activity( Reference Lampe, King and Li 33 ). All participants were non-smokers and non-coffee drinkers when recruited, with a low intake of dietary inducers (mean daily intake: 0·25 portions) and inhibitors (mean daily intake: 0·26 portions). Those with the AA genotype were therefore unlikely to have the ‘fast’ metaboliser phenotype induced at the outset of the study. Nevertheless, for clarity within the manuscript and in order to easily distinguish between the groups, those with the AA genotype will be reported as being ‘fast’ metabolisers and those with the AC genotype as being ‘slow’ metabolisers. The difference in the ratio of ‘fast’ to ‘slow’ metabolisers between groups was not statistically significant (Fisher’s exact, P=0·678).
Primary analysis: comparison of coffee (?>n 19) and control (?>n 8) groups
Baseline measures
There were no differences at baseline between coffee and control groups for any of the anthropometric measures (age, weight, body fat, BMI, systolic and diastolic blood pressure, P>0·05). There were no differences between coffee and control groups pre-intervention for any of the single blood measures (fasted glucose, insulin, TAG, NEFA, TNF-α, IL-6, Matsuda index, total cholesterol and HDL-cholesterol, P>0·05). Nor were there any pre-intervention differences between groups for postprandial glucose, insulin, TAG and NEFA time-point data (P>0·05).
Effect of intervention
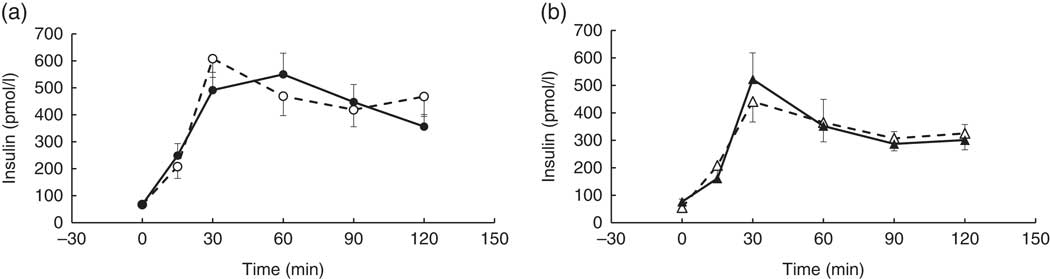
There were no significant differences between coffee and control groups, post-intervention, for change in: fasted blood measures, Matsuda index and anthropometric measures (P>0·05). Nor were there any significant differences between groups in their response to the intervention for the postprandial glucose, insulin, TAG and NEFA time-point data (P>0·05). However, a strong trend for a treatment×time×visit interaction was observed for the postprandial insulin time-point data, following the intervention (repeated-measures (six time-points) full factorial fixed effects (treatment, visit, time) linear model, P=0·054). Examination of the mean postprandial insulin responses for each group revealed a delayed postprandial insulin peak post-intervention for the coffee group only (Fig. 2).
Postprandial insulin response by visit and treatment group. All measures were taken in a caffeine-free state. A liquid meal was consumed immediately after the fasted blood sample was taken. The meal start time was recorded and all subsequent blood samples were timed from this point. (a) Coffee group (n 19), (b) control group (n 8). There was no overall difference in the postprandial response between groups (repeated-measures (six time-points) full factorial fixed effects (treatment, visit, time) linear model, P>0·05), but there was a trend for a visit×time×treatment interaction (P=0·054), with the coffee group displaying a later peak at the second visit. Values are means, with their standard errors represented by error bars. ![]() , Coffee group, pre-intervention;
, Coffee group, pre-intervention; ![]() , coffee group post-intervention;
, coffee group post-intervention; ![]() , control group pre-intervention;
, control group pre-intervention; ![]() , control group, post-intervention.
, control group, post-intervention.
Secondary analysis: comparison of rs762551 genotypes
Baseline measures (coffee and control groups combined: AC genotype, n 14; AA genotype, ?>n 13)
There were no significant differences between genotypes at baseline for any of the anthropometric measures (P>0·05). Nor were there any differences between genotypes for fasted or postprandial insulin and TAG, Matsuda index, total and HDL-cholesterol, IL-6 and TNF-α (P>0·05).
There were no significant differences between genotypes at baseline for either fasted glucose or the postprandial glucose response (P>0·05). However, when sex was added as a cofactor to genotype in the analysis, an effect of genotype was observed for fasted glucose (two-way ANOVA with interaction effect, P=0·014) and postprandial glucose time-point data (repeated-measures (six time-points) full factorial fixed effects (genotype, sex, time) linear model, P=0·017), with the AA genotype (‘fast’ metaboliser phenotype) exhibiting a smaller overall postprandial glucose excursion at baseline. There was a trend for a difference in fasted NEFA between the AA and AC genotypes (independent samples t test, P=0·062). When sex was added to the baseline analysis as a cofactor, the previously observed trend for a difference in fasted NEFA between genotypes became significant (two-way ANOVA with interaction effect, P=0·036) and a strong trend for an effect of genotype was observed in the postprandial time-point data (repeated-measures (six time-points) full factorial fixed effects (genotype, sex, time) linear model, P=0·055), with the AC genotype (‘slow’ metabolisers) displaying higher fasted and postprandial NEFA at baseline.
Effect of genotype on participants’ response to the intervention within the coffee group (AC genotype, ?>n 9; AA genotype, ?>n 10)
There were no significant differences between rs762551 genotypes in the coffee group in their response to the intervention for any anthropometric measure (P>0·05).
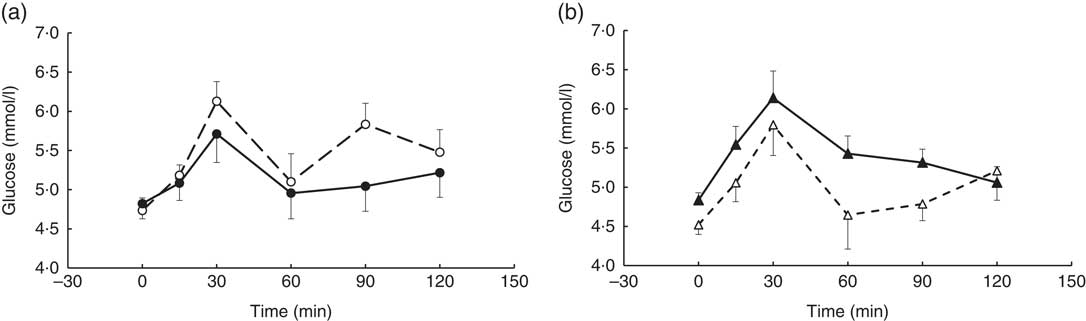
A visit×genotype effect (repeated-measures (six time-points) full factorial fixed effects (genotype, visit, time) linear model, P=0·048) was observed when the glucose time-point data were analysed, with an increase in postprandial glucose response being observed in the AA genotype and a decrease observed in the AC genotype (‘slow’ metaboliser phenotype) following the coffee intervention (Fig. 3).
Postprandial glucose response by visit and genotype within the coffee group. All measures were taken in a caffeine-free state. A liquid meal was consumed immediately after the fasted blood sample was taken. The meal start time was recorded and all subsequent blood samples were timed from this point. (a) AC genotype (‘slow’ caffeine metabolisers, n 9), (b) AA genotype (‘fast’ caffeine metabolisers, n 10). The two genotypes responded differently to the coffee intervention (repeated-measures (six time-points) full factorial fixed effects (genotype, visit, time) linear model, visit×genotype interaction, P=0·048). Values are means, with their standard errors represented by error bars. ![]() , AC genotype, pre-intervention;
, AC genotype, pre-intervention; ![]() , AC genotype post-intervention;
, AC genotype post-intervention; ![]() , AA genotype pre-intervention;
, AA genotype pre-intervention; ![]() , AA genotype, post-intervention.
, AA genotype, post-intervention.
There were no differences between genotypes for serum insulin (P>0·05). Both genotypes displayed a delayed peak following the intervention (not shown) as was observed in the coffee group in the primary analysis.
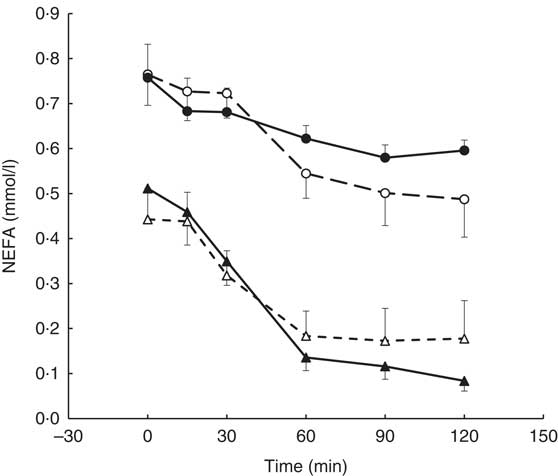
A visit×genotype×time interaction was found for the postprandial NEFA response (repeated-measures (six time-points) full factorial fixed effects (genotype, visit, time) linear model, P=0·044) with greater NEFA suppression being observed in the AA genotype (‘fast’ metabolisers) following the intervention and an apparent reduction in NEFA suppression observed in the AC genotype (Fig. 4).
Postprandial NEFA response by visit and genotype within the coffee group (AA genotype, n 10; AC genotype, n 9). All measures were taken in a caffeine-free state. A liquid meal was consumed immediately after the fasted blood sample was taken. The meal start time was recorded and all subsequent blood samples were timed from this point. The two genotypes responded differently to the coffee intervention (repeated-measures (six time-points) full factorial fixed effects (genotype, visit, time) linear model, visit×time×genotype interaction, P=0·044). Values are means, with their standard errors represented by error bars. ![]() , AC genotype, pre-intervention;
, AC genotype, pre-intervention; ![]() , AC genotype post-intervention;
, AC genotype post-intervention; ![]() , AA genotype pre-intervention;
, AA genotype pre-intervention; ![]() , AA genotype, post-intervention.
, AA genotype, post-intervention.
There were no differences between genotypes in their response to the intervention for change in Matsuda index, total and HDL-cholesterol, IL-6 and TNF-α (P>0·05).
Discussion
This is the first study to examine the longer-term effects of coffee drinking in coffee-naïve individuals with normal glucose metabolism. Furthermore, this is the first report that these effects may be modulated by the rs762551 SNP. The results of the primary analysis suggest that daily, moderate consumption of instant coffee (four cups/d) does not affect the postprandial glucose and lipid response in healthy adults, but may result in a delayed postprandial insulin peak. This delayed insulin peak is comparable to the reduced first-phase insulin response documented in T2D, however, unlike in T2D( Reference Bruce, Chisholm and Storlien 34 ), there was no consequent deterioration in glycaemia at this time, so the physiological significance is unclear. It is possible that this result is indicative of enhanced insulin sensitivity, as has been demonstrated following longer term caffeine consumption in animal models( Reference Park, Jang and Hong 35 ), however there was no observed effect on the Matsuda index( Reference Ohnaka, Ikeda and Maki 13 ), a measure of postprandial insulin sensitivity. The lack of effect of coffee on postprandial glucose is consistent with studies in habitual coffee drinkers( Reference Kempf, Herder and Erlund 10 , Reference Wedick, Brennan and Sun 12 ), but in contrast to Ohnaka et al. ( Reference Ohnaka, Ikeda and Maki 13 ) who observed a reduction in the postprandial glucose response in coffee-naïve individuals following 16 weeks of coffee intake( Reference Ohnaka, Ikeda and Maki 13 ). Whilst coffee dose (6–8 g instant granules/d) and compliance, as estimated from random saliva samples, were similar between studies, the study populations were quite different. Ohnaka et al. ( Reference Ohnaka, Ikeda and Maki 13 ) studied overweight, older men with IFG, whereas the participants in this study were mostly normal weight and younger with fasted glucose within the normal range. IFG is characterised not only by elevated fasting glucose, but also by decreased β-cell glucose sensitivity and reduced first-phase insulin response leading to an elevated glycaemic response in comparison with subjects with normal glucose tolerance( Reference Kanat, Mari and Norton 36 ). It is likely that any effects in a healthy population would be of a smaller magnitude and a larger sample size may be required for any observed effects to reach statistical significance.
The coffee used in this study, a commercially available instant coffee sold in the UK, was relatively low in caffeine (2·2 g/100 g) and CGA (2·2 g/100 g) in comparison with some other instant coffees, with reported caffeine ranges of 2·5–5·0 g/100 g( Reference Farah, Monteiro and Donangelo 37 ) and CGA ranges of 2·1–4·3 g/100 g( Reference Mills, Oruna-Concha and Mottram 19 ). As Ohnaka et al. ( Reference Ohnaka, Ikeda and Maki 13 ) did not report a coffee analysis for comparison, it is not possible to examine whether a difference in coffee composition between the two studies could contribute to the different outcomes.
Participants in the coffee group abstained from coffee drinking for 2 d before their follow-up visit to ensure that chronic rather than acute effects were examined. This may, however, have reduced any effects of the intervention as it is unknown how long it takes for chronic effects of coffee drinking to dissipate. Unlike the present study, participants in the study of Ohnaka et al. ( Reference Ohnaka, Ikeda and Maki 13 ) were required to fast from 21.00 hours before their study day with no requirement to abstain from coffee for a longer period. The mean plasma t 1/2 of caffeine is 5 h, although this can vary considerably between individuals, with most caffeine being cleared within 4–5 half-lives (approximately 24 h)( Reference Teekachunhatean, Tosri and Rojanasthien 38 ). Whilst CGA are extensively metabolised, several of their metabolites, such as dihydroferulic acid-4-O-sulfate and ferulic acid-4-O-sulfate, have half-lives in excess of 4 h( Reference Del Rio, Stalmach and Calani 39 ). It is likely therefore that the participants in the study of Ohnaka et al. ( Reference Ohnaka, Ikeda and Maki 13 ) were not entirely free of either caffeine or CGA metabolites on the study days, which may contribute to the difference in results between studies.
Two meta-analyses have concluded that longer-term coffee consumption results in raised total and LDL-cholesterol and TAG, with no effect on HDL-cholesterol( Reference Cai, Ma and Zhang 40 , Reference Jee, He and Appel 41 ). They observed that most of the effect came from studies using boiled coffee which contains relatively large amounts of the diterpenes, cafestol and kahweol, which are known to be lipid raising( Reference Weusten-Van der Wouw, Katan and Viani 42 , Reference Urgert and Katan 43 ). Although the diterpene content was not measured in the present study, instant coffee has been demonstrated to be relatively low in these compounds, as most of the diterpene content is lost during the production process( Reference Gross, Jaccaud and Huggett 44 ). This may explain the lack of observed effect of instant coffee on total cholesterol and TAG in the present study.
Finally, it should be noted that the participants in the present study may not be representative of the general population in some respects as it is possibly rare to find coffee-naïve individuals willing to drink coffee for the purposes of a research project. However, participants were randomly allocated to coffee or control group, minimising the risk of bias between groups.
Little is known regarding mechanisms for the apparent protective effect of chronic coffee consumption suggested by the epidemiology. In fact, it would appear that caffeine may have a detrimental effect on glucose metabolism as caffeine and caffeinated coffee, have both been documented to increase the acute postprandial glucose response more than a control( Reference Louie, Atkinson and Petocz 7 , Reference Robertson, Clifford and Penson 8 , Reference Robinson, Savani and Battram 45 ) whereas decaffeinated coffee frequently has no effect( Reference Johnston, Clifford and Morgan 46 ). Caffeine acutely raises plasma glucose concentrations by a variety of mechanisms; it raises plasma adrenalin and is also a non-specific adenosine receptor antagonist, both of which actions lead to a decrease in glucose disposal rates( Reference Battram, Graham and Richter 47 ). In contrast, large doses (1 g) of CGA have been observed to reduce the postprandial glucose response( Reference van Dijk, Olthof and Meeuse 48 ), with suggested mechanisms including inhibition of glucose absorption in the gut( Reference Welsch, Lachance and Wasserman 49 ) and inhibition of hepatic glucose output( Reference Arion, Canfield and Ramos 50 ).
Although a single cup of instant coffee does not contain high amounts of caffeine or CGA, a heavy coffee drinker may consume a considerable amount over the course of a day, particularly if also consuming espresso-type coffees which can contain up to 422 mg total CGA and 322 mg caffeine in a single serving( Reference Crozier, Stalmach and Lean 20 ). Frequent coffee intake may therefore result in sufficiently high concentrations of CGA in the blood to result in a reduced postprandial glycaemic response as observed with a single high dose( Reference van Dijk, Olthof and Meeuse 48 ).
It should also be considered that coffee may exert protective effects in ways not directly related to postprandial glycaemia or lipaemia. One potential mechanism may be by inhibiting the formation of amyloid fibrils from human islet amyloid polypeptide. These fibrils accumulate in the pancreas and are prevalent in T2D( Reference Caillon, Hoffmann and Botz 51 ). CGA and their metabolites have been demonstrated to suppress formation of these amyloids in vitro, although it should be noted that the authors reported non-physiological doses were used in that study( Reference Cheng, Liu and Gong 52 ).
Secondary analysis
There was significant individual variation in response to the coffee intake, which may be partially explained by the results of the secondary analysis. The baseline differences in NEFA and glucose between rs762551 genotypes was unexpected and may be indicative of a ‘less healthy’ overall physiological state in those with the AC genotype, as reduced NEFA suppression and elevated postprandial glucose response may be a result of reduced insulin sensitivity, a key risk factor for development of T2D. This is consistent with the epidemiology observing an association between carriers of the ‘slow’ C allele and increased T2D risk, irrespective of coffee consumption( Reference Platt, Ghassibe-Sabbagh and Salameh 53 ). The participants reported to be non-smokers and non-coffee drinkers and were therefore unlikely to have the ‘fast’ metaboliser phenotype induced at baseline. Furthermore, intake of dietary inducers and inhibitors was low, with no differences between genotypes (P>0·05). The data therefore imply that there is some as yet uncharacterized effect of this SNP, independent from its effects on caffeine metabolism/CYP1A2 activity, which has resulted in the baseline differences. This warrants further investigation.
The increased postprandial glucose following the coffee intervention in those with the AA (‘fast’) genotype suggests that there could be a potentially detrimental effect of habitual coffee drinking on glycaemia in this group. It is unknown whether this is physiologically relevant as the observed increase in glucose response was not pathologically high and glucose levels at 2 h were normalised, however there is increasing interest currently in the long-term effects of changes to postprandial glucose and its role as a risk factor in the progression towards metabolic diseases such as T2D. In apparent contrast to this however, the coffee intervention resulted in enhanced NEFA suppression in the AA genotype, suggesting a potentially beneficial effect of coffee on adipose tissue insulin sensitivity.
Conversely, the impaired NEFA suppression in the AC (‘slow’) genotype following the intervention is particularly interesting when one considers that this group also exhibited higher NEFA concentrations pre-intervention than the AA (‘fast’) genotype.
Several other SNPs on the CYP1A2 gene are associated with decreased enzyme activity. The rs2069514 SNP in particular may be a confounder as a cross-sectional study in Japanese men found this SNP modified the association between coffee drinking and prevalence of T2D( Reference Kohno, Tajima and Uezono 54 ). The A allele, which results in decreased enzyme activity, is uncommon in Caucasians (8 %), but is relatively common in Asians (28 %). As 8/19 of the coffee group were Asian it is likely that some participants were also carriers of this allele.
In conclusion, the primary analysis found no effects of moderate consumption of instant coffee on markers of glucose and lipid metabolism in healthy adults. However the secondary analysis revealed baseline differences between genotypes in the coffee group suggesting that coffee-naïve individuals who are carriers of the ‘slow’ C allele may exhibit an impaired glucose and lipid profile, demonstrated by a greater postprandial glucose response and reduced postprandial NEFA suppression, relative to those homozygous for the ‘fast’ A allele. Furthermore, the differences observed between the two genotypes in their response to the intervention, suggest a potentially detrimental effect of coffee on glucose response in the AA (‘fast’) genotype and on NEFA response in the AC (‘slow’) genotype. These contrasting results between genotypes may explain the lack of overall effect from coffee in this study, particularly as the coffee group had an even distribution of genotypes (AA, n 10; AC, n 9). This novel finding may also partially explain the inconsistency in the epidemiology regarding coffee consumption and T2D risk as, to date, these studies have not genotyped their participants for this confounder.
These differences between genotypes make it inadvisable at this stage to recommend either coffee drinking or abstention to either group although such data may be combined with other ‘personalised nutrition approaches’. Despite the small sample size of the present study, a clear interaction between coffee intake and the rs762551 SNP was observed. A larger study with additional health outcomes is needed to confirm these findings and to further investigate the potential impact of this SNP.
Acknowledgements
The authors thank Dr J. M. Frank for carrying out the salivary caffeine analysis at the University of Surrey.
This work was supported by the Biotechnology and Biological Sciences Research Council (BBSRC) and Campden BRI as part of a BBSRC CASE Studentship.
T. M. R., M. D. R. and M. N. C. designed research; T. M. R. conducted research; T. M. R. and P. W. analysed data; T. M. R., P. W. and M. D. R. wrote the paper. All authors read and approved the final manuscript.
The authors declare that there are no conflicts of interest.
Supplementary material
For supplementary material/s referred to in this article, please visit https://doi.org/10.1017/S0007114518000260


