

Indigenous Australians have a higher risk of developing obesity-related health conditions(Reference Trewin1, Reference Craig, Femia and Broyda2). A recent study reported that the average age of Aboriginal and Torres Strait Islanders diagnosed with type 2 diabetes mellitus decreased by about 2 years in the period from 1999 to 2005(Reference McDermott, McCulloch and Campbell3). Considering the increasing financial burden for the Australian community from obesity and related health problems(Reference Thorburn4), early screening and prevention strategies for the Indigenous population have been recommended.
To apply effective strategies, a better understanding of morphology and its relationships with body composition and metabolic markers in each ethnic group is essential. In adults, anthropometric indices such as the BMI and waist circumference have been used as indicators of CVD risk(Reference Wang and Hoy5). Indigenous Australian adults have a different pattern of fat distribution compared with non-Indigenous Australians(Reference Jones and White6), and, as reported in different ethnic groups(Reference Deurenberg, Yap and van Staveren7, Reference Kagawa, Kerr and Uchida8), Aboriginal adults (aged 18–35 years) show different relationships between adiposity and fat distribution to BMI compared with their European counterparts(Reference Piers, Rowley and Soares9).
Comprehensive assessments of the physical characteristics of Indigenous children and adolescents are few and dated(Reference Hitchcock, Gracey and Maller10), and it is important to clarify if screening using the same cut-off points for Caucasian and Indigenous children is appropriate. A lack of understanding of ethnic differences in body size, proportion and fat distribution patterns may lead to misuse or misinterpretation of results obtained from anthropometric indices. Today, the number of Indigenous individuals living a more traditional lifestyle is relatively small compared with the urban Indigenous population who have a more mixed racial background and commonly live in lower socio-economic circumstances compared with most Australian Caucasians.
The aim of the present study was to characterise the anthropometry and body composition of Caucasian and Indigenous children and adolescents living in an urban setting. Previous studies have referenced ethnic differences in relationships between commonly used anthropometric indices, such as the BMI, and accumulated fat in adults(Reference Deurenberg, Yap and van Staveren7, Reference Kagawa, Kerr and Uchida8). Due to the paucity of similar studies in children and adolescents(Reference Deurenberg, Deurenberg-Yap and Foo11, Reference Rush, Puniani and Valencia12), the present study also examined relationships between fat mass and anthropometric indices in Caucasian and Indigenous children and adolescents.
Methods
The study was approved by the Human Research Ethics Committee of Queensland University of Technology and adhered to the principles of medical research established by the National Health and Medical Research Council(13). Participants were recruited from primary and secondary schools located in the Brisbane metropolitan area with the majority of Indigenous children recruited through the Aboriginal and Islander Independent Community School (Murri School). Participants were also recruited through flyers, local newspapers and magazines. All participants and their parents or caregivers were given information packages and consent forms were signed before participation.
The study included seventy Caucasian (forty-four boys, twenty-six girls) and seventy-four Indigenous (thirty-six boys, thirty-eight girls) children aged 9–15 years. The criteria for ‘Indigenous’ were that a child had at least one parent of ‘Indigenous’ ancestry or that the Indigenous community recognised the child as a member of that community. Selection criteria were similar to the definition of ‘Aboriginal’ by Australian law outlined in a previous study(Reference Piers, Rowley and Soares9), that is: (1) Aboriginal descent; (2) self-identification as an Australian Aboriginal; and (3) being accepted as such by the community in which he or she lives or has lived. Children with chronic health problems or taking medication that may have influenced their physical status were excluded from the study.
Anthropometry
Stature, body mass, eight skinfolds (triceps, subscapular, biceps, iliac crest, supraspinale, abdominal, front thigh, and medial calf), thirteen girths (head, arm (relaxed), arm (flexed and tensed), forearm, wrist, chest, waist (narrowest point), abdominal (the level of umbilicus), gluteal, thigh, mid-thigh, calf (maximum), and ankle), six bone lengths (acromiale–radiale, radiale–stylion, midstylion–dactylion, trochanterion–tibiale laterale, tibiale height, and foot length) and five bone breadths (biacromial, biiliocristal, transverse chest, biepicondylar humerus, and biepicondylar femur) of each participant were measured using the standard protocol by the International Society for the Advancement of Kinanthropometry (ISAK)(14). All participants were asked to wear light clothing, such as shorts and T-shirt, and stature and body mass were measured without shoes and socks. All landmarks and measurements were conducted by a Level 3 (instructor) anthropometrist accredited by ISAK. Intra-tester technical error of measurement (TEM) was calculated for all measures using twenty randomly selected participants. The intra-tester TEM was no greater than 5·0 % for all skinfold measurements and no greater than 1·0 % for other measurements, within the acceptable limits of intra-tester TEM recommended by ISAK for a Level 3 anthropometrist(Reference Gore, Norton, Olds, Norton and Olds15).
From the measurements, BMI (body mass (kg)/stature (m)2), abdominal:height ratio (AHtR: abdominal/stature), waist:hip ratio (waist/gluteal) were calculated. In addition, the sum of eight skinfolds (ΣSF = triceps+subscapular+biceps+supraspinale+iliac crest+abdominal+front thigh+medial calf) and sum of trunk skinfolds (ΣTrunkSF = supraspinale+iliac crest+abdominal) were calculated to determine subcutaneous fat distribution pattern. Arm and leg lengths relative to stature were calculated to observe ethnic differences in body proportion, and the physique of participants was determined by calculating a somatotype score(Reference Carter and Heath16). Somatotype is a representation of one's physique and is a combination of endomorphy (relative plumpness), mesomorphy (relative muscularity) and ectomorphy (relative linearity) components. Each component was calculated using equations described in the literature(Reference Carter and Heath16).
Body composition assessment
Body composition was assessed using dual-energy X-ray absorptiometry (DXA; Lunar Prodigy Advance, enCORE 2005 version 9.30.044; GE Healthcare, Madison, WI, USA). Each whole-body DXA scan was completed within approximately 6–10 min, depending on the size of the participant and information on bone mineral content (kg), bone mineral density (g/cm2), fat tissue mass, lean tissue mass, total tissue mass (fat+lean tissue mass) of the whole body as well as android and gynoid regions of interest (ROI) were obtained. The android ROI is defined as the ‘lower boundary at pelvis cut, upper boundary located at above pelvis cut by 20 % of the distance between pelvis and neck cuts. Lateral boundaries are the arm cuts.’ The gynoid ROI is defined as the ‘upper boundary below the pelvis cut line by 1·5 times the height of the android ROI. Gynoid ROI height is equal to two times the height of the android ROI. Lateral boundaries are the outer leg cuts.’ The DXA scan also provides ratios of fat mass, including: (1) total body fat percentage; (2) android fat percentage; (3) gynoid fat percentage; (4) trunk:total fat ratio; (5) legs:total fat ratio; (6) limbs:total fat ratio; (7) android:gynoid fat ratio. Further, the proportion of android fat relative to total fat mass (P android = android fat/total fat × 100) was calculated to compare fat deposition in the abdominal region between the study groups.
All statistical analyses were conducted using SPSS software for Windows (version 14.0.0, 2005; SPSS, Inc., Chicago, IL, USA). Ethnic differences in body size (i.e. stature, body mass) and also ratios calculated from anthropometry (for example, BMI) and body composition measurements (for example, body fat percentage) were determined using age-adjusted analysis of covariance for each sex. In order to control for the influence of body size, other anthropometric and body composition variables, including ΣSF and total fat tissue mass, were analysed using age- and stature-adjusted analysis of covariance. Anthropometric and body composition variables were transformed to normalise the data before analysis wherever necessary using natural logarithms. The effect size for variables that showed significant differences between ethnic groups was also calculated using Cohen's d using the equation (M 1 × M 2/sdpooled where M = mean, and ![]() . Proportions of overweight and obesity were determined using age- and sex-specific Cole et al. criteria(Reference Cole, Bellizzi and Flegal17) and ethnic differences in prevalence of overweight and obesity were compared using the χ2 test. Furthermore, ethnic differences in relationships between body fat variables from DXA and selected anthropometric indices were determined using the general linear model. Body fat variables used in the analysis were: (1) total fat tissue mass and (2) abdominal fat tissue mass which was derived from android ROI; anthropometric variables used in this analysis included body mass, BMI, ΣSF, ΣTrunkSF, abdominal circumference and AHtR. Age and ethnicity (1 for Indigenous and 0 for Caucasians) were included as covariates to examine their influences on the relationships. Considering a previous suggestion that application of ratios may not be useful to define obesity(Reference Goran, Allison and Poehlman18), relationships were assessed using absolute mass instead of body fat percentage or android fat percentage. The equations were proposed with adjusted correlation coefficients (R ad2) and standard error of estimates (see).
. Proportions of overweight and obesity were determined using age- and sex-specific Cole et al. criteria(Reference Cole, Bellizzi and Flegal17) and ethnic differences in prevalence of overweight and obesity were compared using the χ2 test. Furthermore, ethnic differences in relationships between body fat variables from DXA and selected anthropometric indices were determined using the general linear model. Body fat variables used in the analysis were: (1) total fat tissue mass and (2) abdominal fat tissue mass which was derived from android ROI; anthropometric variables used in this analysis included body mass, BMI, ΣSF, ΣTrunkSF, abdominal circumference and AHtR. Age and ethnicity (1 for Indigenous and 0 for Caucasians) were included as covariates to examine their influences on the relationships. Considering a previous suggestion that application of ratios may not be useful to define obesity(Reference Goran, Allison and Poehlman18), relationships were assessed using absolute mass instead of body fat percentage or android fat percentage. The equations were proposed with adjusted correlation coefficients (R ad2) and standard error of estimates (see).
Results
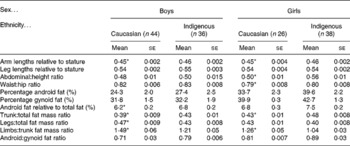
Table 1 shows demographic information of the study groups. Caucasian girls were significantly (P < 0·05) younger than their Indigenous counterparts; however, after controlling for age, no ethnic differences in mean stature, body mass, BMI and body fat percentage were observed. After adjusting for age and stature, body composition variables obtained from DXA, which included bone mineral content, bone mineral density and total and android fat tissues, as well as ΣSF and ΣTrunkSF from anthropometry, were comparable between ethnic groups. However, using the Cole et al. (Reference Cole, Bellizzi and Flegal17) BMI criteria, a significantly greater proportion of Indigenous girls were classified as overweight (Caucasian, 7·7 %; Indigenous, 39·5 %) and obese (Caucasian, 0 %; Indigenous, 23·7 %). These differences were not evident in boys. The mean somatotype for Caucasian boys was balanced mesomorph and for Indigenous boys, endomorphic mesomorph, a physique with greater fat deposition in the latter group. In girls, both groups had a mean somatotype of mesomorphic endomorph, although Indigenous girls showed a greater endomorphy.
(Mean values with their standard errors and ranges)

* Value was significantly different from that of the Indigenous girls after controlling for the effects of age and stature (P < 0·05).
† One Caucasian boy declined to have his iliac crest skinfold thickness measured; therefore forty-three Caucasian boys were included in sum of skinfolds and sum of trunk skinfolds.
‡ Endomorphy (relative plumpness), mesomorphy (relative muscularity) and ectomorphy (relative linearity) components.
Ethnic differences in subcutaneous fat distribution and other anthropometric variables after adjustment for age and stature are shown in Figs. 1–3. Despite a tendency for higher skinfold measures in Indigenous children, the only significant difference was for subscapular skinfold thickness in girls (P < 0·05) (Fig. 1). Indigenous girls also showed significantly greater (P < 0·05) trunk circumferences (Fig. 2). Indigenous children also showed significantly greater (P < 0·05) forearm lengths (radiale–stylon and midstylion–dactylion) (Fig. 3). The larger frame size of Indigenous girls was confirmed by longer acromiale–radiale measures and wider biacromial and bi-iliocristal breadths (P < 0·05). All significant variables in Indigenous girls showed medium to large effect sizes, between 0·56 (midstylion–dactylion length) and 0·83 (subscapular skinfold and waist circumference) using Cohen's d. In boys, the effect size was smaller (Cohen's d = 0·2).
Ethnic differences in age- and stature-corrected skinfolds. (![]() ), Caucasian boys (n 44); (□), Indigenous boys (n 36); (
), Caucasian boys (n 44); (□), Indigenous boys (n 36); (![]() ), Caucasian girls (n 26); (■), Indigenous girls (n 38). Values are means, with standard errors represented by vertical bars. One Caucasian boy declined to have his iliac crest skinfold thickness measured; therefore forty-three Caucasian boys were included for iliac crest. * Mean value was significantly different from that of the Caucasian girls after controlling for the effects of age and stature (P < 0·05).
), Caucasian girls (n 26); (■), Indigenous girls (n 38). Values are means, with standard errors represented by vertical bars. One Caucasian boy declined to have his iliac crest skinfold thickness measured; therefore forty-three Caucasian boys were included for iliac crest. * Mean value was significantly different from that of the Caucasian girls after controlling for the effects of age and stature (P < 0·05).

Ethnic differences in age- and stature-corrected circumferences. (![]() ), Caucasian boys (n 44); (□), Indigenous boys (n 36); (
), Caucasian boys (n 44); (□), Indigenous boys (n 36); (![]() ), Caucasian girls (n 26); (■), Indigenous girls (n 38). Values are means, with standard errors represented by vertical bars. * Mean value was significantly different from that of the Caucasian girls after controlling for the effects of age and stature (P < 0·05).
), Caucasian girls (n 26); (■), Indigenous girls (n 38). Values are means, with standard errors represented by vertical bars. * Mean value was significantly different from that of the Caucasian girls after controlling for the effects of age and stature (P < 0·05).

Ethnic differences in age- and stature-corrected lengths and bone breadths. (![]() ), Caucasian boys (n 44); (□), Indigenous boys (n 36); (
), Caucasian boys (n 44); (□), Indigenous boys (n 36); (![]() ), Caucasian girls (n 26); (■), Indigenous girls (n 38). Values are means, with standard errors represented by vertical bars. * Mean value was significantly different from that of the Caucasian group of the same sex after controlling for the effects of age and stature (P < 0·05).
), Caucasian girls (n 26); (■), Indigenous girls (n 38). Values are means, with standard errors represented by vertical bars. * Mean value was significantly different from that of the Caucasian group of the same sex after controlling for the effects of age and stature (P < 0·05).

Ethnic differences in anthropometric and body composition ratios are shown in Table 2. As seen in Fig. 3, Indigenous children had longer arms relative to stature compared with Caucasian children (P < 0·05; Cohen's d: boys = 1·0, girls = 0·63) and Indigenous girls had significantly (P < 0·05) greater AHtR and waist:hip ratio, suggesting greater abdominal fat accumulation. However, the effect size from the waist:hip ratio was smaller (Cohen's d = 0·22) compared with that for the AHtR (0·82). This finding of greater fat deposition in the trunk was consistent with DXA results (trunk:total fat mass ratio (P < 0·05); Cohen's d: boys = 0·67; girls = 0·99; limbs:trunk fat mass ratio (P < 0·05); Cohen's d: boys = 0·83; girls = 0·93). After adjustment for age, fat accumulation in the android ROI relative to total fat reached significance in boys (Caucasian boys, 6·2 %; Indigenous boys, 6·8 %; P < 0·05).
(Mean values with their standard errors)
* Mean value was significantly different from that of the Indigenous group of the same sex after controlling for the effect of age (P < 0·05).
The best predictive models (>93 % of variation) for total and android fat in boys and girls were obtained from ΣSF and age (Table 3). Other models which accounted for more than 70 % of the variation included combinations of age, ethnicity (for girls not boys), abdominal circumference, AHtR, body mass and BMI. The relationship between body composition variables and BMI was not influenced by age and tended to be weaker than ΣSF, abdominal circumference or AHtR. Despite the lack of ethnic influence in boys in relationships involving total and android fat, relationships between abdominal circumference and android fat tissue were consistent regardless of ethnicity in Indigenous girls who tended to have a smaller amount of total fat tissue mass at a given abdominal circumference (Fig. 4). Results also indicated that Indigenous girls were likely to have a smaller total or android fat tissue at a given AHtR calculated from the abdominal circumference.
(Adjusted correlation coefficients and standard errors of the estimate)

ΣSF, sum of eight skinfolds; AC, abdominal circumference; AHtR, abdominal:height ratio; BM, body mass; ΣTrunkSF, sum of trunk skinfolds.
† One Caucasian boy declined to have his iliac crest skinfold thickness measured; therefore forty-three Caucasian boys were available for ΣSF and ΣTrunkSF.
‡ Ethnicity: 1 = Indigenous; 0 = Caucasian.
§ Independent variables: age, ethnicity, BM, BMI, ΣSF, ΣTrunkSF, AC and AHtR.
Scatter plots of abdominal circumference and abdominal:height ratio (AHtR) using total fat and android fat tissues in Caucasian (n 26; ♦) and Indigenous (n 38; □) girls. (a) Relationship between abdominal circumference and total fat tissue. (b) Relationship between abdominal circumference and android fat tissue. (c) Relationship between AHtR and total fat tissue. (d) Relationship between AHtR and android fat tissue. While no ethnic difference in the relationship between abdominal circumference and android fat tissue was observed, Indigenous girls showed a smaller amount of total body fat at given abdominal circumference (P < 0·05). Similarly, Indigenous girls showed a smaller amounts of both total and android fat tissues at the given AHtR compared with Caucasian girls (P < 0·05).

Discussion
To the best of our knowledge, this is the first study to undertake a comprehensive anthropometric and body composition assessment on Caucasian and Indigenous children and adolescents living in an urban Australian setting. The study confirmed a striking sex difference in body composition and anthropometric indices between ethnic groups.
After adjustment for age, we found that Indigenous and Caucasian children were similar in stature and body mass. However, these findings were inconsistent with previous studies that reported significantly smaller body mass and stature in Aboriginal children(Reference Hitchcock, Gracey and Maller10, Reference Goran, Allison and Poehlman18) which may in part be attributed to a difference in geographical location of respective study cohorts. Previous studies used Aboriginal children living in rural areas where growth retardation is common(Reference Ruben and Walker19, Reference Rousham and Gracey20) due to both poor maternal nutrition(Reference Sayers and Powers21) and food availability(Reference Lee, Darcy and Leonard22). According to Barker's ‘fetal origin theory’, children who are born undernourished have a greater risk of developing obesity and related health problems(Reference Barker and Clark23), considered one of the causes of poor health status in the Indigenous population. In the present study, a greater proportion of Indigenous children were overweight or obese, consistent with previous findings that children living in urban areas tend to be larger and have higher BMI than those living in rural areas(Reference Reyes, Tan and Malina24). There is also a higher prevalence of obesity among Indigenous adults of high socio-economic status(Reference Lourenço, Santos and Orellana25) due to the nutrition transition experienced by the Indigenous population in urban areas.
The present study also confirmed that ethnic differences in anthropometry are more significant in girls than boys, with Indigenous girls having greater relative trunk circumferences and indices including AHtR and waist:hip ratio. The mean value for AHtR suggests that Indigenous girls have an abdominal circumference 10 cm greater than Caucasian girls for a given stature, indicative of a larger proportion of abdominal fat. Tendency for a greater subcutaneous fat deposition (as measured as skinfold thickness) among Indigenous children is also consistent with the higher deposition of abdominal fat subcutaneously than Caucasian children. Previous studies have reported that Caucasians and Asians are predisposed to greater visceral fat deposition than Africans(Reference Deurenberg, Bhaskaran and Lian26–Reference Kadowaki, Sekikawa and Murata29), with the present results indicative of similarity in the pattern of abdominal fat distribution in Indigenous and African populations. A significant ethnic difference in fat accumulation in the android ROI was only found in boys, which may be due to the small number of Caucasian girls and also the possibility that Indigenous girls had greater fat deposition in both the abdomen and chest.
The study also revealed ethnic differences in fat distribution between the trunk and limbs, with Caucasian children showing a lower proportion of fat in the trunk despite no ethnic differences in total tissue mass and body fat percentage. Caucasian children also showed a greater fat deposition in their limbs relative to trunk, although Indigenous children have longer arms and also comparable total tissue mass. Results also suggest that Indigenous children are likely to have a physique with leaner limbs and greater fat accumulation in the trunk than Caucasians at a given total tissue mass, consistent with results in previous studies(Reference He, Horlick and Thornton30, Reference Byrne, Weinsier and Hunter31). As effect size was calculated for ethnic differences in arm length and fat distribution ratio between the limbs and the trunk, results may suggest biologically significant physical differences.
In the present study, relationships between total and android fat tissue and commonly used anthropometric indices were also examined. Results indicate that ΣSF and abdominal circumference are useful measures of total or regional fat accumulation in both sexes. These indices also showed an influence of age, indicative that maturation significantly influences the increased fat deposition in the study population. Caucasian and Indigenous girls had a comparable amount of android fat tissue at a given abdominal circumference; however, Indigenous girls were likely to have significantly less android fat when AHtR was calculated from measured abdominal circumference. It has been suggested that AHtR or waist:height ratio may be a useful screening index for abdominal obesity across age, sex and ethnicity(Reference Ashwell and Hsieh32–Reference Kagawa, Hills and Binns34); however, the ethnic difference in the present study (despite no difference in body size) suggests caution in the use of this index in Indigenous children. Further research on ethnic differences in AHtR and abdominal fat deposition/distribution pattern, along with associations with metabolic health risks is warranted. Apart from abdominal circumference and AHtR in girls, there were no ethnic differences in relationships between common anthropometric indices, including BMI, and body composition variables in the present study. Despite ethnic differences in body fat distribution pattern it is possible to use the same cut-off points for anthropometric indices to determine metabolic health risks in both Caucasian and Indigenous children. These findings differ from an earlier study of adults(Reference Piers, Rowley and Soares9) and another in which Caucasian, Maori and Pacific Islander children living in New Zealand were compared(Reference Rush, Puniani and Valencia12).
The classification method used to identify ethnic background may also be an important factor to consider. In the present study, identification of both parents or guardians and community recognition were used to categorise the background of participants. The urban-dwelling Indigenous population is a diverse mix of different ethnic backgrounds, including Aboriginals, Torres Strait Islanders, Caucasians, Asians and South Pacific Islanders. As a result, a major limitation of the present study, and possibly one of the reasons for minimal ethnic differences in the majority of anthropometric indices and body composition variables, may be the ‘similarities’ between groups. It is also important to stress that only a small proportion of the Indigenous population has maintained their traditional lifestyle. As the definition of ‘Aboriginal’ used was consistent with that used by Australian law, we can be confident that the present results are reflective of differences in the physical characteristics between Caucasian and Indigenous children. In addition, the study provides confirmation of the applicability of the same anthropometric cut-off points for the metabolic screening of Indigenous children living in an urban setting.
Finally, this is the first study to provide comprehensive anthropometric and body composition information of Indigenous compared with Caucasian children living in urban Australia. The results confirmed the comparability of physical characteristics in boys and the presence of some distinct differences between girls of different ethnic backgrounds, including the proportion of overweight and obese. Results also indicated possible ethnic differences in fat distribution patterns including visceral–subcutaneous and trunk–extremities. However, relationships between anthropometric indices and selected body composition variables showed no ethnic influence in boys and minimal impact in girls. The findings, despite the relatively modest sample size, tentatively confirm the appropriateness of similar screening tools being used to prevent childhood obesity and children at risk of future metabolic complications. Due to the small sample size of the study as well as lack of information about socio-economic status and pubertal stages of the children, it is strongly recommended that future research should be conducted on a larger cohort with inclusion of both social and biological information.
Acknowledgements
The authors would like to acknowledge the Aboriginal and Islander Independent Community School (Murri School), particularly Mr Victor Hart, the Manager of Queensland University of Technology's Oodgeroo Unit as well as the Deputy President of the Aboriginal and Islander Independent School (Murri School), for their invaluable support in relation to engagement with the Murri School.
The study was supported by an ATN Centre for Metabolic Fitness grant.
All co-authors contributed to the preparation of the manuscript. M. K. contributed to the project design, data collection, data analysis and preparation of the manuscript. N. M. B, N. A. K. and S. P. contributed to the preparation of the manuscript and A. P. H. contributed as a supervisor and to the preparation of the manuscript.
There were no conflicts of interest in the present study to declare.


