



The Dietary Questionnaire for Epidemiological Studies version 2 (DQES v2) FFQ is a modified version of the questionnaire that was initially developed and validated in Australia in the late 1980s to measure dietary intake in a cohort study comprising men and women aged 40–69 years who were born in Australia, Greece or Italy( Reference Ireland, Jolley and Giles 1 ). At present, the DQES v2 FFQ has been validated in a cohort of Fe-deficient women( Reference Hodge, Patterson and Brown 2 ) and two healthy populations( Reference Xinying, Noakes and Keogh 3 , Reference Hebden, Kostan and O’Leary 4 ), and it is found to have relatively good agreement with a 3-d weighed food record (WFR). It classifies more than two-thirds of subjects within 1 quintile difference for all nutrients compared with a 3-d WFR( Reference Xinying, Noakes and Keogh 3 ). However, whether this FFQ can be used to measure dietary intake in adults with diabetes has not been investigated.
Under-reporting of dietary intake is well documented in people with type 2 diabetes, and it occurs to a greater extent than in the general population( Reference Samuel-Hodge, Fernandez and Henríquez-Roldán 5 , Reference Sallé, Ryan and Ritz 6 ). Sallé et al.( Reference Sallé, Ryan and Ritz 6 ) found in a study of obese subjects with diabetes that there was significant under-reporting of energy intake, measured using an estimated 3-d WFR, compared with obese non-diabetic people, and the authors suggested that reported energy intake needs to be multiplied by 2·5 to obtain an accurate estimate. There is a need to have easily administered methods of measuring dietary intake in populations with diabetes, as poor dietary quality is a risk factor for disease. People with diabetes are at a higher risk of many diseases such as CVD( Reference Juutilainen, Lehto and Rönnemaa 7 , Reference Lind, Svensson and Kosiborod 8 ), cancer( Reference Starup-Linde, Karlstad and Eriksen 9 ) and overall mortality( Reference Barr, Zimmet and Welborn 10 ), and because poor dietary intake is a modifiable risk factor much research is conducted in this area and therefore validated tools to measure dietary intake are required. The aim of this study was to determine the agreement between the DQES v2 FFQ and a 3-d WFR and 24-h urinalysis in a cohort of adults with type 1 and type 2 diabetes.
Methods
Study design
Participants were adults (≥18 years) with type 1 or type 2 diabetes who completed the online version of the DQES v2 FFQ on one occasion. In addition, one 3-d WFR and a 24-h urine sample were completed. The DQES v2 FFQ was completed before the 3-d WFR and 24-h urine sample. Once the DQES v2 FFQ was completed, participants were asked to complete the 3-d WFR and 24-h urine sample and return it to the clinic. The study was conducted in accordance with the Declaration of Helsinki, and ethics approval was obtained from the University of South Australian Human Research Ethics Committee. The trial was registered with the Australian New Zealand Clinical Trials Registry (ACTRN12613000250730).
Subjects
Subjects with type 1 or type 2 diabetes were recruited from July 2011 until December 2014 from a database of volunteers who had previously expressed an interest in or had participated in research conducted at the University of South Australia, and flyers were placed at the University of South Australia and the Royal Adelaide Hospital. The inclusion criteria were age >18 years and diagnosed type 1 or type 2 diabetes of any duration managed with diet, oral hypoglycaemic agents and/or insulin. All participants gave written informed consent.
FFQ
Participants completed the electronic version of the DQES v2 FFQ at home if they had access to the internet, or at the University of South Australia. The FFQ has been described in detail by Hodge et al.( Reference Hodge, Patterson and Brown 2 ). Briefly, this FFQ measures dietary intake during the previous 12 months and has seventy-four items, which are grouped into four categories: cereal foods, sweets and snacks; dairy products, meats and fish; fruit; and vegetables. The output provided includes raw data; nutrients computed from food without alcoholic beverages (including carotenoids and fatty acids, glycaemic index and glycaemic load); and nutrients from alcoholic beverages and food intake (amount/time)( 11 ). The Australian nutrient composition database NUTTAB95 was used for analysis of the FFQ data.
3-d weighed food record
Participants were provided with scales and asked to weigh and record everything that they consumed for any 3 d of their choice. On completion of the food record, it was checked by a dietitian/dietetics student in the presence of the participant to ensure accuracy. The food records were analysed using a computerised database of Australian foods (FoodWorks Professional Edition, version 7; Xyris Software) using the AusFoods 2007 database. Food items were aggregated into the following categories: fruit (fresh/frozen, tinned, juice), vegetables (fresh/frozen, canned), dairy products (milk, yoghurt, cheese), breads and cereals (including bread, breakfast cereal, rice, pasta), meats and alternatives (red meat, poultry, fish, pork, processed meat, tofu, eggs, nuts) and extra foods (hamburger, pizza, meat pies, chocolate, cake, ice cream, jam, biscuits, crackers, crisps, alcohol) to determine whether the FFQ could be used for food group analysis.
24-h urine sampling
A 24-h urine sample was taken on one occasion for measurement of Na and K. Urinary creatinine excretion was used to assess the completeness of the sample. Samples with a urinary creatinine excretion <6 mmol/24 h for women and 8·8 mmol/24 h for men were considered incomplete, as this is the lower limit of the laboratory’s reference range. Analysis was performed by an accredited commercial laboratory, SA Pathology. The concentration of Na, K and creatinine measured by the laboratory was converted to 24-h excretion data by multiplying the total 24-h urine volume by the concentration and adjusting this for the number of collection hours.
Anthropometric measurements
Height was measured using a stadiometer (Seca) to the nearest 0·1 cm while the participants were barefoot or wearing flat footwear. Weight was measured to the nearest 0·05 kg using calibrated electronic scales (Seca) while the participants were barefoot or wearing light footwear and wearing light clothing.
HbA1c
The participants were asked to provide the pathology report from their most recent HbA1c measurement, or the result was sourced from their general practitioner or the pathology company.
Statistical analysis
Values are presented as means and standard deviations unless otherwise stated. Data were checked for normality using Shapiro–Wilk and Kolmogorov–Smirnov values. Spearman’s correlation analysis was used to determine the correlation between the methods because the data were non-parametric. Deattenuated correlations were calculated according to the method described by Liu et al.( Reference Liu, Wilson and Craig 12 ) to take into account the day-to-day variation in the WFR data.
The level of absolute agreement between food and nutrient data obtained from the FFQ and WFR was assessed using the Bland & Altman method( Reference Bland and Altman 13 ). A significant relationship was observed between the mean difference of the methods and intake level, and therefore the data were log transformed. The results were anti-logged after analysis and the mean agreement and 95 % limits of agreement are presented as a ratio (FFQ:WFR), and can be interpreted as FFQ intake as a percentage of WFR intake, with 100 % mean agreement representing exact agreement between the methods.
The relative agreement between the two methods of measuring dietary intake was assessed by quintile classification to determine the capacity of the FFQ to rank individuals within a population. Individuals were ranked into quintiles for both methods and the percentage of participants ranked into the same quintile, ±1 quintile and 4 quintiles difference was assessed using cross-tabulations. The overall strength of the agreement between the quintile rankings was measured using weighted κ. The weighting factors were 1 for complete agreement (same quintile), 0·5 for disagreement 1 quintile apart (adjacent quintiles) and 0 for complete disagreement (opposite quintiles). Fixed bias was determined by paired samples t test conducted on the log transformed data, with P<0·05 indicating the presence of fixed bias. Proportional bias was assessed using least products regression analysis to regress log WFR intake against log FFQ intake. Significant proportional bias existed when the 95 % CI of the slope did not include 1. All of these methods were also used to determine the agreement between Na and K intake measured using the FFQ and the urinary excretion data. The method of triad as described by McNaughton et al. ( Reference McNaughton, Marks and Gaffney 14 ) was used to determine the validity of the FFQ estimates against the WFR and urinary excretion data.
Reported energy intakes between 2514 and 14 665 kJ/d were included in the analysis, as previously described by Liu et al.( Reference Liu, Willett and Stampfer 15 ). There were no participants who reported an energy intake outside of this range. To determine the level of under-reporting, the Schofield equation( Reference Schofield 16 ) was used to calculate BMR. The Goldberg method( Reference Goldberg, Black and Jebb 17 ) was applied to determine the level of under-reporting, and a ratio of <0·8 was defined as under-reporting. No participants were excluded for under-reporting; however, an analysis by under-reporting status was conducted. Independent samples t test were performed to determine whether the log mean difference (FFQ−WFR) of the dietary methods was significantly different by sex or diabetes type. All of the analysis was performed using SPSS (version 21, 2010; SPSS Inc.). Statistical significance was set at P<0·05.
Results
In all, sixty-seven participants completed the FFQ and the 3-d WFR. The characteristics of these subjects are presented in Table 1. Overall, this cohort comprises obese subjects with relatively well-controlled type 1 or type 2 diabetes (mean HbA1c 55 (sd 12) mmol/mol).
Subject characteristics (Mean values and standard deviations; numbers and percentages)
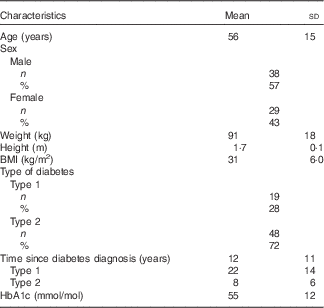
Table 2 presents the food and nutrient data measured using the FFQ and WFR, and it also contains the level of agreement between the two methods of measuring dietary intake assessed by the limits of agreement, correlation and least product regression analysis. There was no difference by diabetes type in the mean difference (log transformed) of the dietary methods. There was a statistically significant difference between male and female participants with regard to the mean difference for protein, folate, Fe, Zn and P.
Food and nutrient data measured using the FFQ and weighed food record (WFR), and the agreement between the two methods assessed using limits of agreement according to the Bland & Altman method( Reference Bland and Altman 13 ), correlations and least product regression analysis

% E, percentage of total energy.
*P<0·05.
† Presented as untransformed Bland & Altman( Reference Bland and Altman 13 ) mean agreement and limits of agreement because of the presence of zero values.
The macro-nutrients and micro-nutrients reported in the FFQ were within 20 % of the corresponding intake level reported in the WFR, with the exception of folate and vitamin E, at a group level. However, the 95 % limits of agreement indicate large variation at an individual level between the two methods. There was a weak to moderate correlation between food and nutrient intake assessed by the two methods, with only breads and cereals (P=0·10), PUFA (P=0·20), Fe (P=0·16), vitamin E (P=0·052) and the percentage of total energy from fat (P=0·06) and MUFA (P=0·30) not significantly correlated. There was a high correlation between dairy intake (r 0·77; P<0·05) measured by the two methods. When deattenuated correlations were calculated to take into account the day-to-day variation in the WFR data, the correlation coefficients were very modestly improved (see Table 2).
Evidence of fixed bias was observed for the percentage of total energy from protein, fibre, niacin, folate, riboflavin, Ca, Mg, vitamin E, alcohol, fruit, vegetables, dairy products and breads, and cereals. Proportional bias existed for energy, protein, P, vitamin C, extra foods and the percentage of energy from fat, SFA and total fat. For energy, the FFQ over-estimated intake at high levels of intake and under-estimated at lower levels (see Fig. 1). This relationship was also observed for protein and P. The opposite was shown for the percentage of total energy from fat, SFA and PUFA, vitamin C and extras. Intake was over-estimated by the FFQ at low levels of intake and under-estimated when intake was higher.
Bland & Altman plot( Reference Bland and Altman 13 ) for energy intake. WFR, weighed food record.

Under-reporting of energy intake in the WFR was observed in thirty-three participants (49 %), and thirty-nine participants (58 %) under-reported their energy intake in the FFQ. The level of under-reporting in those who under-reported their energy intake in the FFQ was 4408 (sd 1789) kJ and in the WFR it was 3950 (sd 1499) kJ. The limits of agreement remained large when the analysis was only completed for the participants (n 21) who did not under-report their energy intake by either method (data not shown).
Table 3 shows the quintile agreement for the food and nutrient data reported in the FFQ and WFR. With the exception of PUFA (49 %), Fe (51 %), niacin (58 %), vitamin E (58 %), the percentage of total energy from MUFA (52 %), and breads and cereals (55 %), >60 % of participants were ranked within 1 quintile. For fruit, vegetables and dairy products 76, 75 and 87 % of participants, respectively, were ranked within 1 quintile. The weighted κ values indicate slight to fair agreement between the two methods, and moderate agreement for fruit and dairy products( Reference Landis and Koch 18 ).
Cumulative quintile agreement for the food and nutrient data reported in the FFQ and the weighed food record

% E, percentage of total energy.
* Ranked four quintiles different.
In all, sixty-four participants completed the 24-h urine sample. Table 4 shows Na and K intake measured using the FFQ and 24-h urinalysis, and the level of agreement between the two methods. Na intake was under-estimated in the FFQ by 25 % and K was over-estimated by 5 %. There was a weak correlation observed for K intake measured by both methods, but Na intake was not correlated. Fixed bias and proportional bias were present for Na and for the Na:K ratio. The Na:K ratio assessed by the FFQ was under-estimated at higher values compared with urinary excretion data, and it was over-estimated at lower values. Greater than 64 % of participants were ranked within 1 quintile for Na and K intake (see Table 5). The weighted κ indicates slight to fair agreement( Reference Landis and Koch 18 ).
Sodium and potassium intake measured using the FFQ and 24-h urinalysis, and the agreement between the two methods assessed using limits of agreement according to the Bland & Altman method( Reference Bland and Altman 13 ), correlations and least product regression analysis (Mean values and standard deviations)

*P<0·05.
Cumulative quintile agreement between sodium and potassium intake obtained from urinary excretion and the FFQ

* Ranked four quintiles different.
The method of triads was used to determine the validity of the FFQ data against the WFR and urinary excretion data. The validity coefficients for the FFQ were 0·25, 0·56 and 0·65 for Na, K and the Na:K ratio, respectively.
Discussion
In this cohort of adults with type 1 and type 2 diabetes, it was shown that at a group level nutrient intake obtained from the DQES v2 FFQ was within 20 % of the WFR data for the majority of nutrients. However, the limits of agreement indicated large inter-individual variation, and therefore the FFQ has limited use at an individual level, but may be used at a group or population level. For the majority of foods and nutrients, >60 % of participants were classified within 1 quintile of the WFR ranking. This suggests that it is appropriate to use the DQES v2 FFQ to rank individuals with diabetes within a population. Poor agreement between urinary Na excretion and Na measured using the FFQ was observed, but there was no statistically significant difference between Na measured using the WFR and FFQ. K excretion was within 5 % of the level reported in the FFQ.
These findings suggest that the DQES v2 FFQ performs as well in a cohort of adults with diabetes as it does in the general population. The mean BMI and HbA1c of our study population is comparable with the general Australian population with diabetes( Reference Harris, Flack and Georgiou 19 ). Xinying et al.( Reference Xinying, Noakes and Keogh 3 ) found in a group of healthy subjects a poorer level of agreement for carbohydrate than we observed. There was a 31-g difference in carbohydrate intake and a 4·2 % difference in the percentage of energy derived from carbohydrate between the WFR and FFQ. In the present study, carbohydrate intake and the percentage of energy derived from carbohydrates was under-reported by 8 % (crude difference 11 g) and 3 % (crude difference 1 %), respectively, in the FFQ. In addition, Xinying et al.( Reference Xinying, Noakes and Keogh 3 ) showed that the DQES v2 FFQ classified more than two-thirds of subjects within 1 quintile of the WFR ranking, which is consistent with the findings of the current study. Hodge et al.( Reference Hodge, Patterson and Brown 2 ) have also examined the level of agreement between a WFR and the DQES v2 FFQ in a population of Fe-deficient women and similarly found nutrient intake reported in the FFQ to be within 20 % of the WFR.
We did observe fixed bias for the percentage of total energy from protein, fibre, Ca, niacin, folate, riboflavin, Mg, vitamin E, alcohol, fruit, vegetables, dairy products and breads, and cereals. Fixed bias (in the absence of proportional bias) indicates that the mean intake measured by the two methods is significantly different and can be corrected for because it is consistent across the spectrum of intake. However, proportional bias exists when there is a difference between the level of agreement of the two methods based on intake. In the present study, we saw that energy intake was over-estimated by the FFQ at high levels of intake, but under-estimated at lower levels of intake. This was also observed for P and protein intake. The percentage of total energy from fat, SFA and PUFA, vitamin C and extra foods were under-estimated by the FFQ at higher levels of intake and over-estimated at lower intake levels. Proportional bias is harder to correct for because it does not uniformly affect the whole group. Therefore, caution should be taken when interpreting absolute intake.
In this study, we investigated the agreement between food intake, categorised into the major food groups, measured by the FFQ and WFR. Relatively poor agreement was found between the methods, assessed by the Bland & Altman method( Reference Bland and Altman 13 ), especially with regard to vegetable intake, which was under-estimated in the FFQ by approximately one-third (crude difference approximately 1·6 servings according to the Australian Guide to Healthy Eating serving sizes( 20 )) and dairy intake was over-estimated by 43 % (crude difference approximately 0·5–0·6 serving). Vegetables may have been under-estimated because the FFQ includes a list of common vegetables; however, participants may be consuming the ones that are not included. The mean difference between the two methods for meats and alternatives (+9 %; crude difference approximately 0·2–1 serving), fruit (+22 %; crude difference approximately 0·2 servings) and extra foods (−3 %; crude difference approximately 0·2–1·7 servings) is acceptable and indicates that the FFQ can be used at a population level; however, caution should be taken when using the FFQ to measure breads and cereals (+41 %; approximately 0·7–2·8 servings). Despite this poor level of agreement for the absolute reported intake, there was slight to moderate quintile agreement between the methods, and >75 % of participants were ranked within 1 quintile of the respective WFR category for fruit, vegetables and dairy products. Therefore, it seems appropriate to use this FFQ to rank individuals and to determine relative intake.
Few studies have investigated the validity of food consumption measured using an FFQ, despite much research being focused on food group analysis particularly with respect to dietary quality analysis. Hebden et al.( Reference Hebden, Kostan and O’Leary 4 ) looked at the agreement between the DQES v2 FFQ and a 5-d WFR for measuring servings of fruit and vegetables in young adults and found that vegetable intake was under-estimated by the FFQ (men: 1·6 servings; women: 2 servings) and fruit was over-estimated by the FFQ (men: 0·4 servings; women: 0·1 servings), which is comparable with that observed in the present study. We have previously shown that full-fat dairy intake measured using the DQES v2 FFQ was positively associated with serum lipid species known to be of ruminant origin( Reference Petersen, Keogh and Meikle 21 ), suggesting that this FFQ can be used to estimate dairy intake. The findings of the present study showed that the DQES v2 FFQ ranked 52 % of participants within the same quintile as the WFR and 87 % were within 1 quintile; no individuals were grossly misclassified. Therefore, the DQES v2 FFQ can be used to rank adults with diabetes according to dairy intake within a population.
There was close agreement between urinary K excretion and the value obtained from the FFQ. In contrast, poor agreement was found for Na measured by urinary excretion and the FFQ. This has been shown previously in a cohort with type 2 diabetes( Reference Villani, Clifton and Keogh 22 ) and may be because salt added to cooking or at the table is not measured by the FFQ. There are no recent data for the contribution of discretionary salt to total intake; however, it has been reported that approximately 15 % of Na consumed is added to cooking or at the table( Reference James, Ralph and Sanchez-Castillo 23 ). There was a 25 % difference between the level of Na reported in the FFQ and the urinary excretion value, of which a large percentage may be accounted for by discretionary Na. Given that the difference between the FFQ and WFR was negligible (2 %; crude difference 21 mg) this is likely, because both methods do not take into account added Na.
A limitation of this study is that a 3-d WFR was only completed on one occasion and may not characterise habitual dietary intake, which the DQES v2 FFQ is designed to do. The calculation of nutrient intake from the DQES v2 FFQ is mainly derived from the Australian nutrient composition database developed in 1995 (NUTTAB95), and the food composition database used to determine nutrient intake from the WFR was developed in 2007 (AusFoods), which may account for some of the variation in nutrient intake between the two methods. The agreement between the two methods for food intake was determined by the major food groups, and therefore the capability of the FFQ to measure individual food items is not known. In addition, the reproducibility of the FFQ was not examined in this study. It must be acknowledged that the study participants were volunteers and therefore the findings may not be representative of the general population with diabetes.
In conclusion, in adults with type 1 and type 2 diabetes, it is appropriate to use the DQES v2 FFQ to measure food and nutrient intake at a group or population level and rank subjects according to intake. The DQES v2 FFQ performs similarly in a population of adults with diabetes to what has previously been observed in the general population.
Acknowledgements
The authors wish to acknowledge the following Masters of Dietetics students for their contribution to the study: Lauren Jones, Gayani Peiris and Ellen Wong. They would also like to thank Kylie Lange for her advice on the statistical analysis and the staff at the University of South Australia.
J. B. K. is a Fellow of the South Australian Cardiovascular Research Development Program funded by the Heart Foundation and the Government of South Australia. P. M. C. is supported by an NHMRC Principal Research Fellowship. K. S. P. is funded by an Australian Postgraduate Award+UniSA Rural and Isolated Top-up Scholarship. This research was jointly funded through these fellowships and the University of South Australia.
K. S. P. contributed to the study design, was involved in the data collection, conducted the statistical analysis and prepared the manuscript. J. M. S. was involved in the data collection and data analysis. J. B. K. and P. M. C. designed the study, oversaw the statistical analysis and interpretation and critically reviewed and drafted the manuscript. All of the authors critically reviewed the manuscript and approved the submitted version.
The authors have no conflicts of interest to declare.



