


1 Introduction
The articulatory consequences of different onset organisations have been extensively probed since the 1980s (Browman & Goldstein Reference Browman and Goldstein1988, Byrd Reference Byrd1995, Goldstein et al. Reference Goldstein, Nam, Saltzman, Chitoran, Fant, Fujisaki and Shen2009, Shaw et al. Reference Shaw, Gafos, Hoole and Zeroual2009, Reference Shaw, Gafos, Hoole and Zeroual2011, Hermes et al. Reference Hermes, Mücke and Grice2013, Hermes et al. Reference Hermes, Mücke and Auris2017). In a ground-breaking study exploring the articulatory kinematics of word-initial consonant sequences in American English, Browman & Goldstein (Reference Browman and Goldstein1988) observed that the mean of the midpoints of the consonantal gestures in a sequence (the C-centre) appeared to be temporally aligned to the end of following vowel (the anchor), i.e. the C-centre was at a stable distance away from the end of the following vowel, no matter how many consonants were in the word-initial position. This alignment is shown schematically in Fig. 1a, where constant duration or ‘stability’ to the anchor for different numbers of word-initial consonants is represented with a horizontal black line. As a consequence of the above temporal stability pattern, the duration between the midpoint of the rightmost consonant in the word-initial consonant sequence (the right edge) and the end of the vowel (the anchor) shortened as more consonants were present word-initially (see the shorter grey line in the case with two word-initial consonants in Fig. 1a). The observation raises the possibility that word-initial consonant sequences in English, which have traditionally been argued to form complex onsets, have a C-centre-to-anchor interval stability that is observable in the articulatory domain. This pattern of C-centre-to-anchor interval stability has since been replicated for American English (Marin & Pouplier Reference Marin and Pouplier2010), and has also been observed in a variety of languages with complex onsets: Romanian (Marin & Pouplier Reference Marin and Pouplier2014), Georgian (Goldstein et al. Reference Goldstein, Chitoran, Selkirk, Trouvain and Barry2007), Italian (Hermes et al. Reference Hermes, Mücke and Grice2013) and Polish (Hermes et al. Reference Hermes, Mücke and Auris2017). We refer the reader to work related to understanding the C-centre-to-anchor stability effect as a result of competitive coupling demands (Goldstein et al. Reference Goldstein, Byrd, Saltzman and Arbib2006, Goldstein et al. Reference Goldstein, Nam, Saltzman, Chitoran, Fant, Fujisaki and Shen2009, Nam et al. Reference Nam, Goldstein, Saltzman, Pellegrino, Marisco, Chitoran and Coupé2009, Marin & Pouplier Reference Marin and Pouplier2010).
Schematic representations of C-centre-to-anchor stability patterns (left) and right-edge-to-anchor stability patterns (right) (adapted from Shaw et al. 2009). The x-axis represents time. The anchor marks the end of the following vowel, and C1 and C2 represent word-initial consonants.

There are, however, languages which have been argued to have simplex onsets despite having word-initial consonant sequences, i.e. only the rightmost consonant in the sequence is in the onset, with the rest of the consonants syllabified separately (as appendices, according to some researchers). Such languages have been observed to have right-edge-to-anchor interval stability, wherein the last consonant in a word-initial consonant sequence is in a stable temporal relationship with the following vowel, i.e. the presence of more consonants word-initially before a prevocalic consonant does not substantially change the timing between the immediately prevocalic consonant and the anchor (the end of the following vowel). This pattern is schematically represented in Fig. 1b, where the right-edge-to-anchor interval duration remains roughly constant across different numbers of word-initial consonant sequences (see the stability of the grey line in Fig. 1b). It is also worth noting that, as a consequence of the above temporal stability pattern, the C-centre-to-anchor interval duration is longer if there are more word-initial consonants (see the longer black line with two word-initial consonants in Fig. 1b). This pattern of behaviour has been observed in Tashlhiyt Berber (Goldstein et al. Reference Goldstein, Chitoran, Selkirk, Trouvain and Barry2007, Hermes et al. Reference Hermes, Mücke and Auris2017) and Moroccan Arabic (Shaw et al. Reference Shaw, Gafos, Hoole and Zeroual2009, Reference Shaw, Gafos, Hoole and Zeroual2011).
Based on what we consider to be quite an exciting result, C-centre and right-edge alignments can coexist in the same language for different word-initial consonant sequences (Hermes et al. Reference Hermes, Mücke and Grice2013). Hermes et al. observe that some consonant sequences in Italian, i.e. those with a sufficient sonority distance between them, have C-centre-to-anchor interval stability, while other sequences (sibilant + stop and sibilant + fricative) have right-edge-to-anchor interval stability, reflecting a distinction seen in some morphophonological patterns of Italian.Footnote 1
The above results have led to the general claim that simplex onsets have right-edge-to-anchor interval stability, while complex onsets have C-centre-to-anchor interval stability. However, it is important to point out that this general claim does face challenges. Despite some morphophonological evidence suggesting that word-initial consonant sequences in Hebrew, French and German form complex onsets (Bolozky Reference Bolozky and Kaye1997, Dell Reference Dell1995 and Wiese Reference Wiese1996 respectively), the three languages appear to have a right-edge alignment, at least for some consonant sequences (Brunner et al. Reference Brunner, Geng, Sotiropoulou and Gafos2014, Pouplier Reference Pouplier, Fuchs, Weirich, Pape and Perrier2012, Tilsen et al. Reference Tilsen, Zec, Bjorndahl, Butler, L'Esperance, Fisher, Heimisdottir, Renwick and Sanker2012). However, Mücke et al. (Reference Mücke, Hermes and Tilsen2020) argue that the articulations even in such languages are consistent with a complex onset organisation, and that previous research has likely misinterpreted the relevant articulatory data. We return to this issue in the §5 and raise another possibility, based on our results in the current article.
Given the reasonably large literature on the correlation between onset organisation and temporal stability metrics in articulation, we sought to answer whether such temporal stability was also observable in acoustic data. Our interest in exploring acoustic measurements to study such stability patterns stems primarily from the fact that they are easier to collect, both in the lab and during fieldwork. However, exploring acoustic measurements for such temporal stability metrics rests on (i) the important assumption that the landmarks typically demarcating segment boundaries in the acoustic measurements are estimates of the landmarks for target attainment (a gestural plateau, in the sense of Gafos Reference Gafos2002) in the articulation, and (ii) the availability of consistent acoustic landmarks to demarcate the relevant consonantal intervals from adjacent vocalic material. Given (i) and (ii), we think that singly articulated stops, fricatives and nasals are particularly suitable for an acoustic exploration of temporal stability patterns.
In line with (i), in some of the earliest work on the C-centre-to-anchor effect Browman & Goldstein (Reference Browman and Goldstein1988) point out that the attainment of the target of the postvocalic consonant lines up with the acoustic closure of a stop. Others have adopted similar assumptions about the degree of temporal proximity between acoustic and articulatory landmarks. For example, Kühnert et al. (Reference Kühnert, Hoole and Mooshammer2006), in an electromagnetic articulography study of French onset consonants, used the acoustic burst of the postvocalic consonant as the anchor; however, such a blending of articulatory and acoustic landmarks is only possible if we assume a fair degree of temporal proximity between the gestural plateau landmarks identified from the two measures for the relevant segments. Consequently, given that the C-centre and right-edge landmarks are defined with respect to the midpoints of consonants, which are themselves midpoints of gestural plateaus, the midpoints of segments that satisfy (i) and (ii) above in the acoustic signal should roughly line up with the corresponding articulatory measurements.
In this article, we present three experiments that explore the temporal stability metrics of word-initial consonant sequences in American English and Jazani Arabic, using acoustic techniques. In Experiment 1 (§2), we replicate previous findings that word-initial consonant sequences in American English indeed have C-centre stability, suggesting in line with phonological theories of syllable structure that they form complex onsets. In Experiment 2 (§3), we show that, in contrast to American English, word-initial consonant sequences in Jazani Arabic, a little-studied dialect of Saudi Arabian Arabic, show right-edge stability. Taking inspiration from the different temporal stability patterns in Italian (Hermes et al. Reference Hermes, Mücke and Grice2013), in Experiment 2 we also investigate whether different word-initial consonant sequences (in this case, those differing in terms of the sonority profile) have different temporal stability patterns, and again find (consistent with the phonological evidence in the language) that there is right-edge-to-anchor interval stability across all types of word-initial consonant sequences. In Experiment 3 (§4), we address a potential confound in Experiment 2 (relating to the possibility of resyllabification of the initial consonant in the consonant sequence) by removing the carrier phrase that led to the potential confound, and show that there is still right-edge-to-anchor stability for the word-initial consonant sequences in Jazani Arabic. Finally, we discuss the contributions of this paper (§5).
2 Experiment 1: C-centre effects in American English
It has been long acknowledged that American English (like most English dialects), allows complex onsets, and therefore word-initial consonant sequences are themselves likely to be complex onsets (Kahn Reference Kahn1976, Selkirk Reference Selkirk, van der Hulst and Smith1982); consequently, word-initial consonant sequences are not the result of a word-initial appendix, as in languages such as Tashlhiyt Berber (Goldstein et al. Reference Goldstein, Chitoran, Selkirk, Trouvain and Barry2007, Hermes et al. Reference Hermes, Mücke and Auris2017) and Moroccan Arabic (Shaw et al. Reference Shaw, Gafos, Hoole and Zeroual2009, Reference Shaw, Gafos, Hoole and Zeroual2011). In the interests of clarity and drawing a contrast to the patterns in Jazani Arabic, we present two arguments that suggest that complex onsets are allowed in American English. First, as Borowsky (Reference Borowsky1986) points out, in monomorphemic words of English there are strong constraints on intervocalic consonant sequences, and the patterns suggest that there is at most a single coda consonant in such positions (barring the possibility of sequences of homorganic consonants). Most relevant to current purposes is the observation that some of the consonant sequences that can appear word-initially can also appear after a consonant in such intervocalic positions within monomorphemic words (e.g. minstrel, conspicuous). Given that there is at most a single coda consonant in such cases, the rest of the consonants must form part of the following onset.
Second, given the pattern that aspiration appears syllable-initially (Kahn Reference Kahn1976) or foot-initially (Davis Reference Davis1999, Ahmed et al. Reference Ahmed, Andersson, Vaux, Aarts, McMahon and Hinrichs2020) in American English, the fact that post-[s] stops preceding stressed vowels are unaspirated suggests that they are not syllable or foot-initial (e.g. [kənˈspɪkjuəs] conspicuous, [ɪnˈspɑɪɚ]Footnote 2 inspire, but [ɪmˈpʰækt] impact). Both the above arguments suggest that American English allows complex onsets.
With the above discussion as backdrop, we turn to a replication of previous articulatory studies on American English. As was pointed out earlier, word-initial consonant sequences in American English have been shown to have C-centre-to-anchor interval stability. Consistent with this observation, we show that similar stability is observable through acoustic measurements. The results establish the fact that even acoustic measures can be used to observe C-centre stability in American English.
2.1 Methods
2.1.1 Participants. Ten undergraduate students at Michigan State University participated in the experiment (mean age = 21, range = 19–31; 4 male, 6 female). They received extra course credit for their participation in the experiment.
2.1.2 Materials
All the test words were of the form (C1)C2VC3, and were presented as pairs differing in the presence or absence of an initial C1, which was always [s], as in (1). We used fricatives and nasals as C1 and C2, as their boundaries are easier to demarcate consistently on waveforms and spectrograms compared to other segments such as stops (which are problematic to annotate word-initially) and liquids (which are difficult to separate from the adjacent vowel in many instances in American English, particularly in coda position). The word-final consonant was a voiceless stop, again to ensure that identifying the boundary of the preceding vowel on the waveform and spectrogram was straightforward.
-
(1)


A reviewer and the associate editor point out two potential problems with the assumption that word-initial [s] + nasal consonant sequences form complex onsets; we consider each separately. First, there appears to be a general absence of morpheme-internal [s] + nasal sequences in English after a coda consonant. This is a fair concern; however, we would like to point out that morpheme-internal [s] + nasal sequences seem to be quite underrepresented even after vowels, where the [s] could be analysed to be part of a preceding syllable as a coda (e.g. dismay) – many cases found in the CMU dictionary (Weide Reference Weide1994) appear to be names (e.g. Cessna, Bosma), some of which appear to have a plausible morphological parse (e.g. Hussman, Gusman). This means that it is quite difficult to interpret the absence of morpheme-internal [s] + nasal sequences following consonants as English disallowing [s] + nasal onsets. Furthermore, there are in fact reasonably common words which do have such a cluster (persnickety, parsnip). It is noteworthy that the words never undergo any altered pronunciation that might have indicated any invalid syllabic structureFootnote 3 – compare this to Antarctic and Arctic, where the medial [k] is often deleted (Borowsky Reference Borowsky1989). Finally, many foreign names have been borrowed into English with no segmental change (deletion or epenthesis), despite having such word-internal sequences following a medial coda consonant (e.g. Boersma, Braaksma, Elsner, Exner, Fitzner, Wexner) – many of these do not have a reasonable fake morphological parse. Contrast this with other non-English names that violate English phonotactics (e.g. Kvitova → [kəˈvɪɾəvə], Zverev → [zəˈvɛɾəv]). This suggests to us that English speakers have no problem with [s] + nasal onsets morpheme-medially, and that the lack of such sequences in the native English lexicon might be due to diachronic factors.
Second, there is some experimental work that appears to suggests that [s] + sonorant sequences are syllabified differently from other obstruent + sonorant sequences in syllable break experiments (Treiman et al. Reference Treiman, Gross and Cwikiel-Glavin1992). While the former are typically broken up by a syllable break in such tasks, the latter are usually parsed in the same onset. We would like to point out that such syllable break tasks assume a fair amount of meta-linguistic awareness on the part of the participant, and are often confounded with word-edge and morpheme-edge judgements (Steriade Reference Steriade, Fujimura, Joseph and Palek1999, Harris Reference Harris, Local, Ogden and Temple2004, Durvasula & Huang Reference Durvasula and Huang2017). Furthermore, a careful look at Treiman et al.'s (1992) results suggests there is a lot of variation in the case of [s] + sonorant sequences, with many responses parsing the two in the same onset. Interestingly, Treiman et al. (Reference Treiman, Gross and Cwikiel-Glavin1992) found that the /st sp sk/ sequences in /VˈsTV/ contexts (where V = vowel and T = voiceless stop) were also broken up by participants into separate syllables at similar rates as in [s] + sonorant cases. If the syllable break results are interpreted as evidence of the segments being in different syllables, then that interpretation contradicts the inference from the aspiration facts in American English. As mentioned earlier, the fact that the post-[s] stops preceding stressed vowels are unaspirated suggests that the stops are not syllable or foot-initial. Therefore, the [s] in /VˈsTV/ contexts could not belong to the preceding syllable, based on the distribution of aspiration. Finally, the [s] + sonorant cases that Treiman et al. (Reference Treiman, Gross and Cwikiel-Glavin1992) studied also include /sl/. Note that these sequences do appear after coda consonants in monomorphemic words (e.g. parsley, Wexler, Oxley, Lindsley), which suggests that they are likely in onset clusters despite the patterns observed in syllable break tasks. The preceding discussion suggests some caution should be employed in interpreting the experimental results from syllable break tasks as direct evidence of syllable structure.
To reiterate, we think it is reasonable to maintain the assumption that [s] + nasal sequences can indeed form onset clusters in American English. Furthermore, crucial for the purposes of the current experiment is the fact that Marin & Pouplier (Reference Marin and Pouplier2010) observe that word-initial /sm/ sequences have similar C-centre-to-anchor interval stability patterns to those of word-initial /st sk/ sequences.
2.1.3 Procedure
The participants produced ten repetitions of each of the words in (1) in the carrier phrase ‘Say _ here’. The stimuli were presented in pseudo-random order, such that each repetition consisted of a randomised presentation of the list of stimuli in (1). Therefore, each participant produced a total of 240 sentences (24 sentences × 10 repetitions), of which the 80 sentences containing the test words were analysed in this study (8 test sentences × 10 repetitions). Psychopy (Peirce et al. Reference Peirce, Gray, Simpson, MacAskill, Höchenberger, Sogo, Kastman and Lindeløv2019) was used for stimulus presentation, and the responses were also recorded in Psychopy with a Logitech USB desktop microphone (frequency response 100 Hz–16 kHz) at a sampling rate of 44 kHz (16-bit resolution; 1-channel). The participants had three seconds from the onset of the stimulus presentation to pronounce the whole sentence. There was a brief practice phase (3 sentences × 1 repetition) for the participants to get used to the task.
2.1.4 Measurements
The recordings were first automatically forced aligned using the Penn Forced Aligner (Yuan & Liberman Reference Yuan and Liberman2008), and then the annotations were manually corrected by one of the authors in Praat (Boersma & Weenink Reference Boersma and Weenink2020). The annotation contained three tiers: a phone tier, a word tier and a quality tier. The quality tier marked a token as ‘bad’ if the target word was misread or if there was any hesitation during the production; otherwise it was left empty. For each token, we focused on annotating the word-initial consonants (separately, if there was more than one) and the vowel.
The onset of the [s], which was always word-initial (if present), was identified as the point of appearance of a noisy spectrum with a high-frequency spectral peak and the disappearance of formants from the preceding vowel of the carrier phrase. The offset of the [s], which was also always the onset of a nasal consonant, was identified as the point of disappearance of a noisy spectrum with a high-frequency spectral peak, or the point of appearance of a frequency band with weakened intensity (i.e. an anti-formant) in the spectrogram and periodic energy in the waveform. In the case of a word-initial nasal, the onset was identified as the point of appearance of an anti-formant, and the appearance of a flattened waveform (Pruthi & Espy-Wilson Reference Pruthi and Espy-Wilson2014). The offset of the nasal was also always the onset of a vowel, and was identified as the point of appearance of strong formant structure and substantially higher intensity in the waveform compared to preceding acoustic material. The offset of a vowel was determined to be the point where the formant structure in the spectrogram and the periodic energy in the waveform weakened considerably. For each of the above cases, in case of inconsistency, we prioritised the first cue listed.
We subsequently used a Praat script to extract the two intervals of interest for each word: (i) the duration from the midpoint of the rightmost prevocalic consonant to the end of the following vowel (henceforth right-edge-to-anchor), and (ii) the duration from the mean of the midpoints of the word-initial consonants to the end of the following vowel (henceforth C-centre-to-anchor).
A sample of a final corrected annotation is shown in Fig. 2. For expository convenience, the crucial temporal landmarks (C-centre, right edge, anchor) are indicated, and IPA representations are used. To establish which interval has the most stability, we need to see if there is a difference in the interval measures (right edge, C-centre) between words with single and two initial consonants. More specifically, if there is no clear difference in the C-centre-to-anchor intervals between the two types of words, but the right-edge-to-anchor interval is longer for the former than the latter, then we can infer C-centre-to-anchor interval stability. This in turn would suggest that the word-initial consonant sequence forms a complex onset. In contrast, if there is no clear difference in the right-edge-to-anchor intervals between the words with two initial consonants and those with a single initial consonant, but the C-centre-to-anchor interval is longer in words with a single initial consonant, we can infer right-edge-to-anchor interval stability. This in turn would suggest that the initial consonant in a word-initial consonant sequence might be a word-initial appendix.
Sample annotation of the word snap. The crucial temporal landmarks – C-centre, right edge and anchor – are indicated in the figure.

Following Shaw et al. (Reference Shaw, Gafos, Hoole and Zeroual2009, Reference Shaw, Gafos, Hoole and Zeroual2011), we also calculated the relative standard deviation (RSD) of the durations for each pair of words, using the formula in (2) to estimate the spread in the durations. To measure the RSD for each pair of words for each participant, we used all the repetitions of the pair produced by that participant. Note that we used RSD instead of standard deviation (SD) to control for the fact that longer durations are typically associated with larger variance; an uncorrected measure such as standard deviation or variance would have an inherent bias against measures involving longer durations (in this case C-centre-to-anchor) as opposed to those involving shorter durations (right-edge-to-anchor).
-
(2)

2.2 Results
All the visualisation and data analysis in this article were done in R (R Development Core Team 2014), particularly using the tidyverse suite of packages (Wickham Reference Wickham2017).Footnote 4
A total of 22 token productions (22/800 = 2.75%) were annotated as ‘bad’ (i.e. the target word was misread or there was some hesitation during the production) and were therefore discarded, leaving 778 token productions to be used in the analysis. As can be seen in Fig. 3, there is no clear difference between the C-centre-to-anchor interval durations in the two types of words, but the right-edge-to-anchor interval duration is longer for words with a single initial consonant than for those with two initial consonants. In fact, the same pattern holds for each speaker in the experiment. This suggests that the C-centre-to-anchor interval was stable across onsets with differing number of consonants for each participant, but the right-edge-to-anchor interval duration was not.
Raw durations for (a) the C-centre-to-anchor interval and (b) the right-edge-to-anchor interval for each of the American English speakers (S1–S10).

As discussed above, we also calculated RSDs, which are presented in Fig. 4. Again, the fact that the overall RSDs appear to be lower for the C-centre-to-anchor interval suggests that the C-centre-to-anchor interval is a more stable interval than the right-edge-to-anchor interval. Indeed, the difference in RSDs between the two interval durations holds for all speakers and all items in the study. This suggests that the observed stability pattern is likely a consistent fact about the language, and is not restricted to a few participants or a few pairs of test items.
Overall RSDs for each interval (C-centre-to-anchor and right-edge-to-anchor) for the American English speakers.

We then analysed the data statistically. All the statistical analyses in this article involved fitting linear mixed-effects models using the lme4 package (Bates et al. Reference Bates, Mächler, Bolker and Walker2015). The dependent variable used was RSD, and the independent variable considered was Interval (C-centre-to-anchor, right-edge-to-anchor; baseline = C-centre-to-anchor).
Following Barr et al. (Reference Barr, Levy, Scheepers and Tily2013), we treated the random-effects structure as the largest one that converged. For the current experiment, the random-effects structure included random intercepts of Speaker and Word pair, and a by-speaker random slope of Interval – in the model comparison this random-effects structure was used for all the models, to identify the one with the best fixed-effects structure. For model comparison, the minimal fixed-effects structure considered was one with just an intercept, and the maximal fixed-effects structure included both an intercept and interval. Consequently, in the case of the current experiment, the model comparison was trivial; however, we performed it in order to have the same statistical procedure across all three experiments.
Using the above method, we identified the best model that could account for the data, using likelihood ratio tests and a comparison of the Akaike Information Criterion (AIC) for the different models. Note that AIC measures model fit while controlling for overparameterisation; a lower AIC value suggests a better model (Akaike Reference Akaike1974, Burnham et al. Reference Burnham, Anderson and Huyvaert2011). The best model identified included a fixed effect of Interval, as in Table I. Once the best model was identified, we looked at the fixed effects of the best model.
Model comparison for the RSDs in Experiment 1. The AIC value for the best model is given in bold.

The best model, namely the one with a fixed effect of Interval, is shown in Table II. As already noted, the baseline of comparison for each of the effects is the C-centre-to-anchor interval. Therefore, the positive estimate for the right-edge-to-anchor interval suggests that it has higher RSDs, and therefore more instability, than the baseline (C-centre-to-anchor interval). Consequently, the results suggest that the right-edge-to-anchor interval is less stable than the C-centre-to-anchor interval.
The best mixed-effects linear regression model for the American English speakers in Experiment 1.

The results of the current experiment are consistent with previous production experiments on American English that were based on articulatory measurements (Browman & Goldstein Reference Browman and Goldstein1988, Marin & Pouplier Reference Marin and Pouplier2010). The C-centre-to-anchor interval was in fact the most consistent across different numbers of onset consonants, for all the participants and test pairs. The results are not only a replication of results in prior research, but also support the claim that acoustic methods can be used to probe syllable structure.
In Experiments 2 and 3, we employ this technique to probe the same issue in a language with a different syllabic organisation of word-initial consonant sequences, Jazani Arabic.
3 Experiment 2: right-edge effects in Jazani Arabic
As mentioned in §1, in contrast to the C-centre-to-anchor interval stability observed in American English, languages with simplex onsets such as Tashlhiyt Berber and Moroccan Arabic have been observed to have right-edge-to-anchor interval stability, wherein the last consonant in a word-initial consonant sequence is in a stable temporal relationship with the following vowel; the presence of further consonants before the prevocalic consonant does not substantially change the timing between the prevocalic consonant and the anchor, i.e. the end of the following vowel (Goldstein et al. Reference Goldstein, Chitoran, Selkirk, Trouvain and Barry2007, Shaw et al. Reference Shaw, Gafos, Hoole and Zeroual2009, Reference Shaw, Gafos, Hoole and Zeroual2011, Hermes et al. Reference Hermes, Mücke and Auris2017). In this experiment, we show that similar right-edge-to-anchor interval stability can be observed through acoustic measurements in Jazani Arabic, a language with simplex onsets.
Jazani Arabic is a dialect of Arabic spoken in the region of Jazan, the south-westernmost part of Saudi Arabia. The dialect is heavily influenced by Yemeni Arabic, both because of its geographic proximity to Yemen and because of the political history of the area (Vasilliev Reference Vasilliev2000, Watson Reference Watson2002, Reference Watson2011, Ruthan Reference Ruthan2020). While there is extensive research on the phonology and dialectology of Arabic dialects spoken in Saudi Arabia and Yemen (e.g. see Watson Reference Watson2002, Reference Watson2011), there is little work on Jazani Arabic. The following discussion of the relevant facts of Jazani Arabic is based on Hamdi (Reference Hamdi2015), Lowry (Reference Lowry2020) and Ruthan (Reference Ruthan2020).
Crucial for current purposes is the fact that Jazani Arabic has word-initial consonant sequences, as shown in (3). All combinations of sonority rises and falls are possible in these initial sequences: sonority rises (a), sonority plateaus (b) and sonority falls (c). The language even allows glide + obstruent word-initial sequences (d), perhaps the most extreme falling sonority word-initial consonant sequences possible, given the inventory of the language.
-
(3)

The word-initial consonant sequences appear to form as a result of the deletion of a word-initial [ɁV] sequence, when compared to Modern Standard Arabic, e.g. [Ɂɪsmaʕ] → [smaʕʕ] and [Ɂʊstæːð] → [stæːð] ‘teacher.m.sg’. However, we are not entirely sure of the correct analysis, particularly because it is unclear if the deletion process is synchronic or diachronic.
In an extensive study of word-initial and word-final consonant sequences in Arabic dialects, Kiparsky (Reference Kiparsky, Féry and van de Vijver2003) suggests that many Arabic dialects, spoken in non-contiguous areas ranging from regions in northern Africa to Iraq, allow for a word-initial appendix. He further suggests that in such dialects, all but the immediately prevocalic consonant are outside the syllable, and form prosodic word-level appendices. We follow Kiparsky in suggesting the same representation for word-initial consonant sequences in Jazani Arabic, as in (4). (We omit the moraic information additionally proposed by Kiparsky, in order to focus on the segmental syllabic affiliations that are crucial for the current article.)
-
(4)

One argument in favour of this syllabic parse is based on the consonantal sequences found intervocalically. Recall from the discussion in §2 that American English generally allows observed word-initial consonant sequences in intervocalic position even after another consonant in monomorphemic words. In contrast, in Jazani monomorphemic words, the word-initial consonant sequences in (3) are not possible after another consonant (5a.i), though they are found after a vowel (5a.ii).
-
(5)

Further evidence for the proposed syllable structure comes from the fact that even across morpheme boundaries within the same word, the maximum number of consonants in an intervocalic sequence is two, as shown in (5b). This pattern is nicely accounted for if we assume that Jazani Arabic allows at most a single coda consonant, and, crucially, at most a single onset consonant.
Finally, given the restrictions imposed by the Sonority Sequencing Principle (Sievers Reference Sievers1881, Jespersen Reference Jespersen1904, Hooper Reference Hooper1976, Steriade Reference Steriade1982, Kenstowicz Reference Kenstowicz1994) in favour of rising sonority onsets, the presence of all three logically possible sonority profiles word-initially, showing the lack of clearly sonority-based restrictions, is evidence in favour of a word-initial appendix. This in turn suggests that the Sonority Sequencing Principle is not violated by the word-initial sequences, because only the last consonant in such sequences is an onset.
It is worth noting that Jazani, like other Arabic dialects, also has word-final consonant sequences; these are perhaps best analysed as involving word-final appendices (Kiparsky Reference Kiparsky, Féry and van de Vijver2003). For expository convenience and in order to focus on the word-initial consonant sequences, we do not discuss these further, or represent them in (4).
We believe investigating languages like Jazani Arabic is important in ensuring that we have an understanding of which cross-linguistic patterns of temporal stability are due to syllabic structure considerations and which are due to phonetic properties of the relevant consonantal sequences. Relatedly, given that Jazani Arabic does not allow complex onsets for any word-initial consonant sequences, we are able to create word pairs containing consonantal sequences which are as close to the English counterparts as possible. Therefore, as far as is feasible in any cross-linguistic comparison, we are able to control within our experiments for the possibility that some temporal stability variation might in fact be due to the specific sequences tested.
Given that Jazani Arabic has a simplex onset organisation, we conducted a production experiment to investigate if the word-initial consonant sequences in the language show right-edge-to-anchor interval stability in acoustic measurements.
3.1 Methods
3.1.1 Participants
Seven Jazani Arabic speakers participated in the study (mean age = 32, range = 30–35; all male). The participants were recruited by one of the authors in Samtah, in the Jazan province of Saudi Arabia.
3.1.2 Materials
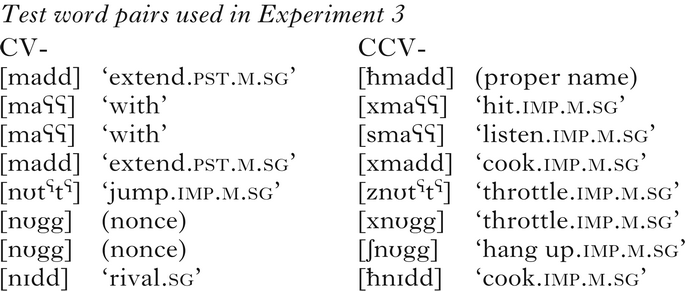
As in Experiment 1, pairs of test words were constructed such that each word in a pair differed only in the number of the initial consonants (e.g. [zɪll, nzɪll]). The consonants used were the nasals [m n] and the fricatives [f s z ʃ x ħ]. For each word with a single initial consonant (CVCC), there was another word with the same sequence and an additional consonant present word-initially (CCVCC); these formed a single pair of test words. Furthermore, there were three sets of such pairs of words, such that the words with the two initial consonants (CCVCC) could be classified based on their sonority profiles: rising, plateau or falling. There were no filler words in this experiment, as the stimulus set was sufficiently large and varied. There were 36 pairs of words repeated six times each (36 × 2 × 6 = 432 stimulus presentations per participant). The set included nonce words, because perfect minimal pairs were not always possible. For analysis, we coded any pair containing at least one nonce word as a nonce word pair. The full list is shown in (6). Speakers produced all the test words in the carrier phrase [Ɂɪnta _ marah θanjah] ‘You _ again’. Despite the carrier phrase resulting in some unacceptable sentences in some cases, none of the participants expressed any confusion during the task. Their productions also seemed quite fluent.
-
(6)

3.1.3 Procedure
The experiment was conducted in a quiet room. The stimulus sentences were presented to the participants one at a time in standard Arabic orthography, using Microsoft PowerPoint; each slide had a single sentence in the middle of the screen. The stimulus sentences were presented with appropriate vowel diacritics, so that the speaker knew what the corresponding vowels were.
The instructions were given verbally in Jazani Arabic, to encourage participants to pronounce the words in their own dialect. Furthermore, the participants were explicitly told to read the sentences in their dialect (Jazani). Finally, the initial instructions also used Jazani-specific morphology where possible, to encourage Jazani pronunciations – the morphemes [ʃa] ‘will’ and [Ɂam] ‘the’ were used. (The Modern Standard Arabic variants are [sa] and [Ɂal] respectively.)
The participants were given three sentences as practice. Participant pronunciations were recorded with Audacity,Footnote 5 using a Logitech USB desktop microphone (frequency response 100 Hz–16 kHz) at a sampling rate of 44 kHz (16-bit resolution; 1-channel).
3.1.4 Measurements
The recordings were annotated manually by one of the authors in Praat. Note that, unlike in Experiment 1, we did not use a pre-existing forced aligner, since one did not exist. However, the acoustic cues used to manually identify the segments were similar to the cues used in Experiment 1 to correct the forced aligned annotations; therefore, we believe the two annotations are comparable. More specifically, the same diagnostics as in Experiment 1 were used to identify the onsets and offsets of the nasal consonants and the vowels. For the identification of the fricative onsets and offsets, the diagnostics were generalised to include non-alveolar fricatives, i.e. the fricative boundaries were identified by the presence of a noisy spectrum and the absence of clear vowel formant structure. Furthermore, given that the primary hypothesis was related to the difference in C-centre and right-edge interval durations between words with a single word-initial consonant and those with two word-initial consonants, only the consonant number and presence of a vowel were annotated. A sample annotation for the word [msakk] is shown in Fig. 5. As with the sample English annotation in Fig. 2, the crucial temporal landmarks are indicated.
Sample annotation of the word [msakk]. The crucial temporal landmarks – C-centre, right edge and anchor – are indicated in the figure.

Subsequently, in a manner identical to Experiment 1, we used a Praat script to extract the relevant durations and then calculate the two intervals of interest for each word: right-edge-to-anchor and C-centre-to-anchor. Finally, we calculated the RSDs for the two intervals.
3.2 Results
In Fig. 6, we present the raw durations for each of the participants for each of the intervals.
Raw durations for (a) the C-centre-to-anchor interval and (b) the right-edge-to-anchor interval for each of the Jazani Arabic speakers (S1–S7) in Experiment 2.

Visual inspection suggests that the durations of the right-edge-to-anchor interval for each speaker are similar for words with one or two initial consonants. In contrast, the C-centre-to-anchor interval durations for each speaker are substantially longer for words with two consonants. This suggests that the language has right-edge-to-anchor interval stability, and consequently has a word-initial appendix.
As in Experiment 1, we looked at RSDs to probe the stability of the different intervals. Consistent with the visual inspection of the raw durations, the right-edge-to-anchor interval durations had lower RSDs overall than the right-edge-to-anchor interval durations for each sonority profile, as shown in Fig. 7.
Overall RSDs for each interval (C-centre-to-anchor and right-edge-to-anchor) for the Jazani Arabic speakers in Experiment 2.

Further examination showed that the right-edge-to-anchor interval was more stable for all seven speakers, and for all the pairs of words tested. Furthermore, the real word status of the word pairs did not make a difference to this pattern, in which the right-edge-to-anchor interval was observed to have lower RSDs overall than the C-centre-to-anchor interval.
As discussed for Experiment 1, we fitted linear mixed-effects models to analyse the data statistically. The dependent variable was again RSD, and the independent variables considered were Interval (C-centre-to-anchor, right-edge-to-anchor; baseline = C-centre-to-anchor), Sonority profile (Rising, Falling, Plateau; baseline = Falling) and an interaction between Interval and Sonority profile. For the current experiment, the random effects structure included random intercepts of Speaker, Word pair and Interval, and by-speaker and by-real word status random slopes of Interval.
For model comparison, the minimal fixed-effects structure considered was one with just an intercept, and the maximal fixed-effects structure included an intercept, Interval, Sonority profile and an interaction between Interval and Sonority profile. In Table III, we present the AIC values and pairwise likelihood ratio tests between each model and the model on the previous line, where appropriate. Consequently, in Table III, there is no p-value for the third model (since the second and third models do not form a nested pair).
Model comparison for the RSDs in Experiment 2. The AIC value for the best model is given in bold.

Based on the AIC values and the likelihood ratio tests (where appropriate), the best model identified included a fixed effect of Interval and a separate fixed effect of Sonority profile, and an interaction between the two, suggesting that there was some evidence of differences across all three sonority profiles. This model is presented in Table IV.
The best mixed-effects linear regression model for the Jazani Arabic speakers in Experiment 2.

Given that the best model had a statistically significant interaction, we carried out pairwise comparisons of the two interval types (C-centre-to-anchor and right-edge-to-anchor) separately for each sonority profile in Table V. In the interest of conciseness, we present only the fixed effects for each model. As noted above, the baseline for Interval was the C-centre-to-anchor interval duration. The estimates show in each case that the right-edge-to-anchor intervals had lower (more negative) RSDs. This suggests that the right-edge-to-anchor interval was more stable than the C-centre-to-anchor interval for all the sonority profiles.
The main effects of Interval from separate mixed-effects linear regression models for each sonority profile in Experiment 2.

It is worth noting that the estimate is only marginally significant for the plateau case, although the effect size is roughly the same as in the other conditions. Furthermore, the Standard Error estimate for the plateau case is higher than the other two cases. This is not surprising, given there are only four pairs of sonority plateaus in the stimulus set. It is possible that the increased Standard Error estimate is due to collapsing the real word and nonce word cases. To further probe the source of the issue, we conducted a post hoc exploratory analysis of the RSDs, where we analysed the real word and nonce word pairs separately for the sonority plateau pairs. Again, in the interest of space, in Table VI we present only the fixed effects for each model. As can be observed, there is a negative estimate for both real words and nonce words, which suggests that the right-edge-to-anchor interval durations had lower RSDs for both cases even in the sonority plateau cases, i.e. the right-edge-to-anchor interval was more stable than the C-centre-to-anchor interval. Finally, for the sake of completeness, we also analysed the same comparisons within the other two sonority profiles (rising and falling), and confirmed that the pattern was the same for both real word and nonce word pairs.
The main effects of Interval from separate mixed-effects linear regression models of real and nonce words for each sonority profile in Experiment 2.

The speakers in the experiment consistently showed the lowest RSDs, and therefore the most stability, for the right-edge-to-anchor interval. The results of the experiment are therefore consistent with those from articulatory studies of word-initial consonant sequences in languages such as Moroccan Arabic and Tashlhiyt Berber (Goldstein et al. Reference Goldstein, Chitoran, Selkirk, Trouvain and Barry2007, Shaw et al. Reference Shaw, Gafos, Hoole and Zeroual2009, Reference Shaw, Gafos, Hoole and Zeroual2011, Hermes et al. Reference Hermes, Mücke and Auris2017). Furthermore, the sonority profile of the consonant sequences in the word pairs did not affect this pattern (despite a marginally significant result overall for the sonority plateau sequences, clear right-edge-to-anchor interval stability was found even for the sonority plateau sequences in a post hoc analysis that separated the test pairs according to real word status). The results of the statistical modelling suggest that there is right-edge alignment of the consonant sequences, with the last consonant in the word-initial consonant sequence being in a stable temporal relationship with the following vowel. This in turn is consistent with our expectation that Jazani Arabic has simplex onsets, despite having consonant sequences at the beginning of words.
There is one confound which needs to be addressed. In the carrier phrase used in the experiment, [Ɂɪnta _ marah θanjah], the word in the carrier phrase just before the test item ended in a vowel. It is therefore possible that the first consonant in the word-initial CC sequence of a test word resyllabified to the syllable in the preceding word. In that case, it would not be a surprise that there is right-edge-to-anchor stability in our results. In fact, Shaw et al. (Reference Shaw, Gafos, Hoole and Zeroual2009) dealt with the same confound in their experiment by recalculating all the intervals under the assumption of resyllabification – this was possible, given that their data included word-initial triconsonantal sequences. In Experiment 3, we address the issue by removing the carrier phrase.
4 Experiment 3: right-edge effects in Jazani Arabic (carrier phrase removed)
In Experiment 3, we eliminated the confound introduced by the carrier phrase in Experiment 2 by simply removing the phrase, i.e. the speakers produced the test words in isolation. In addition, we focused only on rising sonority word-initial consonant sequences. We reasoned that if the rising sonority sequences show right-edge-to-anchor stability, that would suggest a simplex onset organisation even with the consonant sequences that are most compatible with the Sonority Sequencing Principle (namely rising sonority consonant sequences). This in turn would provide support for a simplex onset organisation for the other possible consonant sequences (namely falling sonority sequences and sonority plateaus).
In Experiment 3, we show that, as with the results in Experiment 2, Jazani Arabic speakers show the most stability in the case of the right-edge-to-anchor interval.
4.1 Methods
4.1.1 Participants
Seven Jazani Arabic speakers participated in the experiment (mean age = 32, range = 30–35; all male). Six of them had participated in Experiment 2, though it is worth noting that the two experiments were conducted three years apart. The participants were in Samtah, in the Jazan province of Saudi Arabia. They were recruited through an e-mail distributed by one of the authors to friends who met the following criteria for participation in the experiment: (i) above the age of 18, (ii) from the Samtah area.
4.1.2 Materials
In Experiment 3, as mentioned above, we only used word pairs that had a rising sonority sequence in all of the words. The list contained some words from Experiment 2, but also included some that were new. The full list of words is given in (7). There were eight pairs of words, each repeated six times (8 × 2 × 6 = 96 test words). Crucially, unlike in Experiment 2, the speakers produced the test words in isolation. As with Experiment 2, some of the pairs of words contained nonce words, to ensure that the words formed perfect minimal pairs. Consistent with Experiment 2, we coded any pair containing at least one nonce word as a nonce word pair.
-
(7)
4.1.3 Procedure
The procedure was largely identical to Experiment 2. There were two notable differences. First, there was no carrier phrase in Experiment 3. Second, the experiment was conducted via an online platform, JotForm.Footnote 6 Information about the audio recording equipment used by the participants was not collected, but the files were recorded at a sampling rate of 44 kHz (16-bit resolution; stereo).
4.1.4 Measurements
The measurements were identical to those in Experiment 2.
4.2 Results
In Fig. 8 we present the by-subject raw durations for the different intervals. As can be seen, the right-edge-to-anchor interval has the smallest difference in interval durations between words with one word-initial consonant and those with two word-initial consonants. Furthermore, the same pattern appears to be true for each speaker. Therefore, the right-edge-to-anchor interval consistently has the most stability.
Raw durations for (a) the C-centre-to-anchor interval and (b) the right-edge-to-anchor interval for each of the Jazani Arabic speakers (S1–S7) in Experiment 3.

The overall RSD values bear out the same observation, being generally lower for the right-edge-to-anchor interval, as shown in Fig. 9. As with Experiment 2, all participants and all pairs had the lowest RSDs for the right-edge-to-anchor interval, which again suggest that this is likely a consistent fact about Jazani Arabic.
Overall RSDs for each interval (C-centre-to-anchor and right-edge-to-anchor) for the Jazani Arabic speakers in Experiment 3.

As with Experiments 1 and 2, we used linear mixed-effects models to analyse the data statistically, with RSD as the dependent variable. The independent variable considered was Interval (C-centre-to-anchor, right-edge-to-anchor; baseline = C-centre-to-anchor). The linear mixed-effects modelling had a random effects structure that included random intercepts of Speaker, Word pair, Real word status and Interval, and a by-speaker random slope of Interval; the best model identified was the model with a fixed effect for Interval, as in Table VII.
Model comparison for the RSDs in Experiment 3. The AIC value for the best model is given in bold.

A more careful look at the best model revealed that the right-edge-to-anchor interval had a smaller RSD than the C-centre-to-anchor interval (baseline), unlike the English speakers in Experiment 1, and exactly like the Jazani speakers in Experiment 2, as shown in Table VIII. Furthermore, the estimate for the difference between the RSDs of the two intervals was quite similar to the estimate of the same measure in Experiment 2. This suggests that the right-edge-to-anchor interval is indeed more stable than the C-centre-to-anchor interval.
The best mixed-effects linear regression model for the Jazani Arabic speakers in Experiment 3.

In summary, the statistical modelling clearly suggests that the right-edge-to-anchor interval is the more stable interval for the Jazani speakers, and the observed stability pattern could not be due to any confounds related to differences in coda duration.
The results in Experiment 3 replicated those in Experiment 2 for the rising sonority case. Furthermore, the experiment did not have the confound introduced by the carrier phrase in Experiment 2. In Experiment 2, the first consonant in a word-initial consonant sequence of the test words could have resyllabified to the vowel-final syllable in the previous word, [Ɂɪnta], of the carrier phrase. Consequently, the observed right-edge-to-anchor interval stability in Experiment 2 could have been due to there being only a single consonant in the onset in all the words. Since the words were spoken in isolation in Experiment 3, there was no preceding vowel-final syllable to allow the resyllabification; therefore, the results of Experiment 3 suggest that Jazani Arabic does indeed have right-edge-to-anchor interval stability.
5 Conclusion
In this article, we have presented three production experiments probing the temporal alignment of word-initial consonants in American English and Jazani Arabic using acoustic methods. In Experiment 1, we showed that word-initial consonant sequences in American English display C-centre-to-anchor interval stability in the acoustic signal that is equivalent to that found in previous articulatory experiments. The results were consistent with the phonological understanding that English syllables allow complex onsets and have C-centre-to-anchor stability. In Experiment 2, we showed that word-initial consonant sequences in Jazani Arabic have right-edge-to-anchor interval stability. Furthermore, we observed that the stability pattern was the same for all the consonant sequences that were tested, contrary to what Hermes et al. (Reference Hermes, Mücke and Grice2013) found for Italian. Our results suggest, in line with other phonological criteria, that a word-initial consonant sequence in Jazani Arabic does not form a complex onset. In Experiment 3, we replicated the results of Experiment 2 using only rising sonority sequences. Crucially, since the words were produced in isolation, the results in Experiment 3 cannot be explained by appealing to resyllabification of the first consonant in a consonant sequence to the preceding word's final open syllable.
The clear and consistent patterns in all three experiments suggest that acoustic methods are a useful alternative to probing both temporal stability metrics and thereby syllabic affiliation in consonant sequences. An important benefit of the technique employed here is that it is quite inexpensive, and can easily be scaled up to fieldwork contexts. We hope that it will be employed in a variety of languages and contexts – not only to test its viability, but also to examine its correlation with more traditional analytical techniques for inferring syllable structure.
We would like to conclude by highlighting two issues related to our results. First, we have tacitly assumed that acoustic measurements are only indirect windows into the underlying gestural timing relationships; however, the fact that there was consistent temporal stability in the two languages, both across speakers and across pairs of words, suggests the possibility that such stability patterns might not actually be about articulatory gestural timing relationships per se. It is possible that the stability is in fact a reflection of the speaker attempting to produce outputs that contain recoverable temporal stability information in the acoustics. In other words, the speaker might not be targeting articulatory stability, but instead acoustic and auditory stability. This, of course, is related to the debate about whether articulations have motoric end goals (Kelso et al. Reference Kelso, Saltzman and Tuller1986, Browman & Goldstein Reference Browman and Goldstein1989, Saltzman & Munhall Reference Saltzman and Munhall1989) or acoustic/auditory end goals (Guenther Reference Guenther, Elenius and Branderud1995, Guenther et al. Reference Guenther, Hampson and Johnson1998, Perkell et al. Reference Perkell, Guenther, Lane, Matthies, Perrier, Vick, Wilhelms-Tricarico and Zandipour2000). If it is indeed the latter, then there is another possible reason for the inconsistencies observed in some languages (namely Hebrew, French and German) with respect to articulatory temporal stability metrics. As briefly mentioned in §1, Mücke et al. (Reference Mücke, Hermes and Tilsen2020) argue that the articulations even in languages such as these are consistent with a complex onset organisation, and previous research has likely misinterpreted the relevant articulatory data. To account for the inconsistencies, they instead suggest a more complex linking hypothesis between theoretical phonological representations and phonetic measurements. However, given the possibility that the speaker is in fact trying to achieve consistent temporal relations that are recoverable from the acoustics (Browman & Goldstein Reference Browman, Goldstein, Bell-Berti and Raphael1995, Goldstein et al. Reference Goldstein, Byrd, Saltzman and Arbib2006, Nam et al. Reference Nam, Goldstein, Saltzman, Pellegrino, Marisco, Chitoran and Coupé2009), it is possible that the articulatory measures are in fact indirect windows into the stability patterns present in the acoustics, and that there is perhaps more stability for the C-centre-to-anchor interval than for the right-edge-to-anchor interval for the three languages, when the intervals are extracted from acoustic measurements. Given the above discussion, we think it would be particularly fruitful to carefully compare articulatory and acoustic measurements.
A second issue raised by our results is that syllable structure, particularly onset organisation, likely has a consistent signature in the acoustics. Based on our results, we suggest that the information about syllable structure is not present in any single acoustic token; instead it is observable in the pattern of structured covariation that is observed across tokens.


 Open access