


In October 2023, the second joint expert consultation commissioned by the FAO and the WHO on the ‘risk and benefit of fish consumption’ concluded that the consumption of fish provides essential energy, protein and a variety of micronutrients crucial for optimal health throughout the life-course, including during pregnancy, childhood and adulthood, while also recognising a serious dearth of evidence on the full spectrum of health benefits and risks associated with fish consumption(1). Fish are a critical nutritional resource among animal-source foods, providing essential long-chain ω-3 PUFA DHA and EPA, high-quality protein, minerals such as Se, Fe and Zn and vitamins such as B6, B12 and D – all while being naturally low in saturated fat(1,Reference Golden, Koehn and Shepon2) . This nutritional profile makes fish a crucial food source in low- and middle-income countries(Reference Byrd, Shieh and Mork3) where people are disproportionately affected by micronutrient deficiencies(Reference Hicks, Cohen and Graham4–Reference Passarelli, Free and Shepon6) and the increasing burden of metabolic disorders(Reference Ezzati and Riboli7), with India being no exception.
With its population exceeding 1·4 billion, India faces the dual challenge of widespread micronutrient deficiencies(Reference Han, Ding and Lu8,Reference Venkatesh, Sharma and Ananthan9) , notably low Hb levels causing anaemia(10,Reference Didzun, De Neve and Awasthi11) and a rising prevalence of metabolic disorders such as overweight/ obesity(Reference Rai, Kumar and Singh12), raised blood pressure (BP) or hypertension(Reference Koya, Pilakkadavath and Chandran13) and high blood glucose level or hyperglycaemia(14) among adults fuelling the growing burden of non-communicable diseases (NCD)(Reference Arokiasamy15). Between 2005–2006 and 2019–2021, prevalence of anaemia among women (aged 15–49 years) remained stubbornly high at 52–57 %, with no discernible difference between pregnant and non-pregnant women(Reference Rai, Kumar and Sen Gupta16). Similarly, men in the same age group experienced a comparable lack of progress, with anaemia prevalence remaining around 24–25 %(Reference Rai, Kumar and Sen Gupta16). Despite various food-based strategies and clinical interventions implemented to reduce anaemia in India (such as the National Nutrition Mission launched in 2018), these measures have proven insufficient to address the complexity and scale of the problem(Reference Rai, Kumar and Sen Gupta16). On the other hand, the growing prevalence of overweight/obesity (2005–2006 – men: 18·3 %, women: 21·3 %; 2015–2016 – men: 34·5 %, women: 33·4 %)(Reference Rai, Kumar and Singh12), hypertension (from 5·8 % in 2001–2005 to 22·5 % in 2016–2020)(Reference Koya, Pilakkadavath and Chandran13) and hyperglycaemia (from 6·7 % in 1990 to 8·7 % in 2016)(14) in India poses a formidable challenge to its healthcare system, straining resources and demanding urgent attention. In an effort to combat the accelerating burden of NCD, the Indian government initiated the National Program for Prevention and Control of Cancer, Diabetes, Cardiovascular Diseases, and Stroke in 2010, aiming to reach every district in the country(Reference Ramalingam, Raju and Ganeshkumar17). However, the effective implementation and overall performance of National Program for Prevention and Control of Cancer, Diabetes, Cardiovascular Diseases, and Stroke have encountered several challenges, including poorly designed monitoring framework, inconsistent drug supply, limited access to reliable diagnostics and inadequate financial planning(Reference Ramalingam, Raju and Ganeshkumar17).
Fish are an excellent dietary choice for combating anaemia due to their highly bioavailable heme Fe and their ability to enhance non-heme Fe absorption from other foods consumed in the same meal(Reference Lynch, Pfeiffer and Georgieff18,Reference Zimmermann and Hurrell19) . Furthermore, the Vitamin B12 present in fish helps prevent macrocytic anaemia by increasing Fe bioavailability(Reference Balarajan, Ramakrishnan and Ozaltin20), and Vitamin D in fish can mitigate pro-inflammatory cytokines, suppress hepcidin messenger ribonucleic acid transcription and support erythropoiesis, collectively reducing the inflammation responsible for suboptimal Hb levels(Reference Smith and Tangpricha21). In the context of metabolic disorders, the presence of long-chain n-3 polyunsaturated fatty acid EPA and DHA in fish has been documented to be cardioprotective and reduce the risk of obesity(Reference Jakobsen, Dethlefsen and Due22), hypertension(Reference Yang, Shi and Li23) and hyperglycaemia(Reference Xun and He24) through alterations of gene expression that increase fat oxidation and energy expenditure and reduce inflammation, oxidative stress and endothelial dysfunction. Although fish consumption shows promise in mitigating anaemia and metabolic disorders, the current evidence remains limited and inconclusive(1). Regarding anaemia, a study analysed cross-sectional data and found that increased meat and fish consumption accounted for 1 % of the total change in Hb levels among pregnant women in India(Reference Nguyen, Scott and Avula25). However, this study did not examine the independent association between fish consumption and Hb levels. A cross-sectional study in Ghana documented null association between fish/snail consumption and anaemia among pregnant women(Reference Anlaakuu and Anto26). Overall, the majority of existing studies prioritised analysing the link between fish consumption and Hb levels or anaemia in women and children(Reference Byrd, Shieh and Mork3), neglecting to investigate this relationship in men. In terms of metabolic disorders, systematic reviews suggest that a frequent intake of lean seafood may help reduce obesity, whereas intake of fatty fish is associated with increased body weight(Reference Liaset, Øyen and Jacques27). A five-year follow-up study among Europeans found no association between fish consumption and weight change in men, while a rather weak association was observed in women(Reference Jakobsen, Dethlefsen and Due22), whereas a randomised trial showed reduction of body weight among participants (aged 20–40 years) who received fish as part of their dietary regime compared with control group(Reference Ramel, Jonsdottir and Thorsdottir28). Regarding hypertension, the relationship with fish consumption is complex(Reference Del Brutto, Mera and Gillman29). While a metaregression analysis of randomised trials indicated a protective relationship of fish consumption on elevated BP(Reference Geleijnse, Giltay and Grobbee30), others have found an inverse relationship(Reference Ramel, Martinez and Kiely31), and yet another randomised study has found no association(Reference Grieger, Miller and Cobiac32). Similarly, studies examining the relationship between fish consumption and hyperglycaemia have been inconsistent, yielding no definitive conclusions(Reference Mohan, Mente and Dehghan33–Reference Forouhi, Misra and Mohan35). While several studies reported elevated glucose levels with increased fish consumption(Reference Mohan, Mente and Dehghan33,Reference Karlström, Järvi and Byberg36,Reference Agrawal, Millett and Subramanian37) , a meta-analysis exhibited no such association(Reference Chen, Yu and Shao38).
The inconsistencies in research findings regarding the relationship between fish consumption and anaemia and select metabolic disorder could be attributed to several factors such as variability in fish consumption assessment leading to discrepancies in reported intake and nutrient composition, inaccuracies in measuring anaemia and metabolic disorder indicators, heterogeneity in study designs, and diverse statistical approaches adopted to analyse data and interpret the results. Overall, understanding the relationship of fish consumption with anaemia and metabolic disease risk factors of NCD is still nascent, and there is a significant lack of research on this topic, specifically in the Indian context(Reference Padiyar, Dubey and Bayan39). To fill this evidence gap, using a nationally representative dataset, this study investigated the relationship between fish consumption frequency and anaemia and select metabolic disorders (overweight/obesity, hypertension and hyperglycaemia) in adult men and women in India.
Methods
Dataset
We used data from three waves of the National Family Health Survey (NFHS) conducted in India between 2005 and 2021: NFHS-3 (2005–2006)(40), NFHS-4 (2015–2016)(41) and NFHS-5 (2019–2021)(42). NFHSs gather cross-sectional and nationally representative data, and by virtue of their sampling design, estimates across survey rounds are comparable(Reference Corsi, Neuman and Finlay43). Conducted under the aegis of the Ministry of Health and Family Welfare, Government of India, NFHSs generated extensive data on socio-demographic and public health indicators across states and union territories. NFHS’s findings are extensively utilised by national and international stakeholders for research, policymaking and programme development. Both NFHS-4 and NFHS-5 employed a consistent sampling design representative at the national, state/union territory and district levels. Conversely, NFHS-3 did not gather district representative data. All three NFHSs achieved household response rates of over 97 %. Utilising the 2001 Census as the sampling frame for NFHS-3 and the 2011 Census for NFHS-4 and NFHS-5, the NFHSs sampling process employed a stratified two-stage design, involving the selection of primary sampling units in rural areas and census enumeration blocks in urban areas. For rural areas, villages were chosen from the sampling frame using probability proportional to size. Within each rural stratum, six substrata were created by crossing three substrata (based on the estimated number of households per village) with two substrata (based on the percentage of the population belonging to Scheduled Castes and Scheduled Tribes). For urban areas, census enumeration blocks were sorted by the percentage of their Scheduled Castes and Scheduled Tribes population, and sample census enumeration blocks were selected using probability proportional to size systematic sampling. In each selected rural and urban primary sampling unit, a comprehensive household mapping and listing operation was conducted prior to the main survey. Further details of sampling design and process, sample weighting computation, estimation of standard errors and strategies to enhance data quality measures are presented in the respective NFHS reports(40–42).
Of four questionnaires (household, man, woman and biomarker) used for information recording in NFHSs, we used data collected on men (aged 15–54 years) and women (aged 15–49 years) for this study. This study used data from three waves of the NFHS (NFHS-3, NFHS-4 and NFHS-5) to estimate national and state-level trends in fish consumption frequency among men and women from 2005 to 2021 (online Supplementary Tables S1–S3). However, to examine the relationship between fish consumption and anaemia and metabolic disease risk factors (overweight/obesity, hypertension and hyperglycaemia), only data from NFHS-5 were analysed. This choice was motivated by the fact that NFHS-5 (2019–2021) represents the latest wave of nationally representative data. Combining NFHS-3 through 5 for a pooled data analysis might have curtailed the precision of the true association between fish consumption and outcomes of interest. Furthermore, we restricted this analysis to non-vegetarians, defined as those who reported consuming fish or eggs or chicken/meat with varying frequencies (daily, weekly or occasionally). This means that the analysis included individuals who identified as non-vegetarians, even if they had never consumed fish, as long as they had consumed other animal products like eggs and/or chicken/meat. Limiting the analysis to non-vegetarians helped reduce misclassification bias by ensuring that individuals who are unlikely to consume fish, such as vegetarians or vegans, are excluded from the analytical sample. Compared with NFHS-4, NFHS-5 showed a slight increase in the non-vegetarian population (online Supplementary Tables S4 and S5, respectively). In NFHS-5, a vast majority of men (86·9 %, 95 % CI: 86·4, 87·3 %) were identified as non-vegetarian, whereas nearly 74·7 % (95 % CI: 74·5, 74·9 %) of women were estimated to be non-vegetarian. For reference, in NFHS-4, 82·6 % (95 % CI: 82·2, 83·0 %) of men and 73·8 % (95 % CI: 73·7, 73·9 %) of women were identified to be non-vegetarian.
From the NFHS-5 survey of 101 839 men, we analysed data from 78 749 men for anaemia, 80 262 for overweight/obesity, 73 620 for hypertension and 78 900 for hyperglycaemia. Of 724 115 women surveyed in NFHS-5, 517 157 were eligible for analysis of anaemia, 525 850 for overweight/obesity, 483 185 for hypertension and 517 993 for hyperglycaemia. It is important to mention that in NFHS, the man’s questionnaire was administered to a subsample of consented households, resulting in a smaller sample size for men compared with women. Flow charts of analytical sample derivation for men and women are presented in online Supplementary Figure S1 and S2, respectively.
Outcome measurements: anaemia and metabolic disorder
Anaemia, an indicator of micronutrient deficiency, was assessed using Hb level, with severity defined according to the WHO guidelines(44). For women, a Hb level below 12 g/dl was considered anaemia, with levels between 11 and 11·9 g/dl classified as mild anaemia and levels ≤ 10·9 g/dl as moderate to severe. For men, the thresholds were set at Hb levels below 13 g/dl for anaemia, 11–12·9 g/dl for mild anaemia and ≤ 10·9 g/dl for moderate to severe anaemia. All Hb estimates provided with NFHS data were adjusted for altitude of living and smoking habits, and Hb values above 20 g/dl or below 4 g/dl were excluded from analysis as these extreme values are likely due to measurement error(44). Details regarding the altitude and smoking habit adjustments applied to Hb estimates for anaemia definition have been published elsewhere(Reference Sullivan, Mei and Grummer-Strawn45). In NFHS-5, on-site Hb testing was conducted with a portable HemoCue Hb 201+ analyser device, analysing capillary blood samples obtained from finger pricks(42).
Assessment of metabolic disease risk factors focused on three measurements: overweight/obesity, hypertension and hyperglycaemia. For computing overweight/obesity, BMI was determined using the standard formula of weight in kilograms divided by height in metres squared, and employed specific thresholds established for Asian Indian populations − < 18·5 (underweight), 18·5–22·9 (normal) and ≥ 23 (overweight, including obesity)(Reference Misra, Chowbey and Makkar46). In NFHS-5(42), height and weight among adults were measured using a Seca 213 stadiometer and a Seca 874 digital scale, respectively. Individuals were considered hypertensive if the measured systolic BP was ≥ 140 mmHg (or millimetre of mercury) with or without diastolic BP of ≥ 90 mmHg, or if the individual had been reported to be using anti-hypertensive medication to lower the BP during the survey, or if a doctor or other health professional in the past identified high BP on two or more occasions(Reference Gee, Campbell and Sarrafzadegan47). NFHS-5 used a portable standardised OMRON™ BP monitor to record BP readings three times, with at least five minutes of inactivity between each BP measurement(42). An individual’s BP was estimated in accordance with the WHO’s recommendations, which involved calculating the mean of the final two seated BP readings, taken on at least two separate occasions, to mitigate potential upward bias in BP readings resulting from anxiety or nervousness associated with the initial measurement(48). An individual is classified as hyperglycaemic if they had a random capillary blood glucose level of ≥ 200 mg/dl(Reference Schleicher, Gerdes and Petersmann49), or if the individual had been reported to be using anti-diabetic medication to lower the blood glucose on survey date, or if a doctor or other health professionals in the past had diagnosed them with elevated blood glucose on two or more occasions(42). Participants were requested to undergo a random (meaning fasting prior to blood test was not required) fingertip prick blood glucose measurement using the Accu-Chek Performa glucometer(42).
Despite adhering to a strict protocol for BP and blood glucose measurements in NFHS-5, the possibility of extreme values or outliers may not be entirely avoided. However, this study included only participants with BP and blood glucose values within a plausible range, ensuring data quality. The average systolic BP for men ranged from 60 to 269 mmHg, while diastolic BP ranged from 24 to 192 mmHg. Mean systolic BP (minimum: 12 mmHg, and maximum: 248 mmHg) and diastolic BP (minimum: 14 mmHg, and maximum: 204 mmHg) were within the acceptable range for women. Blood glucose levels ranged from 20 to 499 mg/dl for both men and women. Details about the protocol followed by the trained field investigator to measure Hb, anthropometry (height and weight), BP and blood glucose are furnished in the NFHS-5 survey manual(50).
Fish consumption
In all three NFHSs(40–42), men and women were asked about the frequency (daily, weekly, occasionally or never) of consumption of various types of food items, including milk or curd, pulses or beans, dark green leafy vegetables, fruits, eggs, fish, chicken or meat, fried foods and aerated drinks. Online Supplementary Table S6 illustrates the changes in food consumption frequency between NFHS-4 (2015–2016) and NFHS-5 (2019–2021), among men and women. Two approaches were adopted to define fish consumption groups, allowing for a more nuanced comparative exploration of the relationship between fish consumption and health outcomes. These approaches differed in how we categorised frequency of fish intake – approach 1: daily intake of fish was labelled as ‘daily consumer or DC’ group, whereas non-daily consumer or NDC group was defined as men and women who reported consuming fish weekly/ occasionally. In approach 2, daily consumer of fish (DC) and NDC groups were redefined – both ‘daily’ and ‘weekly’ fish consumption were combined as the ‘daily/ weekly consumer or DWC’, while ‘occasional’ fish intake was categorised as the ‘non-daily/weekly consumer or NDWC’. The lack of data on fish consumption amounts necessitated these two approaches to grouping fish consumption to explore its relationship with select health outcomes.
The first approach (DC v. NDC) focused on ‘daily’ fish consumption because it provides a clear and unambiguous measure of frequent intake, indicating consumption every day. In contrast, ‘weekly’ consumption is less precise, as it does not specify the number of times fish is eaten within a week. Similarly, ‘occasional’ consumption leaves the frequency of intake unclear. In addition, findings of this study have potential to inform recommendations regarding daily fish consumption for preventing anaemia and/or metabolic disorders, whereas such specific guidance may not be possible for those who consume fish weekly or occasionally. However, this grouping strategy may not be realistic, as only a small proportion of NFHS-5 respondents reported consuming fish daily (6·8 % of men and 5·1 % of women), while a considerably larger proportion reported weekly consumption (39·0 % of men and 30·6 % of women). Therefore, a second approach, the daily/weekly consumer of fish (DWC) v. non-daily/weekly consumer of fish (NDWC) grouping, was developed. Comparing these two approaches for grouping fish consumption frequency is particularly important in India, where fish consumption varies widely due to regional cuisines, dietary habits and affordability across states and union territories(Reference Padiyar, Dubey and Bayan39). This means that the potential benefits observed in the study could apply to a wide range of Indian populations, regardless of their specific fish preferences or culinary traditions. The online supplement presents kernel density distributions of Hb level, BMI, body weight, mean systolic and diastolic BP and glucose level, stratified by NDC and DC groups for men (online Supplementary Figure S3) and women (online Supplementary Figure S4), as well as for NDWC and DWC groups for men (online Supplementary Figure S5) and women (online Supplementary Figure S6).
Statistical approach
We estimated the proportional difference in anaemia, overweight/obesity, hypertension and hyperglycaemia between NDC v. NDWC and DC v. DWC groups, among men and women. To examine the association between fish consumption and anaemia and metabolic disorders for men and women, the control function (CF) method(Reference Glewwe and Todd51) was employed. Also known as a generalised residual method, CF estimator is designed explicitly to control for selection based on unobservable factors which may differ systematically between DC and DWC and NDC and NDWC groups(Reference Wooldridge52). CF method addresses potential endogeneity by incorporating the residuals from a primary model (estimating the factors associated with daily fish consumption) as a regressor in the outcome models for anaemia and selected metabolic disorders. Econometrically, the CF approach could be specified as follows:
 $${y_i} = \;{t_i}{y_{i1}} + \left( {1 - \;{t_i}} \right){y_{i0}}$$
In the above equation, ${y_i}$
is the observed outcome (i.e. anaemia level, overweight/obesity, hypertension and hyperglycaemia),
${y_i}$
is the observed outcome (i.e. anaemia level, overweight/obesity, hypertension and hyperglycaemia), ${t_i}$
is the observed binary variable – daily or daily/weekly consumption of fish, and otherwise),
${t_i}$
is the observed binary variable – daily or daily/weekly consumption of fish, and otherwise), ${y_{i1}}$
is the potential outcome of daily or daily/weekly fish consumption and
${y_{i1}}$
is the potential outcome of daily or daily/weekly fish consumption and ${y_{i0}}$
is the potential outcome when the individual did not consume fish daily or daily/weekly. Furthermore, following equations could be used to obtain the estimate for
${y_{i0}}$
is the potential outcome when the individual did not consume fish daily or daily/weekly. Furthermore, following equations could be used to obtain the estimate for ${y_{i0}}$
,
${y_{i0}}$
, $y\!\!{\;_{i1}}$
and
$y\!\!{\;_{i1}}$
and ${t_i}$
–
${t_i}$
–
 $${y_{i0}} = E\;({y_{i0}}|{x_i}) + {\varepsilon _{i0}}$$
 $${y_{i1}} = E\;({y_{i1}}|{x_i}) + {\varepsilon _{i1}}$$
 $${t_i} = E\;({t_i}|{z_i}) + {v_i}$$
where ${x_i}$
is the set of regressors used for potential outcome determination, and
${x_i}$
is the set of regressors used for potential outcome determination, and ${\varepsilon _{ij}}$
is an unobserved random component. Similarly, the variable representing fish consumption frequency is given by its expectation conditional on a set of regressors
${\varepsilon _{ij}}$
is an unobserved random component. Similarly, the variable representing fish consumption frequency is given by its expectation conditional on a set of regressors ${z_i}$
, which does not need to differ from
${z_i}$
, which does not need to differ from ${x_i}$
, and an unobserved component –
${x_i}$
, and an unobserved component – ${v_i}$
.
${v_i}$
.
To illustrate the relationships between fish consumption, anaemia and metabolic conditions (overweight/obesity, hypertension and hyperglycaemia), we constructed directed acyclic graphs(Reference Tennant, Murray and Arnold53), which are presented in the online Supplementary (Figures S7 and S8). To guide CF modelling, directed acyclic graph is crucial as the residual generated from the regressors assigned for the fish consumption frequencies is used for the models developed for potential outcomes, to control for endogeneity. Considering information availability with the NFHS-5 data, we identified a range of factors that influence anaemia(Reference Didzun, De Neve and Awasthi11,Reference Rai, Kumar and Sen Gupta16,Reference Kinyoki, Osgood-Zimmerman and Bhattacharjee54,55) , overweight/obesity(Reference Rai, Kumar and Singh12,56,57) , hypertension(Reference Koya, Pilakkadavath and Chandran13,Reference Rai, Kumar and Singh58,Reference Geldsetzer, Manne-Goehler and Theilmann59) , hyperglycaemia(14,Reference Geldsetzer, Manne-Goehler and Theilmann59,Reference Barik, Mazumdar and Chowdhury60) and frequency of fish consumption(Reference Golden, Koehn and Shepon2,Reference Hicks, Cohen and Graham4,Reference Venkatesh, Sharma and Ananthan9,Reference Mohan, Mente and Dehghan33,Reference Agrawal, Millett and Subramanian37,Reference Padiyar, Dubey and Bayan39,Reference Zhao, Wang and Peng61) . Fish consumption could be influenced by an individual’s education, occupation, religion, social group, economic status, locality of residence and state of residence, and these factors also influence the prevalence of metabolic disorders like overweight/obesity, hypertension and hyperglycaemia. Furthermore, age, dietary habits and modifiable behaviours like tobacco and alcohol use are also associated with these metabolic disease risk factors. The factors that influence anaemia are similar to those that affect fish consumption and metabolic disorders.
Categories of social groups (Scheduled Castes, Scheduled Tribes, Other Backward Classes and Others) were guided by the Constitution of India, whereas household economic status (represented by wealth index) provided with NFHS datasets is constructed using household assets and durables, including ownership of consumer items and dwelling characteristics(42). Individuals were categorised based on their household wealth score, which was divided into quintiles (poorest, poorer, middle, richer and richest), and for further analysis, the ‘poorest’ and ‘poorer’ groups were combined into a ‘poor’, and the ‘richer’ and ‘richest’ groups were combined into a ‘rich’ category. State of residence was divided into three groups depending on the abundance of fish availability, namely states with access to marine fish (include island territories: Andaman & Nicobar Islands and Lakshadweep; coastal states: Gujarat, Maharashtra, Goa, Karnataka, Kerala, Tamil Nadu, Puducherry, Andhra Pradesh, Telangana and Odisha), freshwater river fish (include North-Eastern States/Brahmaputra basin states, Gangetic basin states: Uttar Pradesh, Uttarakhand, Bihar and West Bengal; tribal dominated states such as Jharkhand, Chhattisgarh and Madhya Pradesh) and remaining states/union territories with poor/other types of fish availability(Reference Padiyar, Dubey and Bayan39).
The statistical software Stata version 18(62) was used to execute the entire analyses; coefficients of association (i.e. β) were reported with se, 95 % CI and two-tailed P values. For executing the descriptive statistics, appropriate sample weighting, provided with NFHS-5 data, was used for analysis. Furthermore, we estimated the correlation between the unobservables for fish consumption and potential-outcome models by conducting tests of endogeneity. The absence of correlation would imply the absence of endogeneity. In an ideal case, to confirm the absence of unobservables, if CF results confirm an association (P < 0·05) between fish consumption and anaemia and metabolic disorders, the probability of corresponding H0 (fish consumption and outcome unobservables are uncorrelated) should be P > 0·05. An analysis on heterogeneity (by age groups: 15–30, years and ≥ 31 years; wealth status: poor and rich and regional fish availability: marine fish, freshwater river fish and other types of fish) of the relationship between fish consumption frequency and anaemia and metabolic disorders was undertaken. Subgroup analyses were conducted for anaemia, hypertension and hyperglycaemia, stratifying the data by BMI categories: underweight, normal and overweight/obesity. Furthermore, in a supplementary analysis, we explored the relationship between frequency of fish consumption (NDC v. DC and NDWC v. DWC groups) and various health indicators, including anaemia severity (mild, moderate/severe), BMI, underweight, BP types (mean systolic and diastolic) and blood glucose levels, aiming to further elucidate the relationship between fish consumption and the risk of anaemia and metabolic disorders.
Results
Descriptive statistics
Figure 1 compares the prevalence of anaemia, overweight/obesity, hypertension and hyperglycaemia between two groups, among both men and women: NDC v. DC and NDWC v. DWC. Among men, the prevalence of anaemia was similar in the NDC and DC groups (25·8 %). However, the NDWC group exhibited a lower prevalence of anaemia (24·9 %; 95 % CI: 24·4, 25·3 %) compared with the DWC group (26·6 %; 95 % CI: 26·2, 27·1 %; online Supplementary Table S7). The prevalence of overweight/obesity was higher among men who consumed fish daily (45 %; 95 % CI: 43·8, 46·2 %) compared with the NDC group (40·6 %; 95 % CI: 40·3, 41·0 %; online Supplementary Table S8), while it was slightly higher in the DWC group (41·6 %; 95 % CI: 41·2, 42·1 %) than in the NDWC group (40·2 %; 95 % CI: 39·7, 40·7 %). Among men, the prevalence of hypertension was slightly higher in the NDC group (20·0 %; 95 % CI: 19·7, 20·3 %) than in the DC group (18·7 %; 95 % CI: 17·7, 19·8 %; online Supplementary Table S9). Similarly, the prevalence of hypertension was higher in the NDWC group than in the DWC group. Regarding hyperglycaemia, 4·4 % of men in the NDC group (95 % CI: 4·2, 4·5 %) were diagnosed with this condition, notably lower than the 6·0 % (95 % CI: 5·4, 6·6 %) found in men who reported consuming fish daily (online Supplementary Table S10). Similarly, the prevalence of hyperglycaemia was higher in the DWC group (4·8 %; 95 % CI: 4·6, 5·0 %) than in those who did not consume fish daily/weekly (4·2 %; 95 % CI: 4·0, 4·4 %).
Prevalence (%) of anaemia, overweight/obesity, hypertension and hyperglycaemia among men and women, by their fish consumption categories: daily consumer (DC), non-daily consumer (NDC), daily/weekly consumer (DWC), and non-daily/weekly consumer (NDWC).

Among women, the difference in anaemia prevalence between the NDC (58·5 %, 95 % CI: 58·4, 58·7 %) and DC (56·4 %, 95 % CI: 55·9, 57·0 %) groups was negligible; however, a more substantial difference of two percentage points was observed between the NDWC (57·4 %, 95 % CI: 57·2, 57·6 %) and DC (59·4 %, 95 % CI: 59·2, 59·6 %) groups (online Supplementary Table S11). The prevalence of overweight and obesity was 10 percentage points higher in the DC group (47·2 %; 95 % CI: 46·6, 47·7 %) than in the NDC group (37·2 %; 95 % CI: 37·1, 37·4 %; online Supplementary Table S12). Similarly, the DWC group (41 %) showed a 5·9 percentage point higher prevalence compared with the NDWC group (35·1 %). Among the DC group, nearly 14·7 % of women (95 % CI: 14·3, 15·1 %) were diagnosed with hypertension, which is a little lower than the NDC group (15·4 %, 95 % CI: 15·3, 15·5 %, online Supplementary Table S13). There was no apparent difference in hypertension prevalence between the NDWC (15·2 %) and DWC (15·4 %) groups. A higher prevalence of hyperglycaemia was observed among women in the DC group (4·75 %; 95 % CI: 4·53, 4·97 %) compared with the NDC group (3·37 %; 95 % CI: 3·32, 3·42 %). Similarly, the DWC group showed a higher prevalence of hyperglycaemia (4·05 %, 95 % CI: 3·97, 4·13 %) than the NDWC group (2·92 %, 95 % CI: 2·85, 2·98 %) (online Supplementary Table S14). Detailed estimates of the prevalence of anaemia and metabolic disease risk factors, stratified by sex and select background characteristics, are presented in the online Supplementary (Tables S7–S14).
Findings from control-function analysis
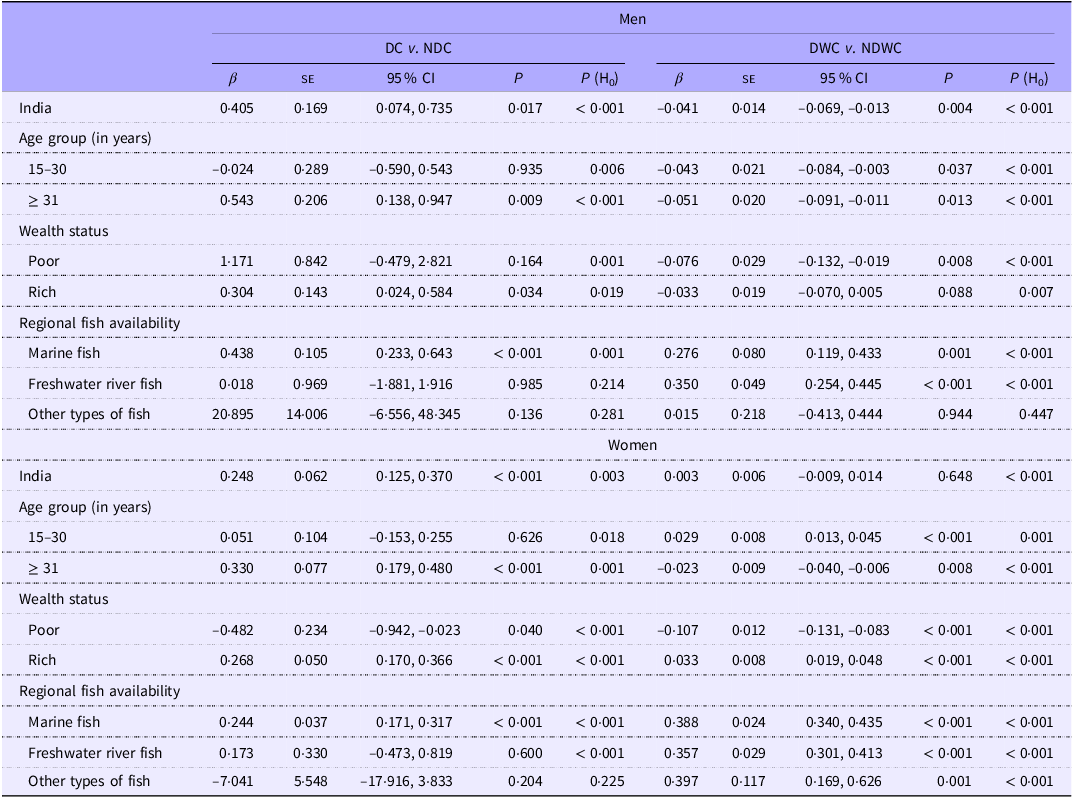
Both daily and daily/weekly fish consumption were associated with a reduced risk of anaemia among both men (β: −0·497; 95 % CI: −0·793, −0·200; P: 0·001; and β: −0·105; 95 % CI: −0·131, −0·080; P < 0·001, respectively) and women (β: −1·210; 95 % CI: −1·347, −1·073; P < 0·001; and β: −0·186; 95 % CI: −0·199, −0·174; P < 0·001, respectively) (Table 1). A lower risk of anaemia was observed among both men and women who were aged ≥ 31 years, regardless of their fish consumption group. This association was also observed across economic groups (poor or rich), BMI categories (normal or overweight/obese) and among those with access to marine fish. Compared with NDC group, both men and women who consumed fish daily had higher probability of overweight/obesity (men: β: 0·405, 95 % CI: 0·074, 0·735, P: 0·017; women: β: 0·248, 95 % CI 0·125, 0·370, P < 0·001) (Table 2). Conversely, daily/weekly fish consumption was associated with a reduced risk of overweight/obesity in men (β: −0·041, 95 % CI: −0·069, −0·013; P: 0·004). Daily fish consumption was associated with an increased risk of overweight/obesity among adults aged ≥ 31 years, who had high incomes (rich), and who had access to marine fish. Daily and weekly fish consumption was associated with a reduced risk of overweight/obesity in men, irrespective of age group and economic status. However, consuming marine or freshwater fish daily/weekly was linked to an increased risk of overweight/obesity in both men and women.
Fish consumption (DC v. NDC and DWC v. NDWC) and its association with anaemia among men and women – for India, wealth status, BMI and regional fish availability

β, coefficient; H0, null hypothesis; P, level of significance.
DC or daily consumer of fish represents individuals who reported consuming fish daily.
NDC or non-daily consumer of fish represents individuals who reported consuming fish weekly/ occasionally/never.
DWC or daily-weekly consumer of fish represents individuals who reported consuming fish daily/weekly.
NDWC or non-daily/weekly consumer of fish represents individuals who reported consuming fish occasionally/never.
Fish consumption (DC v. NDC and DWC v. NDWC) and its association with overweight/obesity among men and women – for India, wealth status, BMI and regional fish availability

β, coefficient; H0, null hypothesis; P, level of significance.
DC or daily consumer of fish represents individuals who reported consuming fish daily.
NDC or non-daily consumer of fish represents individuals who reported consuming fish weekly/ occasionally/never.
DWC or daily-weekly consumer of fish represents individuals who reported consuming fish daily/weekly.
NDWC or non-daily/weekly consumer of fish represents individuals who reported consuming fish occasionally/never.
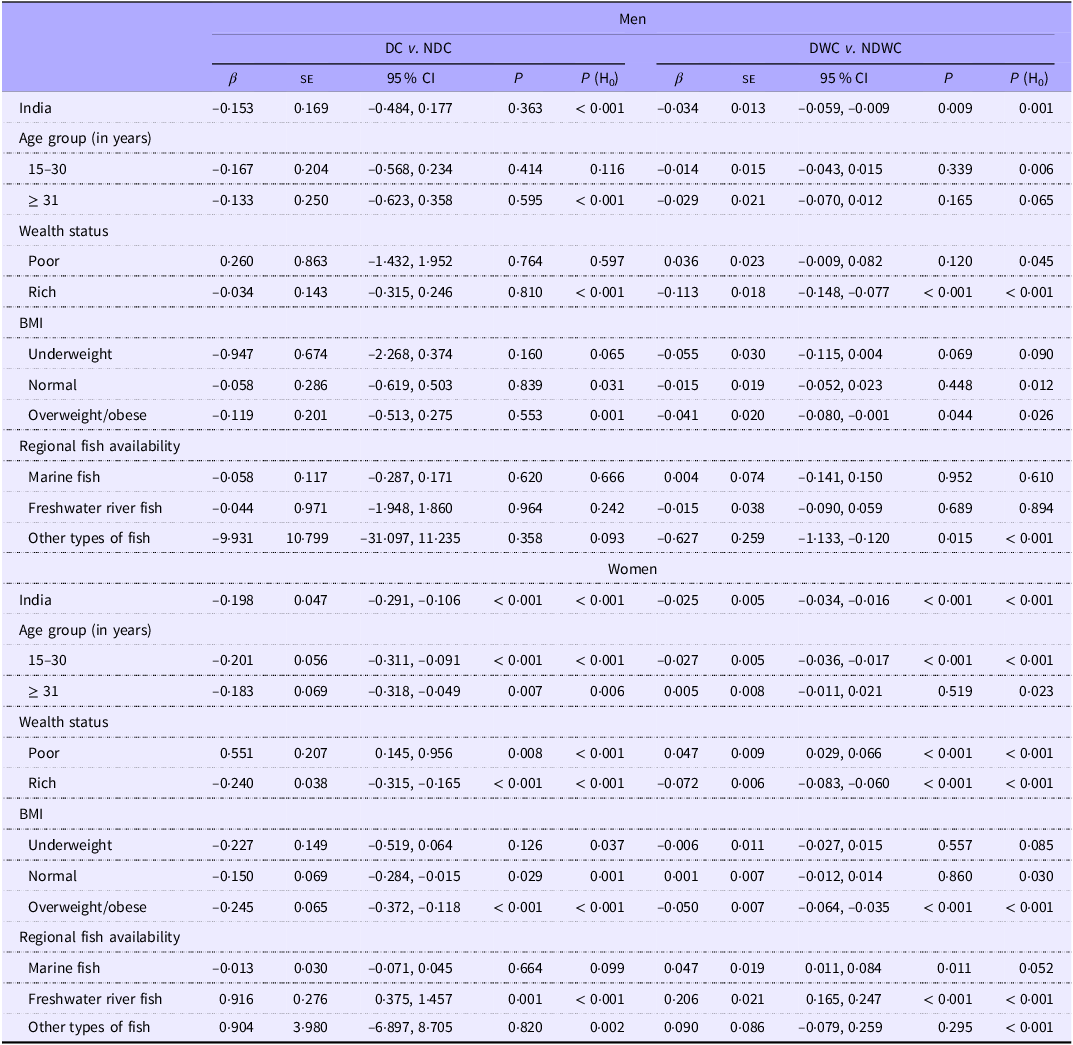
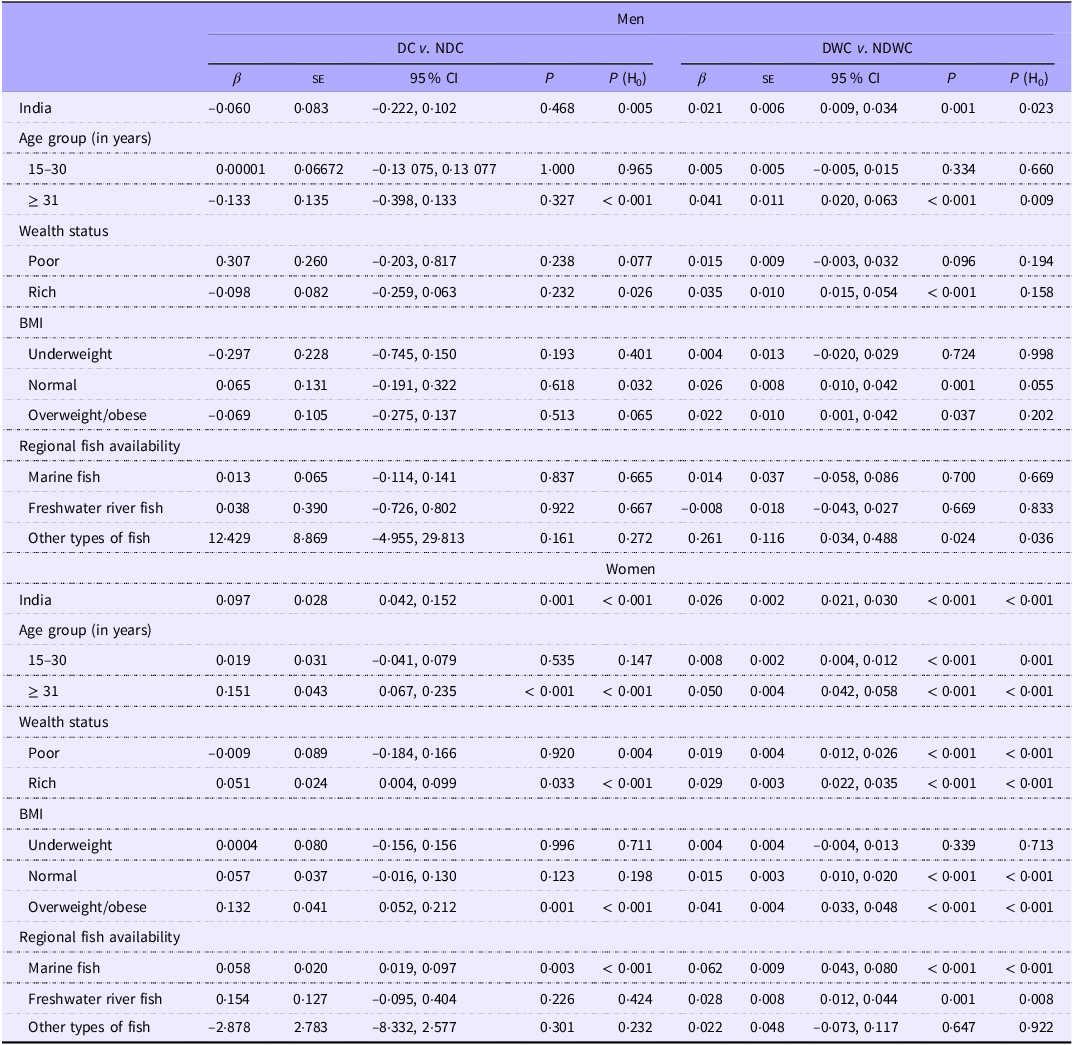
In men, daily or weekly fish consumption was associated with a reduced risk of hypertension. Similarly, fish consumption demonstrated a potentially protective relationship against hypertension in women, regardless of how often they ate fish (Table 3). Daily or weekly fish consumption was linked to a decreased likelihood of hypertension in men who were both overweight/obese and had high incomes (β: −0·041, 95 % CI: −0·080, −0·001, P: 0·044; and β: −0·113, 95 % CI: −0·148, −0·077; P < 0·001, respectively). Women with low incomes who lived in states where freshwater fish was a common food source were at high risk of hypertension, regardless of how often they ate fish. Women who were overweight/obese, as well as those with high incomes, were less likely to be hypertensive. Daily or weekly fish consumption was associated with an increased risk of hyperglycaemia in men (β: 0·021; 95 % CI: 0·009, 0·034; P: 0·001, Table 4). Similarly, daily fish consumption, with or without additional weekly consumption, was linked to increased probability of hyperglycaemia in women. Daily or weekly fish consumption was linked to an increased likelihood of hyperglycaemia in men with high incomes, regardless of BMI (normal or overweight/obesity). Regardless of fish consumption frequency, an increased risk of hyperglycaemia was observed among women with high incomes, those with overweight/ obesity and those who frequently consumed marine fish.
Fish consumption (DC v. NDC and DWC v. NDWC) and its association with hypertension among men and women – for India, wealth status, BMI and regional fish availability

β, coefficient; H0, null hypothesis; P, level of significance.
DC or daily consumer of fish represents individuals who reported consuming fish daily.
NDC or non-daily consumer of fish represents individuals who reported consuming fish weekly/ occasionally/never.
DWC or daily-weekly consumer of fish represents individuals who reported consuming fish daily/weekly.
NDWC or non-daily/weekly consumer of fish represents individuals who reported consuming fish occasionally/never.
Fish consumption (DC v. NDC and DWC v. NDWC) and its association with hyperglycaemia among men and women – for India, wealth status, BMI and regional fish availability

β, coefficient; H0, null hypothesis; P, level of significance..
DC or daily consumer of fish represents individuals who reported consuming fish daily.
NDC or non-daily consumer of fish represents individuals who reported consuming fish weekly/ occasionally/never.
DWC or daily-weekly consumer of fish represents individuals who reported consuming fish daily/weekly.
NDWC or non-daily/weekly consumer of fish represents individuals who reported consuming fish occasionally/never.
To investigate the potential mediating and causal role of BMI in the relationship between fish consumption and anaemia, hypertension and hyperglycaemia, we conducted two sets of CF analyses. Initially, BMI was included as a control variable in the CF analysis to account for its potential confounding effect. Subsequently, we performed a secondary CF analysis, excluding BMI as a control variable, to assess its potential mediating role. The results of both analyses, presented in online Supplementary Table S15, were largely consistent with the primary findings reported in Tables 1, 3 and 4. This consistency indicates that BMI did not materially affect the observed association between fish consumption and the aforementioned health outcomes in both men and women. Furthermore, the H0 corresponding to all associations (P < 0·05) presented above rejects the null hypothesis, suggesting the presence of unobservable factors beyond those measured in this study, such as genetic predisposition or unmeasured lifestyle factors, may influence the development of anaemia and metabolic disease risk factors. Further analysis of the observed associations between fish consumption frequency and select health indicators, including anaemia severity, weight status, mean systolic and diastolic BP and blood glucose levels, is presented in online Supplementary Table S16.
Discussion
This study used data from the nationally representative 2019–2021 National Family Health Survey (NFHS-5)(42) to investigate the association between the frequency of fish consumption and anaemia and select metabolic disease risk factors for NCD (namely, overweight/obesity, hypertension and hyperglycaemia) among adult men and women in India. The CF method was employed to isolate the net association of daily and daily/weekly fish consumption with outcome variables of interest while accounting for potential confounding factors that could influence both dietary choices and health outcomes. This study revealed the complex relationship between fish consumption and anaemia and metabolic disorders. Further research is crucial to disentangle these relationships and determine the overall impact of fish consumption on health. Findings of this study are crucial in light of the growing demand for fish in India, driven by increasing population, rising incomes and a greater awareness of the nutritional benefits of fish(Reference Padiyar, Dubey and Bayan39).
Both daily and daily/weekly fish consumption were associated with reduced odds of anaemia in both women and men. This association was observed across socio-economic strata (both affluent and disadvantaged) and BMI categories (normal weight and overweight/obese), and in individuals with access to marine fish. While previous research indicated the positive impact of fish consumption on reducing anaemia in women(Reference Lynch, Pfeiffer and Georgieff18), this study further reveals a potentially protective association between fish consumption and anaemia prevalence in Indian men. Fish, particularly marine species(Reference Hicks, Cohen and Graham4), serve as a valuable source of heme Fe, a form readily absorbed by the human body(Reference Piskin, Cianciosi and Gulec63). This enhances Fe bioavailability and contributes to improved Fe status. Moreover, consuming fish has a positive effect on the absorption of non-heme Fe, the less bioavailable form found in plant-based foods. This dual impact of fish consumption – providing heme Fe and promoting non-heme Fe absorption – significantly improves Fe utilisation, which in turn helps reduce the prevalence of Fe deficiency anaemia(Reference Lynch, Pfeiffer and Georgieff18,Reference Zimmermann and Hurrell19) . The National Institute of Nutrition of the Indian Council of Medical Research, Government of India, estimates that the average Fe content per 100 grams of raw fish (inclusive of other seafood) is 2·16 grams, while dried fish contains 12·08 grams(64). Recognising the significant Fe contribution of fish, the National Institute of Nutrition of the Indian Council of Medical Research actively promotes its consumption, particularly among vulnerable populations such as women (with an emphasis on pregnant women) and children.
While daily fish consumption was associated with a higher probability of overweight/obesity in both men and women, daily/weekly consumption showed a potentially protective association against overweight/obesity in men. Earlier studies(Reference Noreen, Hashmi and Aja65) have suggested that fish, especially marine fish, contain proteins such as taurine, glycine and peptides, along with long-chain n-3 polyunsaturated fatty acids, particularly EPA and DHA. These compounds help regulate lipid metabolism and energy expenditure, and modulate endocannabinoid signalling, all of which contribute to obesity mitigation. However, the elevated odds of overweight/obesity among individuals with daily fish consumption may reflect a demographic with higher socio-economic status and, consequently, greater purchasing power(Reference Vijayan, Suresh and Sabu66) and a predisposition to sedentary behaviours, which collectively contribute to a heightened risk of overweight/obesity compared with non-daily fish consumers. In the richest economic stratum, overweight/obesity rates were higher among daily fish consumers than non-daily consumers for both men (62·7 % v. 57·4 %, respectively; online Supplementary Table S8) and women (60·3 % v. 54·6 %, respectively; online Supplementary Table S12), indicating that even within this affluent group, daily fish consumers exhibit a higher burden of overweight/obesity (a disparity of approximately five percentage points) than their counterparts. The observed reduction in overweight/obesity among men who consume fish daily/weekly suggests that a large proportion of the Indian male population, approximating 40 %(42), adheres to a moderate fish consumption pattern characterised by weekly intake. Systematic reviews suggest that regular fish consumption has a positive impact on thyroid homeostasis and facilitates maintenance of a healthy body weight(Reference Mendivil67).
Both daily and daily/weekly fish consumption were associated with a reduced risk of hypertension in women. This pattern was also observed in men, where regular fish consumption (daily/weekly) was linked with lower odds of hypertension. Elevated BP, especially systolic BP, typically exhibits an upward trend with advancing age, a phenomenon attributable to the progressive decline in arterial wall elasticity inherent in vascular ageing. Fish consumption has been shown to confer a protective effect against hypertension(Reference Del Brutto, Mera and Gillman29,Reference Geleijnse, Giltay and Grobbee30) . This is likely due to the presence of long-chain n-3 PUFA, which possess anti-inflammatory, antioxidative, antiarrhythmic and antithrombotic properties(Reference Mendivil67). Irrespective of fish consumption frequency, both men and women who were overweight/obese, as well as those with higher incomes, demonstrated a reduced likelihood of hypertension. This observation may be attributed to disparities in access to healthcare resources, specifically anti-hypertensive medication, among more affluent men and women(Reference Varghese, Venkateshmurthy and Sudharsanan68). Indians from higher socio-economic backgrounds may have greater access to preventative care, including BP monitoring and pharmacological interventions, which could contribute to lower rates of hypertension within this demographic. CF analysis also indicates that women facing economic disadvantage and those living in states/union territories with access to freshwater fish who consume fish daily or daily/weekly may have an increased likelihood of hypertension. Women who primarily consume freshwater fish may have lower intakes of required ω-3 fatty acids, which could potentially contribute to an increased risk of hypertension. Poverty is a complex issue, with a multifaceted influence on health, and hypertension might be prevalent among the poor, where obesity and sedentary lifestyles might be less common(Reference Anstey, Christian and Shimbo69). Thus, it is safe to infer that daily fish consumption may not always be associated with a reduced risk of hypertension among underserved populations.
This study observed an elevated risk of hyperglycaemia in women regardless of fish consumption frequency. Similarly, men who consumed fish daily or weekly demonstrated an increased likelihood of hyperglycaemia. The observed association between frequent fish consumption (daily or weekly) and an elevated risk of hyperglycaemia in both men and women aligns with prior research utilising self-reported diabetes data from the 2005–2006 National Family Health Survey (NFHS-3)(Reference Agrawal, Millett and Subramanian37). However, those authors cautioned that unmeasured confounding variables may be influencing the observed association and advocated for further investigation(Reference Agrawal, Millett and Subramanian37). This study identified a positive association between frequent fish consumption (daily or weekly) and an elevated risk of hyperglycaemia in both men and women, particularly among individuals with overweight/obesity and those of higher socioeconomic status (rich individuals). This association could be attributed to the prevalence of sedentary lifestyles among individuals with higher socio-economic status and those with elevated body mass indices. It is plausible that the increased consumption of fish, while generally considered beneficial for health, may be insufficient to counteract the detrimental effects of inactivity and excess weight among Indian adults. Further research is needed to explore the complex interplay between fish intake, lifestyle factors and the development of hyperglycaemia. The CF analysis indicated that women residing in states/union territories with abundant marine fish resources may have an increased likelihood of developing hyperglycaemia, as indicated in an earlier study as well(Reference Agrawal and Ebrahim70). This association could be linked to higher salt consumption, as access to marine fish often leads to diets rich in salt-preserved seafood(Reference Patel, Sharp and Luben71). Excessive salt intake is known to disrupt insulin metabolism and induce inflammation, both of which are significant risk factors for developing hyperglycaemia(Reference Shen, Shi and Cui72). Further research is needed to explore this potential link and assess the specific dietary patterns of women in India(Reference Agrawal and Ebrahim70).
Certain limitations of this study should be taken into account while interpreting the results. First, in the NFHS-5, the term ‘fish’ encompasses both finfish (vertebrates) and shellfish (invertebrates), regardless of their marine or freshwater origin, whether they are fresh or dried, processed or salted or smoked or whether they are farmed or wild. In addition, data regarding the consumption of marine mammals and algae were not collected and therefore unavailable for analysis. Second, this study lacks data on the specific cooking methods used to prepare the fish. This may be a significant limitation in Indian context because how fish is cooked can drastically alter its nutritional value. For example, frying fish can add unhealthy fats and reduce its ω-3 content; while baking or grilling may preserve more nutrients(Reference Castro-González, Maafs-Rodríguez and Pérez-Gil Romo73). Third, much of the information on household, men, women and children’s data in NFHS-5 relied on respondents’ recollection, which can be prone to recall errors or social desirability bias (a type of positivity bias in which individuals endorse more favourable responses in order to enhance their own self-presentation). Fourth, a key consideration for readers interpreting the results is that the NFHSs’ use of portable HemoCue Hb analysers with capillary (finger prick) blood samples may have led to overestimated Hb levels compared with venous blood measurements(Reference Rai, Kumar and Sen Gupta16). Fifth, the analytical foundation would have been significantly strengthened by the inclusion of potential confounders in the NFHS data when investigating the link between fish consumption and anaemia and metabolic disorders. Specifically, data on dietary and supplemental intakes of Fe, folate, vitamin B12, vitamin D and vitamin C would have refined the measurement of the net association between fish consumption and anaemia. Likewise, controlling for energy intake (kcal/kg bodyweight), saturated fat intake and sodium/salt intake would have allowed for a more precise assessment of fish consumption’s influence on metabolic disease risk. Furthermore, adjusting for covariates like C-reactive protein and α-1-acid glycoprotein when measuring the association of fish intake with anaemia(Reference Namaste, Rohner and Huang74) and metabolic disorders(Reference Devaraj, Singh and Jialal75) would have provided crucial insights into how inflammation and infectious diseases relate to these observed associations, especially given anaemia’s frequent link to inflammation. Finally, instead of focusing solely on the frequency of fish consumption, future studies should prioritise collecting more comprehensive data on fish consumption. This would include details on the specific types and portions of fish consumed, their source (wild caught v. farmed) and preparation methods, specifying the types and quantities of cooking oils and spices. This would help identify the specific nutrients consumed, which could clarify the relationship between fish consumption and health outcomes, by reducing the residual as evident in tests of endogeneity. Despite these limitations, this study provides novel insights into the association between fish consumption frequency and the prevalence of anaemia and metabolic disease risk factors among adult men and women in India. Furthermore, this study makes a significant contribution to the field of nutrition epidemiology by demonstrating the importance of comprehensive food intake data required for future research investigating the causal relationship between fish consumption and micronutrient deficiency and metabolic disorders.
Overall, this study exploits a nationally representative dataset of India to demonstrate the relationship between frequency of fish consumption and anaemia and metabolic disease risk factors of NCD, namely, overweight/obesity, hypertension and hyperglycaemia among Indian adult men and women. The findings suggest a complex relationship: daily and daily/weekly fish consumption could be effective in anaemia prevention among both men and women, and daily fish consumption may increase the chance of overweight/obesity. Furthermore, while fish consumption may offer protection against hypertension among women, it could potentially increase the risk of hyperglycaemia. These results underscore the need for evidence-based dietary guidelines on fish consumption to optimise public health benefits in India, especially considering the growing demand for fish(Reference Padiyar, Dubey and Bayan39). While fish is recommended as part of a healthy and balanced diet for Indians(64), to better understand the complex relationship between fish consumption and NCD, further research is needed with robust and detailed information on various aspects of fish consumption. For a foundational step, a community-based cohort study could be designed to include robust biomarker measurements (e.g. anaemia measurement using venous blood, adjusted for inflammation) and detailed macro- and micronutrient consumption data from participant-maintained food diaries. This approach would allow for a precise determination of the contribution of fish to macro- and micronutrient intake, and its influence on anaemia and metabolic disorder.
Supplementary material
For supplementary material/s referred to in this article, please visit https://doi.org/10.1017/S0007114525105369
Acknowledgements
The authors gratefully acknowledge the valuable insights of Professor B A Shamsundar (College of Fisheries, Mangalore, India) and Dr. C O Mohan (Indian Council of Agricultural Research – Central Institute of Fisheries Technology, Cochin, India) on how differences in regional cooking methods in India can impact the health benefits of fish consumption.
This research was conducted as part of the Consortium of International Agricultural Research (CGIAR) Centers Research Initiative on Aquatic Foods with funding from the CGIAR Trust Fund donors: https://www.cgiar.org/funders/. The funders had no role in the study design, analysis or interpretation of the data, preparation of the manuscript or decision to publish.
R.K.R. conceptualised the study, conducted the data analysis, drafted, revised and finalised the manuscript. S.B., B.B., B.C.R., R.K., S.K.D., W.N.G., E.H.A., C.M.R., A.P.P., S.V.S. and C.D.G. reviewed or/and provided feedback on the drafts and revisions of the manuscript. E.H.A., C.M.R., A.P.P., S.V.S. and C.D.G. provided overall guidance for the study execution. All authors had full access to entire datasets used in the study and collectively assumed final responsibility for the decision to submit the manuscript for publication.
The authors declare no conflicts of interest.
This study was conducted according to the guidelines laid down in the Declaration of Helsinki. Before the National Family Health Surveys were carried out, the International Institute for Population Sciences in Mumbai, India, which implemented the survey, received ethics approval from an independent ethics review committee set up by the Ministry of Health and Family Welfare, Government of India. Thus, no separate ethics approval was required for this study.


 Open access