Lipid malabsorption syndrome (LMS) has been observed for more than a decade in farmed Atlantic salmon in Norway(Reference Olsen and Hellberg1). An ongoing screening of gut health in Norwegian cultivated salmon shows that LMS is still a frequent occurrence at all developmental stages(Reference Chikwati, Li and Wang2). The typical macroscopic characteristic of fish with LMS is a pale and foamy surface of the pyloric intestine (PI) and pyloric caeca, in some cases extending to the mid intestine (MI), due to excessive lipid accumulation in the enterocytes. The likely explanation is limited lipid transport capacity. Our previous study(Reference Hansen, Kortner and Krasnov3) indicates that choline synthesis in post-smolt Atlantic salmon in seawater is insufficient to cover the requirement. One consequence of the shift from marine to plant-based diets is a lower content of choline, in the form of phosphatidylcholine in the raw materials(Reference Li and Vance4). An exogenous supply of choline may therefore be essential for normal metabolism, transport and export of lipids across the mucosa of the pyloric caeca and for prevention of LMS in salmon, in the seawater phase(Reference Hansen, Kortner and Krasnov3).
Choline is defined as an essential nutrient for mammals(Reference Gibellini and Smith5), whereas phosphatidylcholine is not, as it can be synthesised if choline is present. Regarding fish, essentiality has been established, as reported by the National Research Council (NRC)(6), but only for early stages, and the requirement differs between the species(6–Reference Qin, Dong and Tan12). For salmonids, the NRC suggests a requirement of 800 mg/kg for both rainbow trout and some species of Pacific salmon(6). However, also higher requirements about 3000 mg/kg have been indicated for Pacific salmonids(Reference Halver, Halver and Hardy13). Studies on juvenile rainbow trout suggest an inverse relationship between initial body weight and choline requirement. Estimated choline requirement for 0·12, 1·4, 3·2 and 3·5 g fish is 3000, 813, 714 and between 50 and 100 mg/kg diet, respectively(6,Reference Poston14,Reference Rumsey15) . At present, no requirement estimates are established in the scientific literature for any life stages of Atlantic salmon(6). The available studies addressing choline requirement for early stages of fish development show that deficient supply causes symptoms such as poor growth and low feed efficiency, fatty liver, high mortality and anorexia(Reference Duan, Zhu and Han11,Reference Rumsey15,Reference Ketola16) . Lipid accumulation in the intestinal mucosa is seldom an observed endpoint in studies of choline deficiency and requirement but was observed in an early study of Japanese eel (Anguilla japonica) as ‘white-grey coloured intestines’(Reference Arai, Nose and Hashimoto17). The symptoms appear similar to those observed in Atlantic salmon with LMS. Other studies have shown that phosphatidylcholine may prevent lipid accumulation in the intestinal mucosa and might be the limiting factor for lipid cell transport(Reference Olsen, Myklebust and Ringø18–Reference Carmona-Antoñanzas, Taylor and Martinez-Rubio24). In these, dietary supplementation with phosphatidylcholine was observed to reduce the formation of enterocytic lipid droplets and was an important factor in lipoprotein formation(Reference Geurden, Bergot and Schwarz22,Reference Hadas, Koven and Sklan25–Reference Daprà, Geurden and Corraze27) necessary for exporting dietary lipid from the gut(Reference De Santis, Taylor and Martinez-Rubio20,Reference Olsen, Myklebust and Kaino28,Reference Tocher, Bendiksen and Campbell29) . The apparent disturbance in lipid metabolism of fish fed diets with high level of plant ingredients is also observed on the molecular level. Expression of genes involved in lipid metabolism seems to reflect reduced lipid export from the enterocytes(Reference Kennedy, Bickerdike and Berge10,Reference De Santis, Taylor and Martinez-Rubio20–Reference Coccia, Varricchio and Vito38) .
However, the key components and mechanisms involved and the mechanisms underlying the excessive lipid accumulation are not yet understood. The present study is part of a PhD-programme aiming to gain knowledge on mechanisms underlying development of LMS in Atlantic salmon and to find optimum levels of choline in diets for Atlantic salmon. As far as our literature review has shown, no dose–response studies with choline in diets for Atlantic salmon in seawater have been reported so far. The aim of the present study was, therefore, to estimate the choline requirement of Atlantic salmon under saltwater conditions, as indicated by excessive lipid accumulation in the intestine.
Materials and methods
Diets
A low fishmeal, high plant diet (LF1) was used as a reference diet, containing 10 % Nordic low temperature (LT) fishmeal. The total lipid content was 70 % rapeseed oil and 30 % fish oil. The diet formulation and analysed chemical composition can be found in Table 1. The choline supplemented diets (LF2–LF9) were made by supplementing the LF1 diet with eight levels of choline chloride 70 %. Table 2 shows supplemented and analysed choline content in the experimental diets. The choline analyses indicate a higher than expected variation in the results. However, there was no systematic deviation. Therefore, the high variation should not affect the estimates of choline requirement. The diets were supplemented with standard vitamin and mineral premixes in accordance with NRC guidelines (2011) and BioMar standards to meet the requirements. Yttrium oxide (0·50 g/kg) was added as an inert marker for estimation of nutrient apparent digestibility (AD). The experimental diets were produced by extrusion (feed pellet size 6 mm) at BioMar Feed Technology Centre using a BC 45 twin screw extruder (Clextral).
Formulation and chemical composition of the basal diet

LT, low temperature; SPC, soya protein concentrate; CWD, cold water dispersible.
* Low fishmeal basal diet.
† Supplied by Norsildmel AS.
‡ Supplied by Selecta S/A.
§ Supplied by Cargill Nordic.
‖ Supplied by DLG Food Grain.
¶ Supplied by HC Handelscenter.
** Supplied by Roquette.
†† Supplied by FF Skagen.
‡‡ Supplied by Emmelev.
§§ Supplemented to meet the requirements.
‖‖ Inert marker for the evaluation of nutrient digestibility.
¶¶ Supplied by Balchem.
Supplemented and analysed choline (mg/kg) in experimental diets

Experimental animals and conditions
The experiment was conducted at Nofima’s Research Station at Sunndalsøra, which is a research facility approved by Norwegian Animal Research Authority and operates in accordance with Norwegian Regulations of 17 June 2008 No. 822: Regulations relating to Operation of Aquaculture Establishments (Aquaculture Operation Regulations). Trial fish were treated in accordance with the Aquaculture Operation Regulations during the trial. Fish were randomly sampled, anaesthetised and killed by a sharp blow to the head, in accordance with the Norwegian Animal Welfare act. No surgical manipulation of live fish was conducted, and tissue samples were only retrieved from euthanised fish. Ingredients commonly used in commercial diets were used in the experimental diets and did not cause the fish any apparent distress. No Norwegian Animal Research Authority approval was required according to §2 of the Norwegian Regulation on Animal Experimentation.
Atlantic salmon (Salmo salar L., post-smolt, Sunndalsøra strain) with a mean initial weight of 456 (sd 65) g were pit tagged, individually weighed and randomly allocated into nine fibreglass tanks. Each tank contained 300 litres of saltwater, thirty-five fish and initial and final fish densities of 53 and 127 kg/m3, respectively. The density was high, but within limits found compatible with good growth, health and welfare of fish under the condition that O2 supply is sufficient(Reference Bæverfjord, Bøe and Erikson39). The tanks were supplied with flow through seawater. Salinity ranged between 32 and 33 g/l. The water flow was increased accordingly to the increase in biomass over time and to maintain O2 saturation above 80 %. The O2 content of the outlet water was monitored once a week or more often in periods with larger temperature variations. The water temperature varied between 7·5 and 14·0°C during the experimental period (from July to September 2012), with an average of 10·5°C, and a constant 24-h light regimen was employed during the experimental period. Each tank was fed one experimental diet. Feed waste could not be collected and therefore feed intake was not measured. The daily amount of feed given was calculated from the expected biomass and daily growth rate and added with 15 % to secure feeding to ad libitum. The fish were fed using disc feeders.
Sampling
After 92 d, feeding was terminated. From each tank, ten fish were anaesthetised with tricaine methane-sulfonate (MS-222). Weight and length were recorded for all fish, and blood was sampled from the caudal vein in vacutainers with lithium heparin. The vacutainers were stored on ice prior to plasma preparation. Plasma was sampled in 2 ml aliquots and snap-frozen in liquid N2 and stored at –80°C. Following blood sampling, the fish were killed by a sharp blow to the head and opened ventrally. The gastrointestinal tract was removed from the abdominal cavity, cleared of other organs and adipose tissue and sectioned as follows: PI: the section from the sphincter to the most distal pyloric caeca; MI from the distal end of PI and proximal to the increase in intestinal diameter; distal intestine (DI) section from the distal end of MI to the anus. The tissues of the PI and DI were collected and weighed, whereas the digesta from these two sections were split into two samples, that is, the proximal half (PI1 and DI1, respectively) and distal half (PI2 and DI2, respectively). The intestinal samples were snap-frozen in liquid N2 and stored at –80°C. The liver was also weighed. An additional eight fish per tank were euthanised prior to sampling of the pyloric caeca for histological and gene expression analyses. The remaining fish in each tank were stripped for faeces as described by Austreng(Reference Austreng40). The remaining fish were then fed for one more week for an additional stripping in order to collect enough sample for analysis. The faecal samples were pooled for each tank, frozen immediately in liquid N2 after stripping and stored at –80°C until analysis. Tissues sampled for histological examination were fixed in 10 % neutral-buffered formalin (4 % formaldehyde). Samples for gene expression analyses were rinsed in sterile saline water, submerged in RNAlater® and kept at 4°C for 24 h and subsequently kept at –40°C until analysis.
Histology
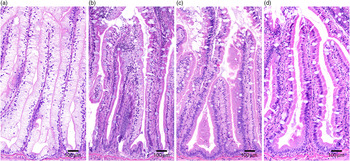
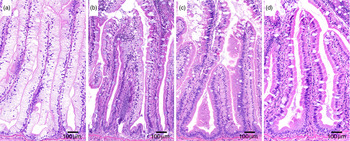
Pyloric caeca samples were processed at the Norwegian University of Life Sciences (NMBU) using standard histological techniques and stained with haematoxylin–eosin. The samples were evaluated for enterocyte vacuolation blinded in a randomised order using a light microscope. The appearance of lipid-like vacuoles was assessed semi-quantitatively by the proportion of total tissue affected: marked (≥50 %), moderate (25–50 %), mild (10–25 %) and normal (≤10 %) and presented as percentages of vacuolated enterocytes (Fig. 1).
Histological severity of vacuolation of the pyloric caeca tissue, representative for (a) marked, (b) moderate, (c) mild and (d) normal.
Gene expression
Quantification of gene expression was conducted on pyloric caeca samples from fish fed the LF1 and LF3–8, in accordance to the Minimum Information for Publication of Quantitative Real-Time PCR experiments (MIQE) standards(Reference Bustin, Benes and Garson41). Total RNA from pyloric caeca samples (about 30 mg) were extracted using a Ultraturrax homogeniser, Trizol® reagent (Invitrogen) and chloroform according to the manufacturer’s protocol. The obtained RNA was DNase treated (TURBO™, Ambion, ThermoFisher Scientific) and purified using a Direct-zol RNA purification kit (Zymo Research). RNA integrity of all samples was assessed by gel electrophoresis, and in addition, selected samples were verified with a 2100 Bioanalyser using a RNA Nano Chip (Agilent Technologies). The RNA integrity number (RIN) values were all >8. RNA purity and concentrations were measured using the NanoDrop ND-1000 Spectrophotometer (NanoDrop Technologies). Total RNA was stored at –80°C for future use.
First-strand complementary DNA synthesis was carried out using five fish from each tank and Superscript III in 20 µl reactions (Invitrogen, ThermoFisher Scientific) using 0·8 µg total RNA and oligo (dT)20 primers. Negative controls were performed in parallel by omitting RNA or enzyme. The obtained complementary DNA was diluted 1:10 before use and stored at –20°C. A total of twenty-six target genes with key functions in lipid and sterol metabolism were profiled by quantitative PCR. Information of gene categories and functions is provided in online Supplementary Table S1. PCR primers were obtained from the literature or designed using Primer3web version 4.0.0 (http://bioinfo.ut.ee/primer3/). Detailed information of the primers is shown in online Supplementary Table S1. PCR reaction efficiency (E) for each gene assay was determined separately using 2-fold serial dilutions of randomly pooled complementary DNA. A LightCycler 480 (Roche Diagnostics) was used for DNA amplification and analysis of the expression of individual gene targets. Each 10 µl DNA amplification reaction contained 2 µl PCR-graded water, 2 µl of 1:10 diluted complementary DNA template, 5 µl of LightCycler 480 SYBR Green I Master (Roche Diagnostics) and 0·5 µl of each forward and reverse primer. Each sample was assayed in duplicate in addition to a no template control. The three-step qPCR programme included an enzyme activation step at 95°C for 5 min followed by forty or forty-five cycles (depending on the individual gene tested) of 95°C (10 s), 58, 60 or 63°C (10 s depending on the individual gene tested) and 72°C (15 s). Quantification cycle (Cq) values were calculated using the second derivative method. The PCR products were evaluated by analysis of melting curve and by agarose gel electrophoresis to confirm amplification specificity. All primer pairs gave a single-band pattern on the gel for the expected amplicon of interest in all reactions. For target gene normalisation, actb, ef1a, gapdh, rnapolII and rps20 were evaluated for use as reference genes by ranking relative expression levels according to their stability, as described previously(Reference Kortner, Valen and Kortner42). The rnapolII showed a stable expression pattern and was therefore used as a normalisation factor. Mean normalised expression of the target genes was calculated from raw Cq values by relative quantification(Reference Muller, Janovjak and Miserez43).
Chemical analyses
Diets and faecal samples were analysed for DM (after heating at 105°C for 16–18 h), ash (combusted at 550°C to constant weight), crude protein (by the semi-micro-Kjeldahl method, Kjeltec-Auto System, Tecator), lipid (diethylether extraction in a Fosstec analyser (Tecator) after HCl-hydrolysis), starch (measured as glucose after hydrolysis by α-amylase (Novo Nordisk A/S) and amylo-glucosidase (Bohringer Mannheim GmbH), followed by glucose determination by the ‘Glut-Dh method’ (Merck Darmstadt)), gross energy (using the Parr 1271 Bomb calorimeter; Parr) and yttrium (by inductivity coupled plasma mass-spectroscopy as described by Refstie et al.(Reference Refstie, Helland and Storebakken44). The plasma variables, NEFA, cholesterol (CH) and total TAG, were analysed according to standard procedures at the Central Laboratory of the NMBU. Lipoprotein profile analyses (HDL, LDL and VLDL) in plasma were carried out by size exclusion chromatography and measurements of CH and TAG online using microlitre sample volumes as described by Parini et al.(Reference Parini, Johansson and Bröijersén45). Isotop dilution MS as described by Lund et al.(Reference Lund, Sisfontes and Reihner46) was used for analysing lathosterol. 7α-Hydroxy-4-cholesten-3-one (C4) was analysed by isotope dilution and combined HPLC–MS as described by Lövgren-Sandblom et al.(Reference Lövgren-Sandblom, Heverin and Larsson47). Plasma levels of oxysterols, sitosterol and camposterol were analysed by isotope dilution and combined GC–MS after hydrolysis as described by Dzeletovic et al.(Reference Dzeletovic, Breuer and Lund48) for the first mentioned and by Acimovic et al.(Reference Acimovic, Lövgren-Sandblom and Monostory49) for the last two mentioned. The pyloric caeca tissue from four fish from each of the LF1 and LF6 diets was analysed for the lipid classes NEFA, monoacylglycerol, diacylglycerol (DAG), TAG and phospholipid (PL). Four fish were considered sufficient to reveal differences in lipid characteristics of fish from these treatments. Lipid was extracted according to a modified Folch procedure(Reference Pedersen and Grav50,Reference Folch, Lees and Sloane Stanley51) . Duplicate samples were individually applied to TLC plates to separate the lipid classes: NEFA, PL, TAG and DAG. The various lipid classes were identified by comparison with standards(Reference Kjær, Aursnes and Berge52). The respective spots were scraped into reaction vials, and the results of the further chemical(Reference Mason and Waller53,Reference Hoshi, Williams and Kishimoto54) were analysed using the Hewlett-Packard Chem Station Software. In the analysis, the PL composition was related to the C23 : 0 peak, the NEFA composition to the C12 : 0 peak and the TAG and DAG compositions to the C13 : 0 peak. The combined weights of each lipid class sample thus calculated were corrected for contents of non-fatty acid material (e.g. glycerol phosphate) by multiplying each weight with appropriate factors as given by Christie(Reference Christie55).
Calculations
Growth of the fish was calculated as specific growth rate (percentage growth per d): specific growth rate = ((ln FBWg/ln IBWg)/D) × 100. IBW and FBW are the initial and final body weights, respectively (tank means), and D is the number of feeding days. The condition factor was calculated as: CF = FBW × 100)/Fork length cm3). Organosomatic indices (OSI) were calculated as: (organ weight g/body weight g) × 100). Apparent digestibilities (AD) of main nutrients were estimated by using Y2O3(Reference Austreng, Storebakken and Thomassen56) as an inert marker and calculated as follows: ADn = 100 – (100 × (M feed/M faeces) × (N feed/N faeces)), where M represents the percentage of the inert marker in feed and faeces and N represents the percentage of a nutrient in feed and faeces. The 95 % confidence range for choline requirement for the selected biomarkers = the choline requirement level ± 2 × sem.
Statistical analysis
Data were tested for normality and homogeneity of variance using Shapiro–Wilk and Brown–Forsythe tests, respectively. When necessary, data were log transformed to obtain homogenous variance (indicated by ‘X’ in online Supplementary Table S4). Responses of the supplemented levels of choline were evaluated using polynomial regression analyses. Visual examination of the results indicated that, for the data showing a clear relationship with dietary choline level, a second-degree function would fit the biomarkers well and be suitable for the main aim of the present study, to estimate a minimum required level of choline in salmonid diets for fish raised under conditions similar to the present. For the OSI of PI and DI, and the genes which showed significant correlation with choline level, the quadratic broken line model was applied for estimation of required level of choline(Reference Shearer57). Tank mean was used as the statistical unit. Effects on lipid classes and fatty acids in lipid classes were tested for significance by t test with individual fish as the statistical unit. All data are presented as mean values with their standard errors. The level of significance for all analyses was set at P < 0·05, and P values between 0·05 and 0·1 were considered as indications of effects and mentioned as trends.
Results
Apparent nutrient digestibility and growth performance
Increasing choline inclusion did not affect apparent nutrient digestibility (AD) significantly for either protein, lipid or starch. The average AD was 90·5 (sem 0·14) for protein, 98·0 (sem 0·14) for lipid and 69·2 (sem 0·95) for starch. No important relationships were observed between choline level and fatty acid digestibility (online Supplementary Table S2). Regression analysis did not reveal any significant relationship between choline inclusion level and growth (specific growth rate). However, a significant inverse relationship between CF and choline level was observed, but the R 2 for the model was very low (R 2 0·059, P = 0·008; online Supplementary Table S2), and therefore, the results were not considered beneficial for the estimation of choline requirement. The mean values are presented in Table 3.
Choline effects on specific growth rate (SGR), condition factor (CF) and organosomatic indices (OSI)
(Mean values with their pooled standard errors)

Organosomatic indices, pyloric tissue lipid content and histology
Among the OSI, those for PI and MI (OSI PI and OSI MI) decreased significantly with increasing choline levels. For the other OSI, that is, DI and liver, no significant relationship with increasing choline levels was observed (online Supplementary Table S2). Mean values are presented in Table 3. The choline (mg/kg) requirement level, estimated by a linear broken line model, was lower for OSI PI (3090 (sem 212)) and OSI MI (2496 (sem 538)) than estimated by the quadratic model which indicated average requirements of 3593 (sem 226) and 3031 (sem 195) mg/kg diet, respectively (Fig. 2).
Illustration of choline requirement (mg/kg) by broken line models with linear (a and c) and quadratic (b and d) portion of OSI PI (% of body weight) (a and b) and OSI MI (% of body weight) (c and d). OSI, organosomatic index; PI, pyloric intestine; MI, mid intestine.

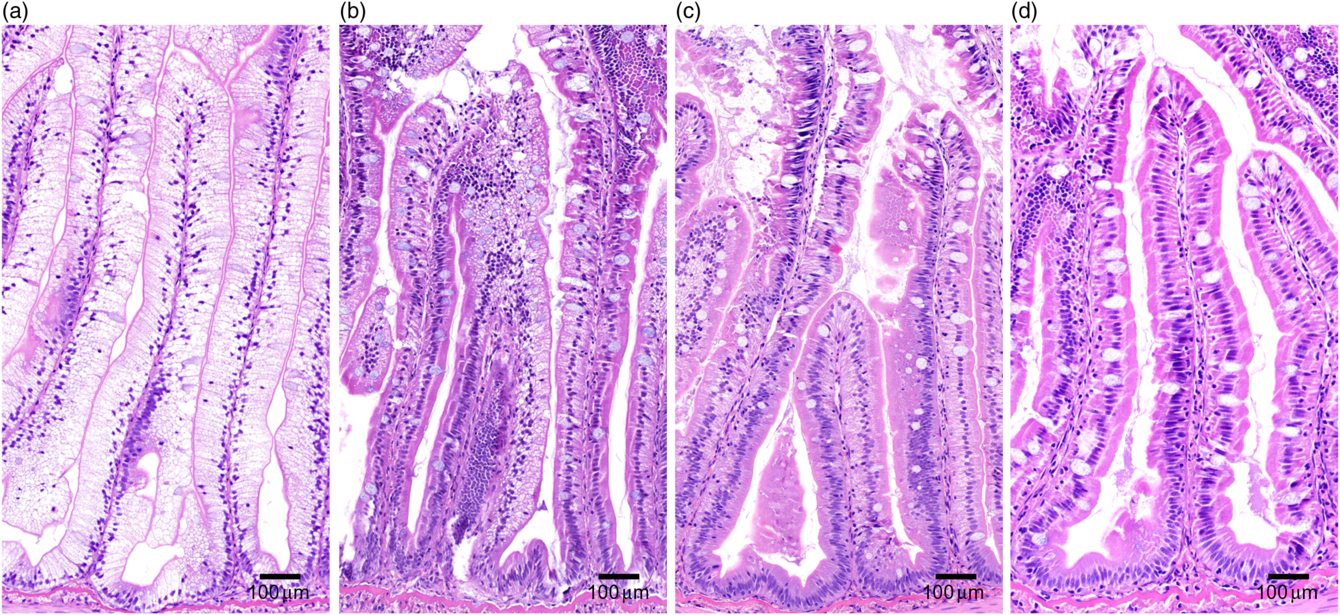
Regression analysis revealed a significant inverse relationship also between choline level and the macroscopically observed degree of whiteness and histologically observed lipid vacuolation (online Supplementary Table S2). The results of the macroscopically and histologically examinations of the pyloric caeca showed an absence of symptoms at choline levels of 2850 and 2310 mg/kg, respectively (Figs. 3–5).
Results of visual examination of the macroscopic appearance of whiteness of the pyloric intestine (n 8).  , Normal;
  , pale pyloric intestine.

Results of histological examination and evaluation of degree of vacuolation in the pyloric caeca (n 8).  , Normal;
  , mild;
  , moderate;
  , marked.

Representative images of histological appearance of lipid in pyloric caeca in fish fed diets with various levels (mg/kg) of choline: (a) 1340, (b) 1540, (c) 1760 and (d) 2310.

Concentration of TAG (P = 0·026) and DAG (P = 0·039) in the pyloric tissue, analysed only for fish fed the LF1 (1340 mg choline/kg) and LF6 (2850 mg choline/kg) diets, showed great and significant effects of choline supplementation (Fig. 6). Compared with the results for the LF1 diet, the concentrations of TAG and DAG decreased by 76 and 63 %, respectively, in fish fed the LF6 diet. No significant difference due to choline supplementation was found for NEFA or PL. Fatty acid profiles within the lipid classes TAG, DAG, NEFA and PL of the pyloric caeca tissue are presented in online Supplementary Table S3. Significant effects of choline supplementation are highlighted in Fig. 7. Choline affected a higher number of fatty acids in PL than in the other lipid classes.
Concentration (mg/g tissue) of TAG, diacylglycerol (DAG), NEFA and phospholipids (PL) in pyloric tissue from fish fed diets with 1340 mg/kg choline (LF1, n 4) and 2850 mg/kg choline chloride (LF6, n 4). Monoacylglycerol did not show measurable concentrations in the tissue. * Concentrations of TAG and DAG differed significantly (P = 0·026 and P = 0·039, respectively). For NEFA and PL, the differences were not significant (P = 0·328 and P = 0·253, respectively) (data log transformed).

Fatty acids (% of lipid) in TAG, diacylglycerol (DAG), NEFA and phospholipids (PL) of pyloric caeca tissue showing significant (P < 0·05, data log transformed) effects of choline supplementation, that is, comparing samples from fish fed the diets LF1 (n 4) and LF 6 (n 4). Monoacylglycerol did not show measurable levels.  , LF1;
  , LF6.

Intestinal chyme DM and bile salt concentration
Increasing choline inclusion did not significantly affect the DM content of digesta nor the bile salt concentration along the intestine (Table 4 and online Supplementary Table S2).
Intestinal DM and bile salt levels in digesta of Atlantic salmon
(Mean values with their pooled standard errors)

PI, pyloric intestine; MI, mid intestine; DI, distal intestine.
Intestinal gene expression
The regression analysis results and the mean values of the results from the qPCR analyses of the pyloric tissue are presented in online Supplementary Tables S2 and S4, respectively. Fig. 8 illustrates that the expression of the genes showing a significant regression or a trend (0·05 < P > 0·1) and an estimated choline requirement are shown for pcyt1a which is involved in the phosphatidylcholine synthesis, for apoAIV and apoAI, involved in the lipoprotein assembly and plin2, the general marker for lipid load of non-adipogenic cells. Among three enzymes chk, pcyt1a and pemt, all involved in the pathway of phosphatidylcholine biosynthesis, pcyt1a decreased significantly and chk showed the same trend with increasing levels of choline, whereas pemt was not significantly affected. A significant reduction in expression by an increased level of choline was also observed for mtp and fatp, involved in lipid transport. Moreover, both apoAIV and apoAI showed a dose–response curve, increasing with increasing choline doses, levelling off at the highest inclusion level. A decreasing response was observed for hmgcr, an important enzyme in the regulation of the CH biosynthesis. The expression of plin2 also decreased for then to reach a plateau at the highest choline inclusion levels. The apoAIV and apoAI revealed choline requirement levels not far from each other, 2593 (sem 108) and 2610 (sem 35) mg/kg, respectively. Similarities in choline requirement levels were also observed for pcyt1a and plin2 (3210 (sem 404) and 3199 (sem 360) mg/kg, respectively; Fig. 8).
Illustration of relationships between dietary choline concentration levels (mg/kg) and mean normalised expression (MNE) of chk, pcyt1a, fatp, mtp, apoAIV, apoAI, hmgcr and plin2 in pyloric caeca tissue from fish fed the diets LF1 and LF3–8 (n 5). The curves illustrate the regression that fits the results best. The dotted vertical lines indicate estimated choline requirement level.

Blood plasma end points
The regression analysis revealed a significant positive relationship between choline level and LDL-cholesterol, and a similar trend was observed for total plasma CH levels (online Supplementary Table S2). Blood plasma mean values are presented in Table 5. The HDL contained most of the plasma CH, and there was a trend towards increasing levels with increased dietary choline levels. Lathosterol is a steroid intermediate in the CH synthesis, and the circulating level reflects CH synthesis in the liver. The circulating lathosterol levels were significantly and positively correlated with dietary choline level (online Supplementary Table S2). For the other blood plasma values, presented in online Supplementary Table S2, no significant relationship with increasing choline levels was observed.
Blood plasma variables (n 8 fish per diet)
(Mean values with their pooled standard errors)

C4, 7α-hydroxy-4-cholesten-3-one.
Estimates of choline requirement level
Among all biomarkers observed in the present investigation, those showing significant effects of dietary choline level, and which may indicate choline requirement level: macroscopically observed whiteness, histologically observed vacuolation, OSI PI, OSI MI, pcyt1a, apoAIV, apoAI and plin2, are presented in Fig. 9. The statistical analyses of OSI PI and OSI MI revealed sem values of 6 % of the estimated requirement of choline for both biomarkers. Assuming that the sem for the biomarkers macroscopic whiteness and histological vacuolation were of similar magnitude, the means and ranges indicating 95 % confidence limits are illustrated in Fig. 9. The means ranged between 2310 and 3593 mg/kg of choline, with an average of 2936 mg/kg.
Choline requirement level as indicated by biomarkers of various indicators of lipid assembly, storage and transport. Horizontal lines ( ) indicate estimated 95 % confidence range (estimated mean ± 2sem) for optimum choline level for each biomarker. OSI, organosomatic index; PI, pyloric intestine; MI, mid intestine.

Discussion
The main finding of the present study was a clear inverse relationship between dietary choline level and the degree of vacuolation in the mucosa of the PI of Atlantic salmon reared in seawater. Characterisation of the lipid content of the mucosa showed a marked decrease also in lipid content, mainly due to a reduction in TAG and DAG in the pyloric caeca. The concomitant alterations in expression of genes related to phosphatidylcholine synthesis, CH biosynthesis, lipid transport and the general marker for lipid load confirmed the essentiality of choline in lipid turnover in the intestinal mucosa and the ability to prevent lipid vacuolation and LMS. These findings form a basis for estimation of choline requirement as well as for understanding the mechanisms underlying lipid transport across the intestinal mucosa to the peripheral circulation.
Estimation of choline requirement
Indicators of gut mucosa lipid transport have rarely been used as response criteria in studies addressing choline function and requirement in previous investigations. Accordingly, the same is the situation regarding the literature reviewed as the basis for the estimates of choline requirement such as in the NRC’s nutrient requirement of fish and shrimp(6). Weight gain and liver lipid content have more often been end points in studies addressing choline requirement(Reference Wilson and Poe7,Reference Shiau and Lo9,Reference Halver, Halver and Hardy13,Reference Rumsey15,Reference Ketola16,Reference Griffin, Wilson and White58,Reference Craig and Gatlin59) . Those indicators, however, are not necessarily the optimal biomarkers for the estimation of choline requirement in larger fish. Indicators of efficiency of lipid transport in the mucosa of the PI, supposedly the organ with the highest lipid turnover(Reference Denstadli, Vegusdal and Krogdahl60), particular in rapidly growing fish fed high lipid diets, may be more suitable biomarkers for choline requirement. In our previous study(Reference Hansen, Kortner and Krasnov3), we observed that the PI was the most sensitive tissue for studying the effects of variation in dietary choline. The present study confirms this observation, showing clear effects of choline level on the PI somatic index, macroscopically observed degree of whiteness and histologically observed lipid vacuolation in PI, whereas no significant effect on liver index was observed. The biomarkers presented in Fig. 9 are those showing significant correlation to dietary choline levels in our study, that is, with a response curve that makes them potential indicators for choline requirement.
The mean requirements indicated by the biomarkers differed. Running requirement studies with fish differ from studies involving terrestrial animals since the experiments are carried out in water and this requires special considerations related to controlling the actual feed intake. The book, Nutrient Requirements of Fish and Shrimp (6), provides guidance on methodology and data analysis for nutrient requirement studies. There is no general agreement regarding which biomarkers give the most relevant estimates for requirements, but it is generally agreed upon that the biomarker should functionally have a close relationship with the nutrient in question and show a clear dose–response relationship with intake at levels below requirement. Although the OSI PI indicated the highest choline requirement, it may not be appropriate as a biomarker to be used for the requirement estimation. The PI, as with the other parts of the intestine, has the ability to enlarge and diminish according to needs as a natural adaptation to variation in nutritional quality of the diet(Reference Yan and Qiu-Zhou61). The histologically observed degree of vacuolation and the macroscopically observed appearance of whiteness may be biomarkers more closely related to choline requirement and may be more relevant biomarkers, indicating overall lipid transport processes, and may therefore be the biomarkers best suited for the estimation of choline requirement. The PI whiteness gave the highest estimate of choline requirement of the two, that is, 2850 mg/kg for whiteness and 2310 mg/kg for hypervacuolation. The difference between the two may be related to the fact that macroscopic examination summarises characteristics of the whole PI tissue, whereas the histological examination observes a very limited area of a small sample of the pyloric caeca.
Regarding the four gene expression biomarkers suitable for requirement estimation, apoAIV (2592 mg/kg) and apoAI (2610 mg/kg) suggest average choline requirements between those of whiteness (2850 mg/kg) and hypervacuolation (2310 mg/kg), whereas pcyt1a (3210 mg/kg), as well as plin2 (3199 mg/kg), suggests higher requirements. The 95 % confidence range for the biomarker macroscopic whiteness overlaps with all the ranges for the other selected biomarkers for choline requirement, making it reasonable to suggest the average of the choline requirements for the biomarkers as the estimate for the present study, that is, 2936 mg/kg. It should be a goal for an optimal diet to cover the needs of 95 % of the fish, that is, 2× sem should be added to the mean. In the present experiment, the recommended choline level, for prevention of LMS, is estimated to be 3350 mg/kg or 3·4 g/kg (Fig. 9).
With a key role in lipid transport and metabolism, it is likely that choline requirement depends on dietary lipid level and feed intake, which we may call lipid load. In the present study, the diets contained 29 % lipid, and the average specific growth rate was 0·94 % (thermal growth coefficient: 2·7). At higher growth rates, higher feed intakes and/or higher dietary lipid levels, higher choline level may be required. Further studies are needed for the characterisation of these relationships. The natural prey of wild Atlantic salmon can have a very high lipid content. Depending on the season, the lipid content in a herring from the North Sea can be as high as 50 % on a DM basis (25 % as is). There is a general lack of knowledge regarding the degree of lipid vacuolation in the intestines in a wild salmon during optimal periods where access to different foodstuff is high.
Dietary choline level effects on intestinal lipid transport
The present study showed a clear decreasing effect of choline level on the somatic index of PI, macroscopically observed degree of whiteness and histologically observed lipid vacuolation in PI. In the most serious cases of vacuolation, observed for the lowest levels of choline, the macroscopic whiteness continued from the PI and further down into the MI. Previous studies have shown that Atlantic salmon can use both PI and MI for absorption of long-chain fatty acids, for example, C18 : 1(Reference Denstadli, Vegusdal and Krogdahl60). It seems possible that our observation of lipid vacuolation in the MI could be related to periods when the fish experience a lipid load higher than the capacity of the PI. These results substantiate that dietary choline increases the capacity of the PI to absorb and transport the lipid from the enterocytes(Reference De Santis, Taylor and Martinez-Rubio20–Reference Geurden, Bergot and Schwarz22,Reference Olsen, Myklebust and Kaino28,Reference Tocher, Bendiksen and Campbell29) . The observed lower level of TAG in the fish given the diet with 2850 mg/kg choline compared with the un-supplemented diet with 1340 mg/kg, in combination with the absence of lipid accumulation and no significant differences in lipid digestibility, indicated an increased flux of TAG across the tissue from the gut lumen to the portal vein, as a result of choline supplementation(Reference Krahmer, Guo and Wilfling62). This conclusion is consistent with other studies observing that dietary phosphatidylcholine prevents accumulation of TAG in the intestinal mucosa(Reference Fontagne, Geurden and Escaffre21,Reference Salhi, Hernández-Cruz and Bessonart23) . Our results also support the general understanding that TAG is the primary lipid class in lipid stores(Reference Tocher, Bendiksen and Campbell29), also in the intestinal mucosa, in the form of lipid droplets in the enterocytes(Reference Fontagne, Geurden and Escaffre21,Reference Olsen, Myklebust and Kaino28,Reference Sire, Lutton and Vernier63,Reference Caballero, Obach and Rosenlund64) .
The lower content of DAG in fish fed the choline supplemented diet may indicate increased use for incorporation into phosphatidylcholine(Reference Carmona-Antoñanzas, Taylor and Martinez-Rubio24). Since all the diets had the same fatty acid compositions, the fatty acid profile in the lipid fractions of the pyloric caeca was not expected to vary. Yet, some compositional differences were observed within all lipid fractions. Choline supplementation seemed to have the greatest impact on the fatty acid profile in PL. A significant impact was observed for several fatty acids ranging from C16 to C22, with the largest effects on the levels of 20 : 5n-3 (EPA) and 18 : 3n-3. A modulation of the fatty acids in the PL fraction of the tissue was also observed in a previous study on gilthead seabream larvae showing that lecithin and phosphatidylcholine supplementation increased the incorporation of 18 : 1n-9(Reference Hadas, Koven and Sklan25,Reference Koven, Kolkovski and Tandler26) . Our observation of a lower content of EPA in the PL fraction with increasing choline level is suggested to be a result of increased lipid transport from the gut and might, if analysed, have been seen as an increase of EPA in other body compartments of the fish such as heart, liver, brain or muscle. The magnitude of the changes in the fatty acid profile of the PL, as a result of choline supplementation, warrants further investigations.
For further transport to the systemic circulation and to the peripheral tissues from the epithelial cells, the TAG must be incorporated into lipoproteins(Reference Sire, Lutton and Vernier63). This lipoprotein production involves a series of biosynthetic processes, whereby the large hydrophobic core of the lipoprotein, containing TAG, CH esters, lipid soluble vitamins and other highly lipophilic compounds, is covered by a thin coat in which phosphatidylcholine plays an important role, in addition to apo and free CH(Reference Vernier and Sire65,Reference Field and Mathur66) . Our observations of dietary choline increasing the flux of TAG across the epithelial cells and preventing accumulation of TAG in the epithelial mucosa were further supported by concomitant expression changes in genes involved in several processes of the lipid turnover. The decreased expression of mtp, coding for transporters facilitating the transport of TAG by assisting in the assembly of the lipoprotein, with increasing choline level, is in agreement with findings presented earlier. These findings show lower expression of mtp in fish fed a fishmeal diet, supposedly with higher choline level, compared with the plant-based diet(Reference Gu, Kortner and Penn36). The same decreasing expression, induced by choline, was observed for the fatty acid transporter fatp. Dietary choline is rapidly transformed to phosphatidylcholine by the cytidine-diphospho (CDP)–choline pathway when entering the PI(Reference Li and Vance4,Reference Gibellini and Smith5) . The present study confirmed the results from our previous study(Reference Hansen, Kortner and Krasnov3), showing suppressed levels of chk and pcyt1a, which proteins catalyse the initial and second rate-limiting steps in the CDP–choline pathway for phosphatidylcholine synthesis, respectively. The concomitant decrease of both chk and pcyt1a by increasing choline levels could be a result of an increased production of phosphatidylcholine in the fish by increasing dietary choline doses and that phosphatidylcholine inhibits its own synthesis pathway through a negative feedback control. The genes coding for apoAI and apoAIV, both important components for a successful production and secretion of the lipoproteins, showed a significant response with increasing choline level. In studies with various fish species at larval stage(Reference Olsen, Dragnes and Myklebust19–Reference Fontagne, Geurden and Escaffre21,Reference Daprà, Geurden and Corraze27) and in one of our previous studies with Atlantic salmon in seawater(Reference Gu, Kortner and Penn36), insufficiency of phosphatidylcholine has been suggested to result in a disturbed assembly of lipoproteins and transport of lipids across the intestinal mucosa. Another important and confirming result from our previous study was the marked suppression of plin2, whose role is to stabilise the lipid droplets(Reference Xiao, Stahel and Lewis67) and is further suggested to be a surface marker of lipid droplets(Reference Schubert, Blumenthal and Cheng68).
Dietary choline level effects on plasma indicators
For the plasma indicators, the observed positive relationship between lathosterol and LDL-cholesterol and choline level indicates that choline increased the level of CH synthesis in the liver(Reference Cox, Sutherland and Mann69) and accelerated the transport of CH from the liver to peripheral tissue, seen as an increase in the LDL-cholesterol(Reference Lie, Sandvin and Waagbø70,Reference Chimsung, Lall and Tantikitti71) . Similar responses to choline supplementation were also observed in our previous study(Reference Hansen, Kortner and Krasnov3). Most likely, the increased plasma CH levels were also a result of the increasing capacity of the PI to assemble and transport lipoproteins, which are also responsible for the transport of CH from the intestine to the liver(Reference Field and Mathur66).
Dietary choline level effects on performance
The overall growth rate in the present choline dose–response study was within the range observed in fish both under experimental and commercial conditions. However, there were no apparent indications of reduced performance as a result of choline dose nor LMS, for which no significant differences on growth nor macronutrient digestibilities were observed. The present observation of choline not affecting growth is in agreement with some previous studies on adult Atlantic salmon(Reference Espe, Andersen and Veiset-Kent72), channel catfish(Reference Wilson and Poe7) and giant grouper(Reference Yeh, Shiu and Guei73). However, in our previous study with large Atlantic salmon(Reference Hansen, Kortner and Krasnov3) and in several other studies with juveniles from different species(Reference Gibellini and Smith5,Reference Kennedy, Bickerdike and Berge10,Reference Halver, Halver and Hardy13,Reference Hung, Berge and Storebakken74–Reference Jiang, Wang and Liu77) , increased growth with choline supplementation has been observed. The relationship between feed intake, growth and choline requirement should be addressed in future studies.
Conclusion
The results of the present study indicate that a dietary choline level of 3·4 g/kg is required for prevention of LMS and intestinal lipid hypervacuolation in 95 % of the post-smolt Atlantic salmon kept under similar conditions as in the present study. Higher levels may be required at higher feed intakes and/or higher lipid levels in the diet.
Acknowledgements
Thanks to the technicians at NOFIMA Research Station at Sunndalsøra for excellent fish care and management. The authors would furthermore like to thank Ellen Hage, laboratory technician at NMBU, for the valuable technical assistance and to Yanxian Li (NMBU) for statistical assistance. Further thanks to Elvis M. Chikwati and Jinni Gu (both NMBU) for their skillful contribution with histology analyses and to Marie Hillestad (BioMar) for the contribution in the study design.
The present work was partly funded by BioMar AS and The Research Council of Norway through the Industrial Ph.D. Scheme (project no. 223108). The funding body participated in study design but had no role in data collection, analysis and interpretation, decision to publish, or preparation of the manuscript.
The authors’ contributions were as follows: A. K. G. H.: experimental design, performed the molecular analyses, data evaluation and interpretation and manuscript development; T. M. K.: data evaluation and manuscript review, V. D.: sampling, data evaluation and manuscript revision, K. M.: experimental design and manuscript revision, I. B.: biochemistry analyses and data interpretation and manuscript revision, H. J. G.: lipid class analyses and data interpretation and manuscript revision, Å. K.: leadership, experimental design, data evaluation and interpretation and manuscript development. All authors read and approved the final manuscript.
Co-author A. K. G. H. is employed by BioMar.
Supplementary material
For supplementary materials referred to in this article, please visit https://doi.org/10.1017/S0007114520000434